How To create Value Stream Map (VSM)
The new Value Stream Mapping solution found in the ConceptDraw Solution Park continues to extend the range of ConceptDraw DIAGRAM into a business graphics tool that can be used to document processes in any organization. Simply put timeline objects from library and continue to create diagram. After that put it to specific place object that illustrates processes of the production. Many organizations use value stream mapping as a key portion of their lean efforts.

Pic.1 Value Stream Map template.
This Value Stream Map template explains the meanings of the VSM design elements.
This template is contained in the Value Stream Mapping solution from the ConceptDraw Solution Park. It helps you to create VSM diagrams using ConceptDraw DIAGRAM software.
See also Samples:
TEN RELATED HOW TO's:
Project progress on web: delivering project status to remote teams and stakeholders via Skype.
Picture: How To Show Project Progress Peport on Web
Related Solution:
The Critical Path Method (CPM) is an algorithm for scheduling a set of project activities. It is an important tool for effective project management. ConceptDraw PROJECT implements this method to provide the user with a wide set of project management tools.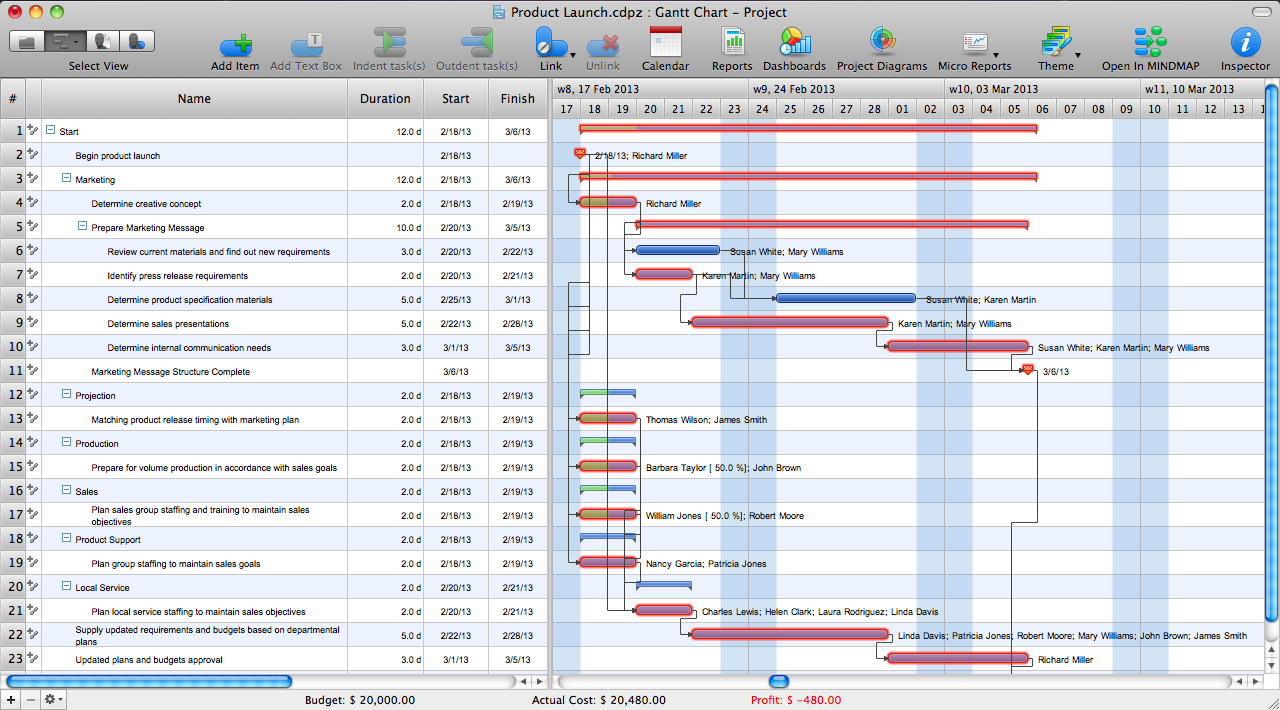
Picture: Critical Path Method in ConceptDraw PROJECT
Related Solution:
In the case of origin of an emergency is very important to have a correct, clear and comprehensible action plan which will help you to react quicker and to make right decisions. ConceptDraw DIAGRAM software extended with Fire and Emergency Plans solution from the Building Plans Area of ConceptDraw Solution Park provides extensive drawing tools for quick and easy creating fire and emergency plans, and also a set of various templates and samples, among them the Emergency Action Plan Template.
Picture: Emergency Action Plan Template
Related Solution:
ConceptDraw offers you a number of ready-made organizational chart templates which you can use in your drawing. They are grouped in topical sets as organizational chart template files.
Use the Organizational Charts Solution for ConceptDraw DIAGRAM to create your own Organizational Charts of any complexity quick, easy and effective.
The Organizational Charts designed with ConceptDraw DIAGRAM are vector graphic documents and are available for reviewing, modifying, converting to a variety of formats (image, HTML, PDF file, MS PowerPoint Presentation, Adobe Flash or MS Visio XML), printing and send via e-mail in one moment.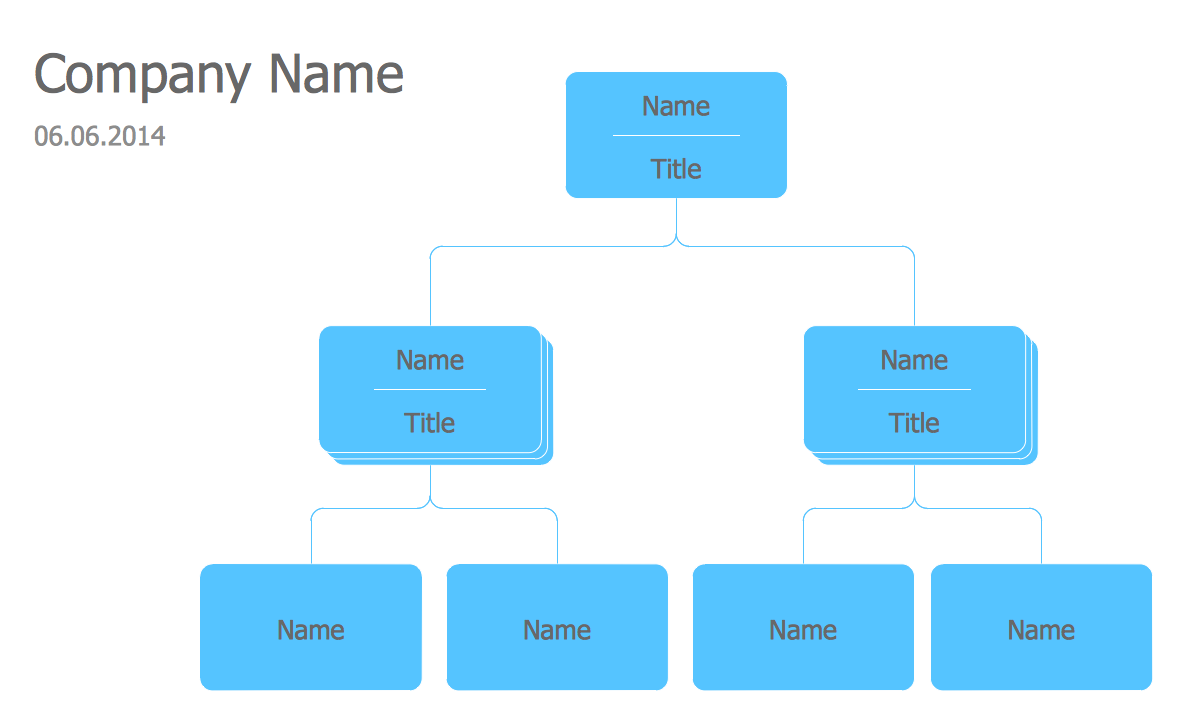
Picture: Organizational Chart Templates
Related Solution:
Value Stream Mapping solution extends ConceptDraw DIAGRAM software with templates, samples and vector shapes for drawing the current state value stream maps.
Picture: Learn how to create a current state value stream map
Related Solution:
Big and complex projects sometimes need some simplification of plans and schedules. That's why Program Evaluation and Review Technique was invented and first implemented in 1958. You can create PERT diagrams effortlessly with ConceptDraw DIAGRAM and share them with your colleagues.
Program Evaluation Review Technique (PERT) is a method that is used to assess and analyze projects. PERT is a valuable tool for the project management practice. PERT gives an assessment and analysis of the time needed to the project completion. A PERT chart is a visual tool that delivers a graphical view of a project timeline. It is used to display the sequences and dependences of project tasks necessary to complete a project. ConceptDraw DIAGRAM delivers the possibility to build a PERT along with other diagrams applied to assist management process by using its Seven Management and Planning Tools solution.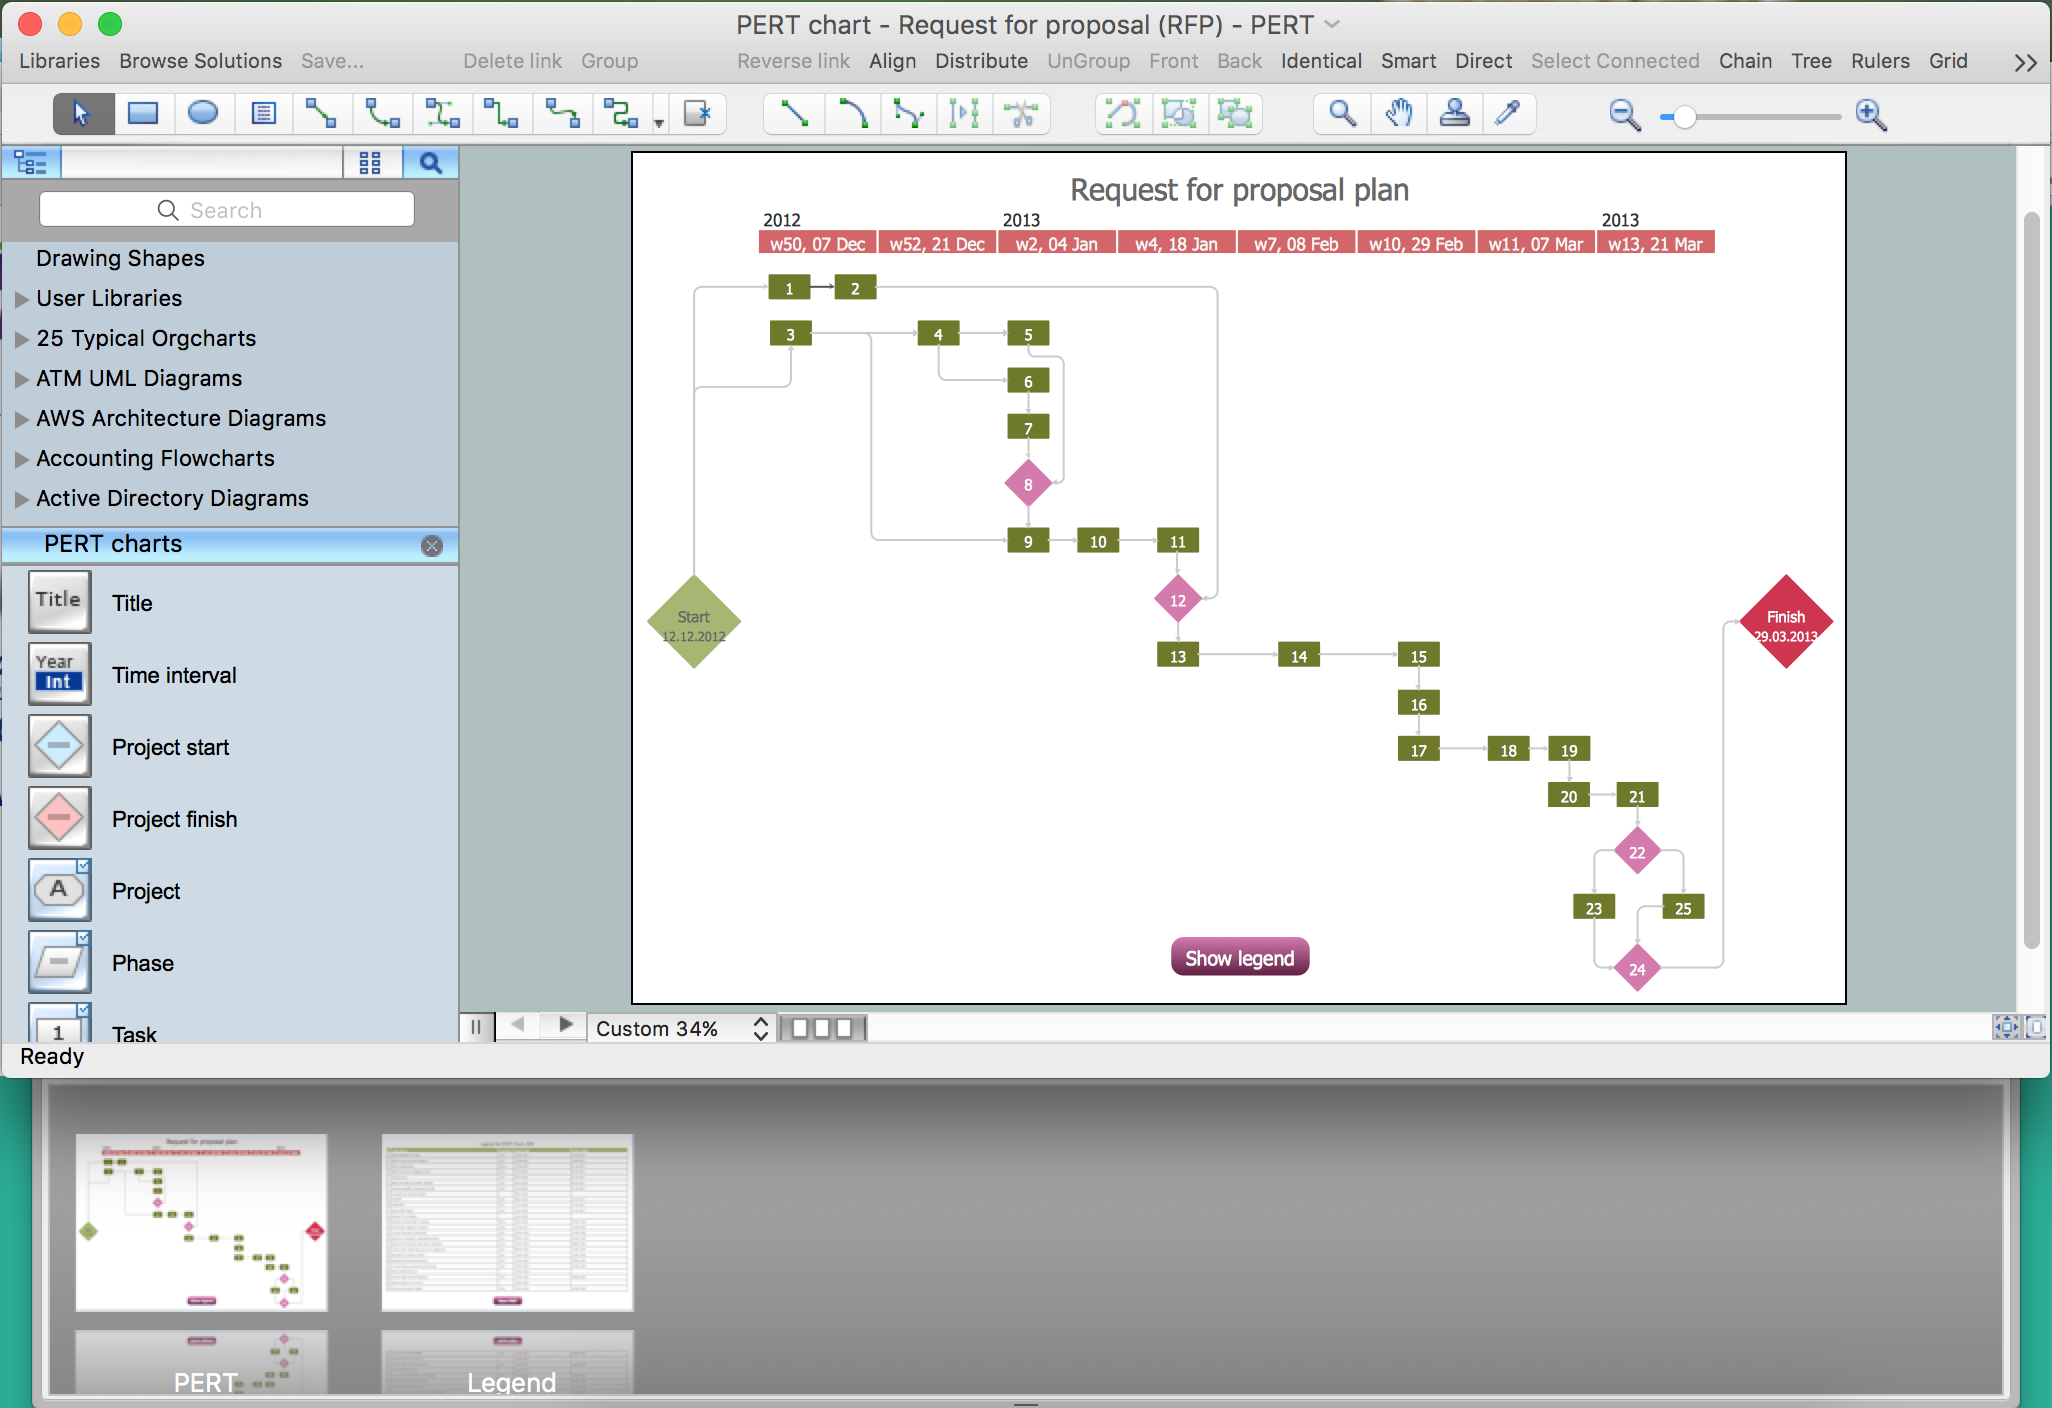
Picture: Program Evaluation and Review Technique (PERT) with ConceptDraw DIAGRAM
Related Solution:
Activity Network Diagram - This sample was created in ConceptDraw DIAGRAM diagramming and vector drawing software using the Seven Management and Planning Tools solution from the Management area of ConceptDraw Solution Park.
This sample shows the PERT (Program Evaluation Review Technique) chart of the request on proposal. A request for proposal (RFP) is a request of the company or the organization to potential suppliers to submit the business proposals for service or goods that it is interested to purchase. The RFP is represented on the initial procurement stage and allows to define the risks and benefits.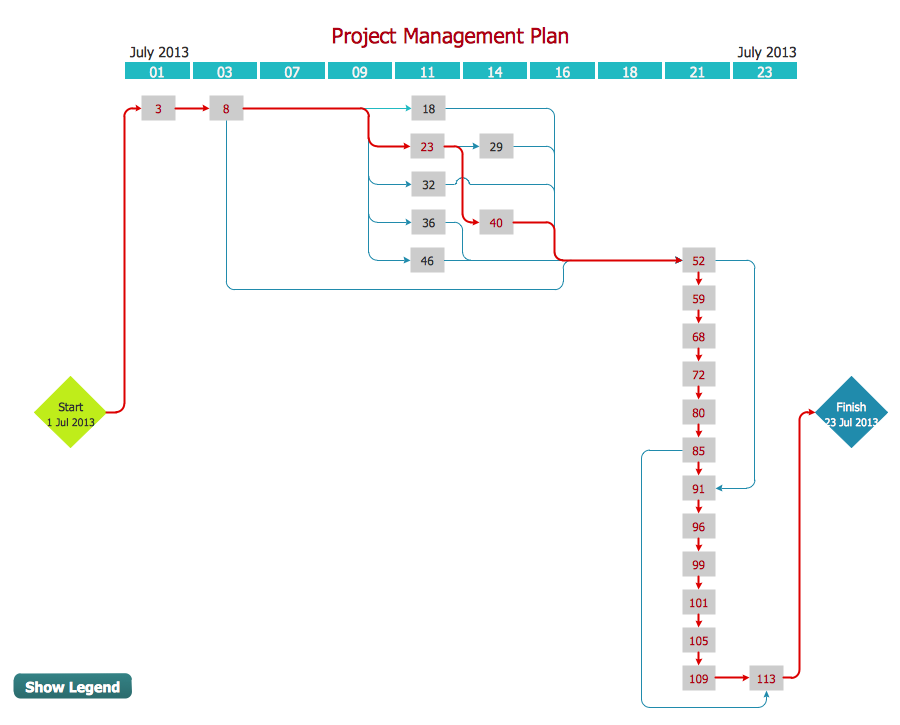
Picture: Activity Network Diagram Method
Related Solution:
PERT Chart Software - Activity Network and Project Evaluation and Review Technique, or PERT, charts are a way of documenting and analyzing the tasks in a project.
ConceptDraw DIAGRAM is a powerful diagramming and vector drawing software for designing professional looking PERT Charts quick and easy.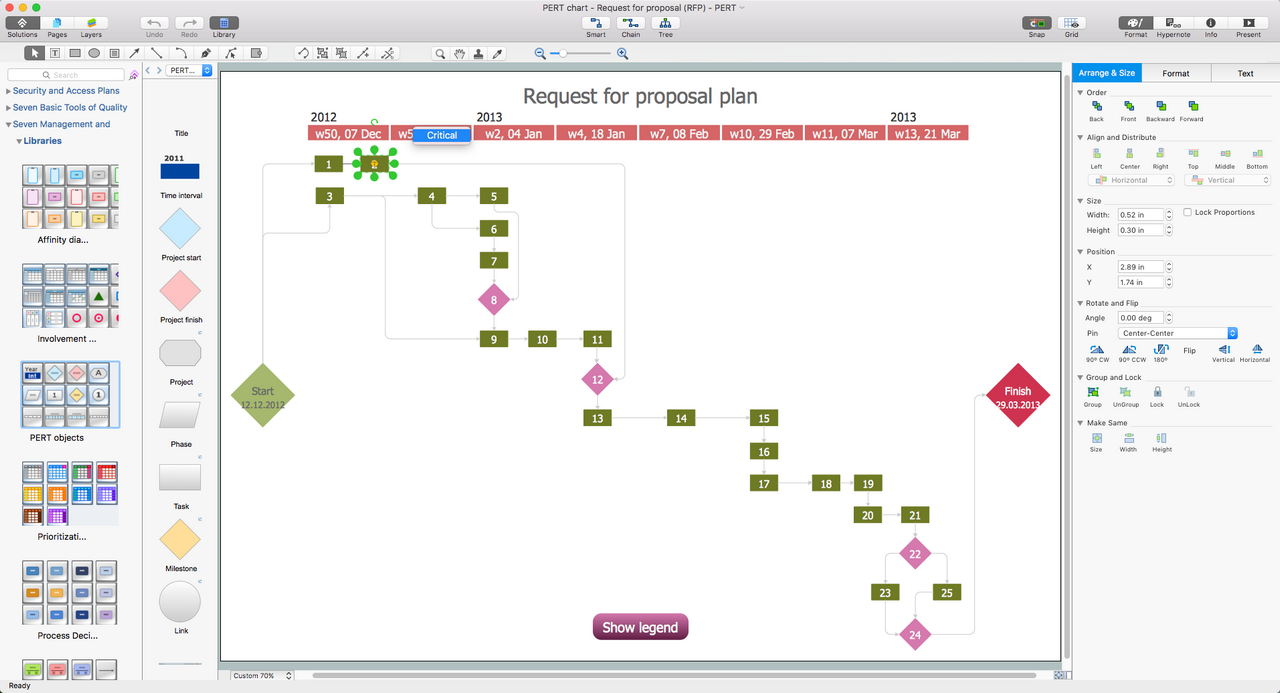
Picture: PERT Chart Software
Related Solution:
ConceptDraw
MINDMAP 16