How to Draw a Line Graph
In your work activity you need regularly draw the line graphs? And each time you ask yourself a question "How to Draw a Line Graph easier and faster?".
The desire to automate the line graphs drawing process led to the creation of Line Graphs solution from Graphs and Charts area of ConceptDraw Solution Park.

Example 1. How to Draw a Line Graph
Drawing the line graphs in ConceptDraw DIAGRAM is very easy process thanks to the predesigned objects of Line Graphs library from the Line Graphs Solution. Drag the needed graph object from the library to document and then assign your values of variables on it. This will take only few minutes and your own line graph will be ready.

Example 2. Line Graph Solution in ConceptDraw STORE
You can also use the predesigned templates and samples of Line Graph Solution located in ConceptDraw STORE. These are variety of line graphs which will be useful as the base for your own line graphs and source of inspiration for their design.

Example 3. Line Graph - France exports of goods and services
This example was created in ConceptDraw DIAGRAM using the Line Graph Solution and shows the line graphs of exporting goods and services in France in 2010-2014.
Use the Line Graph Solution from the Graphs and Charts area to see how to draw a line graph quick, easy and effective in ConceptDraw DIAGRAM
The line graphs designed with ConceptDraw DIAGRAM are vector graphic documents and are available for reviewing, modifying, converting to a variety of formats (image, HTML, PDF file, MS PowerPoint Presentation, Adobe Flash or MS Visio), printing and send via e-mail in one moment.
TEN RELATED HOW TO's:
Local area network connects computers and other network appliances within an area, such as office building or a campus. It can be difficult to provide such network without a predesigned plan. For these purposes you can use network diagram software, which helps you to create LAN network diagrams and office network diagrams quickly and effortless. This will speed up your work and you can save the diagram for the future network improvements.
The following diagram illustrates a network topology of the small office. LAN configuration has a star topology. The local network joins 8 computers among which are several desktop PCs, laptop, two iMacs and iBook. The end-point devices are divided into three groups. Each group is connected to its hub. There is a network printer and a modem, which are interconnected with other devices through a network server. Each computer on the LAN can access the server through a corresponding hub.
Picture: Network Diagram Software. LAN Network Diagrams. Physical Office Network Diagrams
Related Solution:
A floor plan is an essential element of any building or architectural plan. It shows a view from above of relationships between physical features on one floor of a structure. Thanks to modern digital drawing tools, you can easily learn how to create floor plans. Software like ConceptDraw DIAGRAM provides an intuitive and modern interface and an assortment of powerful tools, so that nothing will get in the way of your creativity.
When considering a moving to a new office, or making rearrangement of an office, its better to draw an office floor plan picture. The objective of any office space organization is to maintain a business functionality in a proper manner. This diagram illustrates a layout of usual cubical office. It shows just walls, windows and cubicles. You can use it as a template for your custom office layout diagram. the all you need is to launch ConceptDraw DIAGRAM with its Office Plans solution. Then, you can make changes and add necessary equipment, using the vector objects library, supplied with solution.
Picture: How To Create Floor Plans
Related Solution:
To your mind, deliberation about the profits of creating organizational charts takes more time than actually creating itself. If lack of software is the only thing that stops you, you should know that organizational charts with ConceptDraw DIAGRAM are created within a few minutes. Owing to the great number of ready-to-use templates, you’ll get your chart easily.
Chart is a very handy format for visually depicting official relations of an organization. Usually, an Orgchart (organizational chart) consists from simple geometrical shapes, containing an information on a position, personal data, and the lines that means responsibilities and accountabilities associated with position. ConceptDraw solution designed for making organizational charts enables one to create various org charts effortlessly using special templates and vector libraries.
Picture: Organizational Charts with ConceptDraw DIAGRAM
Related Solution:
ConceptDraw DIAGRAM is a chemistry drawing software that is ideal for designing of various: chemistry drawings, scientific and educational chemistry illustrations, schemes and diagrams of chemical and biological lab set-ups, images with chemical formulas
Picture: Chemistry Drawings
Related Solution:
ConceptDraw Pyramid Diagram software allows drawing column charts using predesigned objects or drawing tools.
Picture: Pyramid Diagram
Related Solutions:
ConceptDraw DIAGRAM is a world-class diagramming platform that lets you display, communicate, and present dynamically. It′s powerful enough to draw everything from basic flowcharts to complex engineering schematics.
Picture: How to Draw a Building Plans
Related Solution:
ConceptDraw DIAGRAM software is a great assistant in electrical engineering and electrical design. It is efficient in creating ✔️ complex and simple electrical designs, ✔️ power generation, transmission, and distribution electrical schematics, ✔️ transformers diagrams, ✔️ electrical schematics with transformers
Picture: Electrical Symbols — Transformers and Windings
Related Solution:
An organization structure reflects the composition and hierarchy of an organization, determines the distribution of authorities and responsibilities. ConceptDraw DIAGRAM diagramming and vector drawing software extended with 25 Typical Orgcharts solution from the Management area of ConceptDraw Solution Park allows effectively represent the organization structure of the company in the form of Organizational Chart.
Picture: Organization Structure
Related Solution:
Sports Selection Flow Chart - This sample was created in ConceptDraw DIAGRAM using the Flowcharts Solution from the Marketing Area and shows the Flow Chart of sport selection. An experienced user spent 10 minutes creating this sample.
Picture: Flow Chart for Olympic Sports
Related Solution:
Event-Driven Process chain Diagrams for improvement throughout an organisation. Best software for Process Flow Diagram. The Event-driven Process Chain (EPC) Diagrams allows managers to plan processes and resources.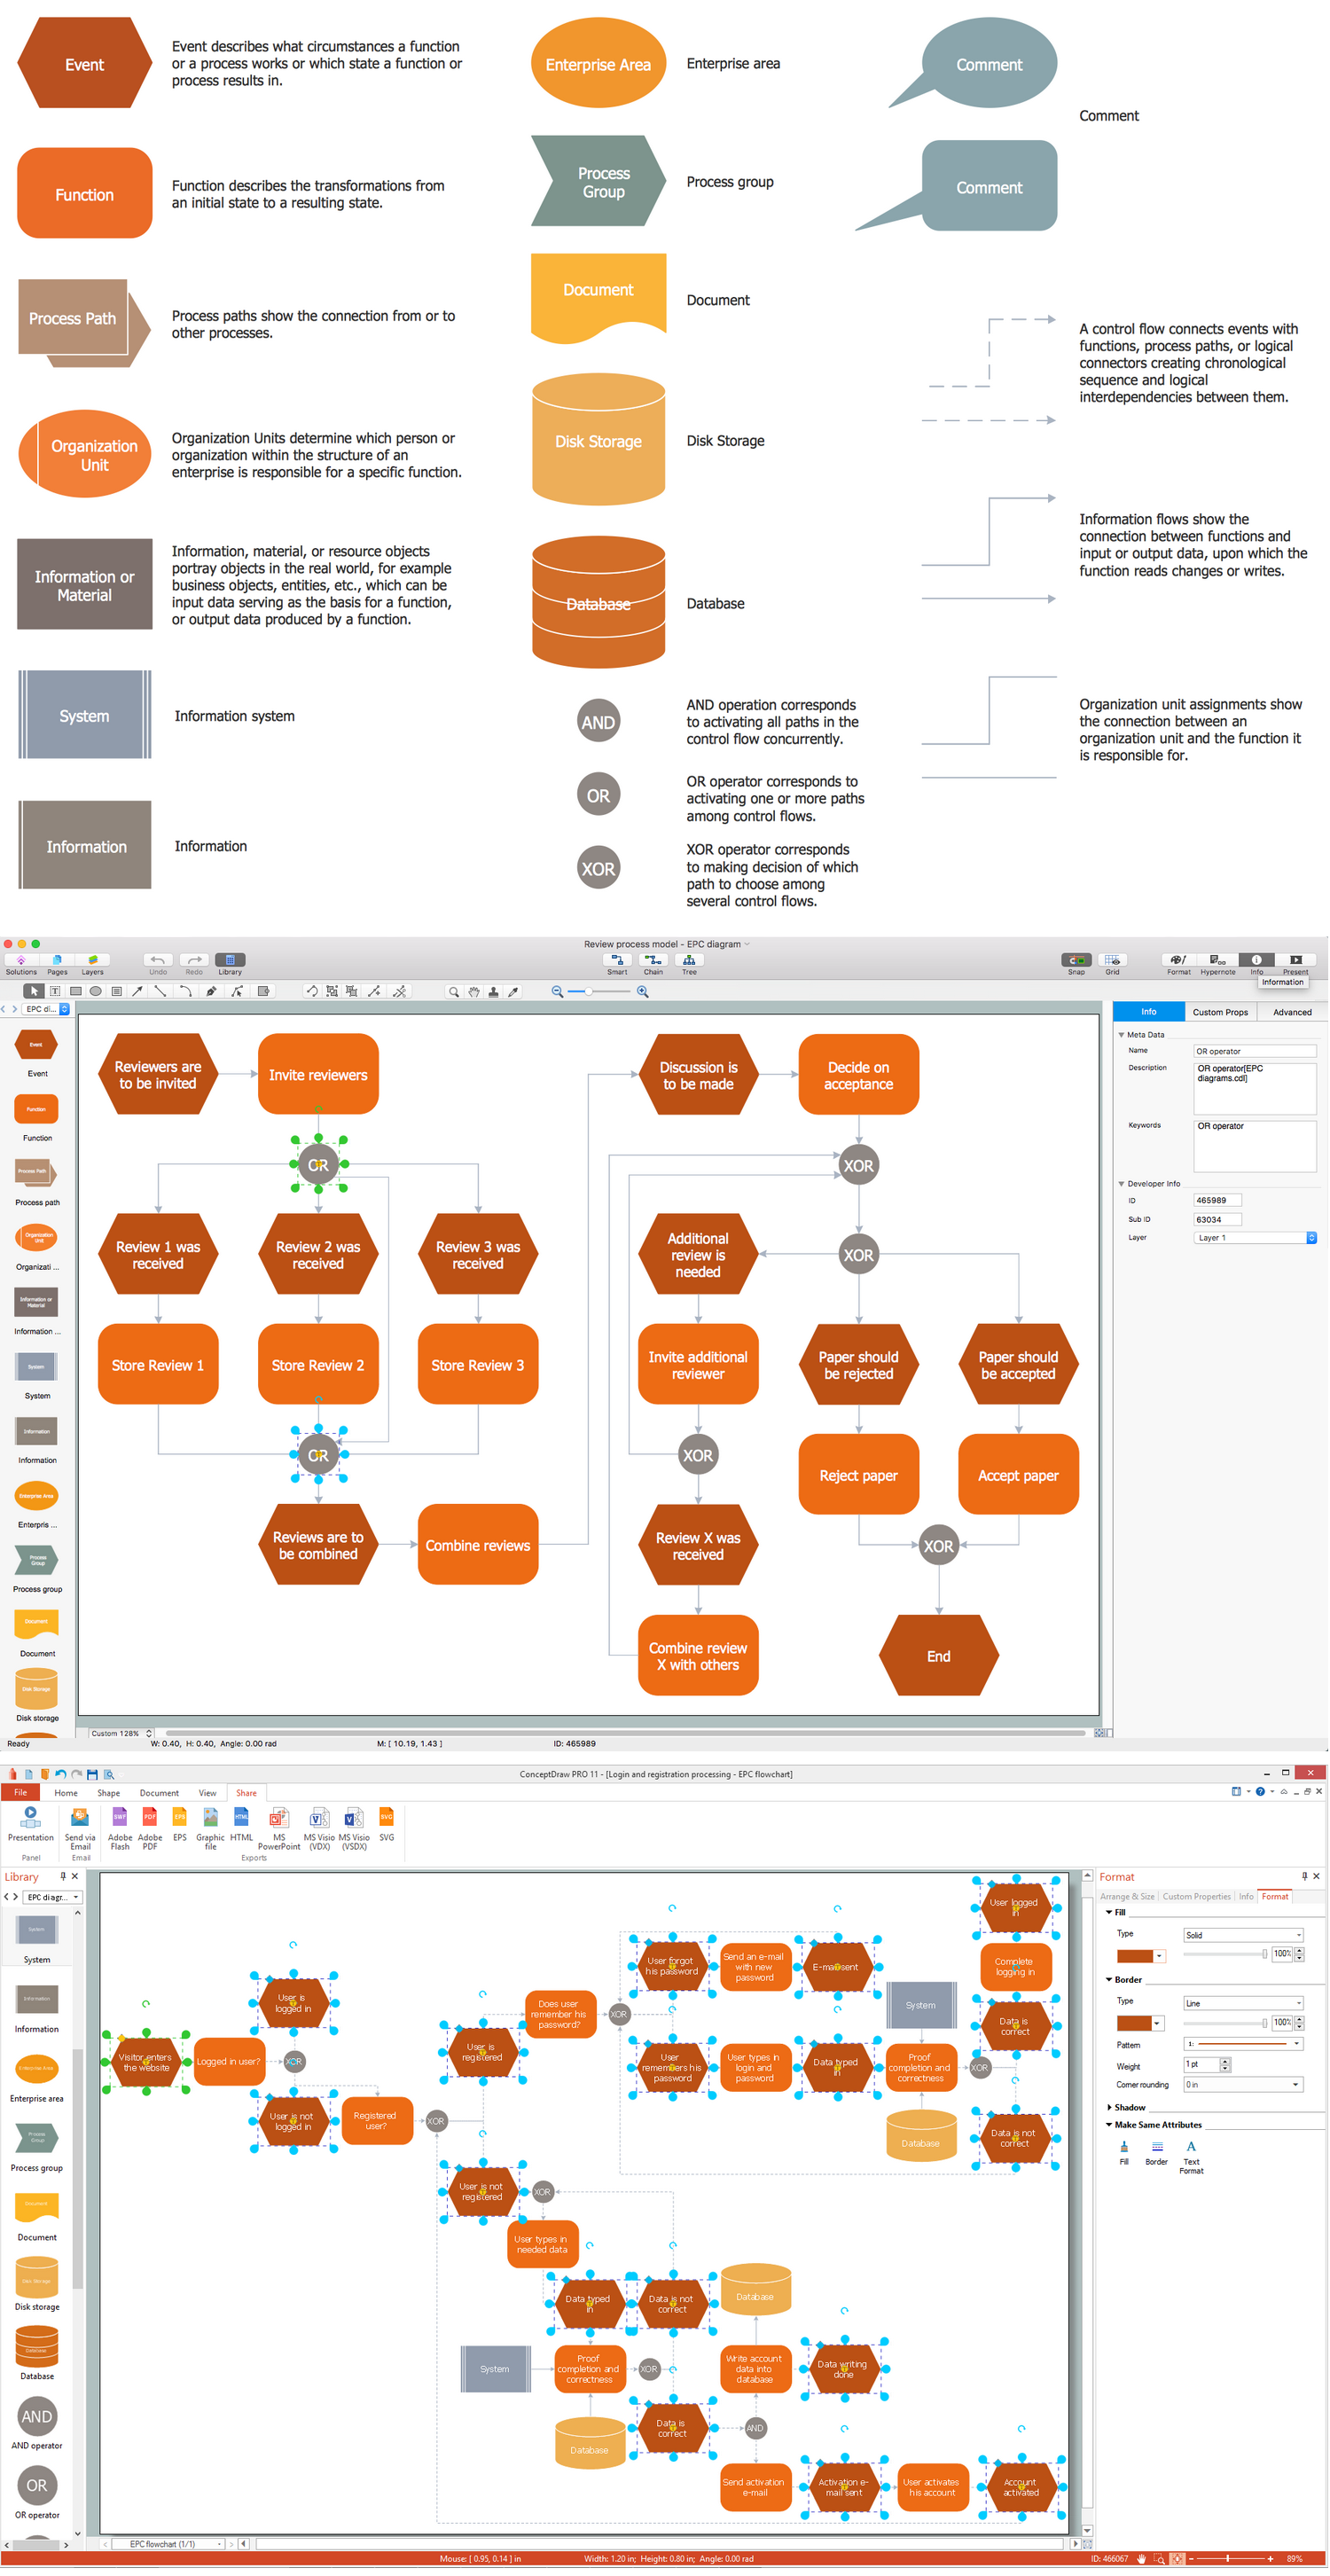
Picture: Business process Flow Chart — Event-Driven Process chain (EPC) diagrams
Related Solution:

