How to Make a Histogram: A Beginner's Tutorial
A Histogram is a visual graphical representation of the numerical data distribution. It classifies values of a data set into specified ranges, classes, or groups called bins. Composed of a set of rectangles representing data of different kinds, a Histogram is similar in appearance to a Bar graph.
A Histogram chart is the most common way to display a frequency distribution of statistical data when the bars show the frequency of data points within specified ranges. Data values are grouped together and put into different classes in consecutive order, typically along the horizontal x-axis, to depict how frequently data of each class occur in the dataset. Each bin is represented by a bar extending from the axis; the bar's height indicates the quantity of data points within a certain range.
Histograms have wide applications in statistics, data analysis, business, economics, finance, and other areas. Statistical Histograms and other types of Histograms provide visualization and an intuitive understanding of data regardless of its amount and complexity. Histograms facilitate comprehension of data distribution and detection of patterns, trends, and outliers even in complex data distributions as well as easier explaining insights.
The Role of Histograms in Data Visualization
Histograms play a significant role in data visualization. They make complex information more accessible by providing an intuitive way to show the distribution of numerical data. Histograms easier data analysis and identification of patterns, help to detect how data is distributed across different ranges and determine the most common values within a dataset and variability just by looking at the height of columns. Thus, variability is lower when the taller bars are close to the mean and higher when they are far from the mean. At the same time, the bars close to the same height signal a fair amount of variability and the curves looking like hills indicate clumps of data and low variability. Wider bins can also reveal more variability.
Histograms facilitate comprehension, comparison, and detection of similarities and differences in distribution, as well as outliers or anomalies to be then explored and analyzed. As a result, Histograms support efficient decision-making based on discovered data trends and help to guide strategies in many fields.

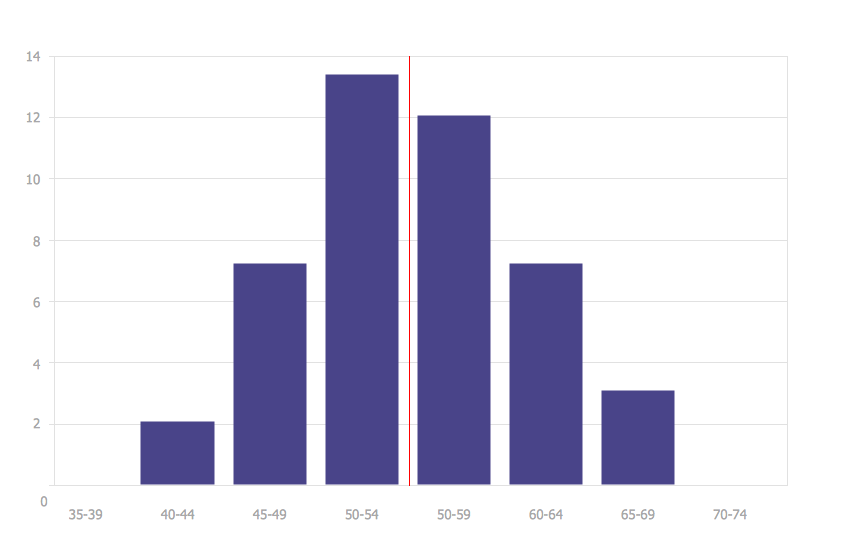
Example 1. Histogram Design with Histogram Chart Maker
Types of Histograms: A Comprehensive Overview
Histograms are classified into several types based on the purpose they serve and the nature of the data they display. According to your needs, a certain type is chosen to visualize data and derive insights the most efficiently.
Basic Histogram — visualizes the distribution of a single variable within specified intervals.
Bimodal Histogram — displays observations from two distinct categories or groups and has two peaks.
Symmetric Histogram — has a vertical central symmetry and reflects a steady distribution pattern.
Normal Distribution Histogram — indicates normal distribution and typically is bell-shaped with the highest bar in the middle and other bars decreasing symmetrically as they move away on both sides.
Skewed Distribution Histogram (Right-Skewed or Left-Skewed) — has the higher bars and peak at the left or right side respectively and the bars' heights decrease as they move to the other side.
Frequency Histogram — displays frequency distribution, the heights of bars indicate the frequency of occurrences.
Relative Frequency Histogram — shows the percentage or proportion of values from the total that fall in each bin.
Cumulative Frequency Histogram — shows the cumulative frequency up to each bin, total number of values or percentage of data points in a dataset that are below a specific value.
Overlaid Histogram — combines multiple Histograms on the same axes, colors them differently allowing possible immediate visual comparison of different datasets.
Stacked Histogram — combines multiple datasets into one Histogram and stacks bars on top of each other allowing visual comparison of distributions of different sets within the same variable.
Smoothed Histogram — provides a smoother representation of the data distribution.
Applications of Histograms
Histogram graph is a powerful tool with a wide range of applications in multiple fields. Histograms visualize the frequency of numerical data and are also useful for comparing visually different quantities, showing changes in data over time, depicting dynamics, and facilitating analysis. The most common applications include:
| # | Field |
|---|---|
| 1. | Statistics |
| 2. | Data Analysis |
| 3. | Quality Control |
| 4. | Finance |
| 5. | Business |
| 6. | Economics |
| 7. | Market Research |
| 8. | Machine Learning |
| 9. | Manufacturing |
| 10. | Medical Research |
| 11. | Image Processing |
| 12. | Survey Analysis |
| 13. | Education |
| 14. | Environmental Studies |
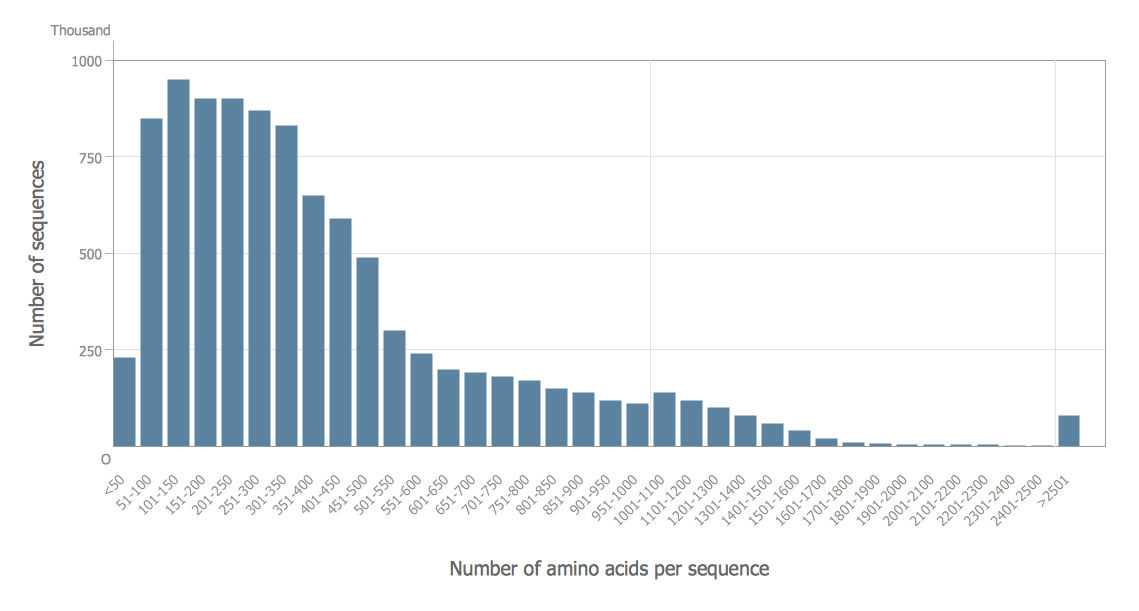
Example 2. Easy Histogram — Amino Acid Length Distribution 2010
Histograms in Statistical Analysis
Histograms are a fundamental tool in statistical analysis due to the visual advantages they provide. They enable analysts to explore, interpret, compare, and communicate data effectively, as well as implement and assess statistical tests, and forecast. Histograms provide data visualization that assists in a clear understanding of data distribution across different ranges, enhances data interpretation, helps to identify key characteristics of the dataset, patterns, and trends, detect unusual observations, gaps in the data, and points that fall far from the main distribution (outliers). Histograms facilitate assumption checking and the application of statistical methods, such as regression analysis, normality assumption, and others. They facilitate comparison that is often used in statistics, for example, to compare data for different periods of a single year or the same period in different years, and as a result, facilitate decision-making and forecasting.
Application of Histograms in Data Science and Machine Learning
Being used in data science and machine learning, Histograms help data scientists and machine learning practitioners visualize the distribution of model parameters and explore whether data correspond to specific distributions, such as normal, bimodal, skewed, edge peak, Poisson, or any other distribution. Histograms are used in exploratory data analysis and feature engineering, help to improve preprocessing, model evaluation, and interpretation, and overall are useful at any stage of machine learning or data analysis. They help to identify anomalies, patterns, and trends in data, output scores of the machine learning system, build predictive models, assess model performance, identify areas for improvement, and make informed decisions about required transformations to improve model performance. Anomalies, outliers, or unusual data points can significantly impact model training, therefore their identification is especially important and is valuable for efficient data cleaning and preprocessing.
Using Histograms To Improve Business
Histograms have significant value when applied in business. In particular, they help to improve decision-making, risk assessment, resource allocation, forecasting trends, quality control, development of marketing and investment strategies, and enhance the competitiveness of the business. The visualization of data distributions helps to evaluate the efficiency of marketing campaigns and adjust strategies as needed, analyze performance metrics, sales, and customer behavior in purchases, identify their preferences and buying patterns, and detect anomalies. Histograms help to segment the customer base based on various metrics and then implement target marketing based on the obtained data, identify areas for improvement, and set realistic performance goals.
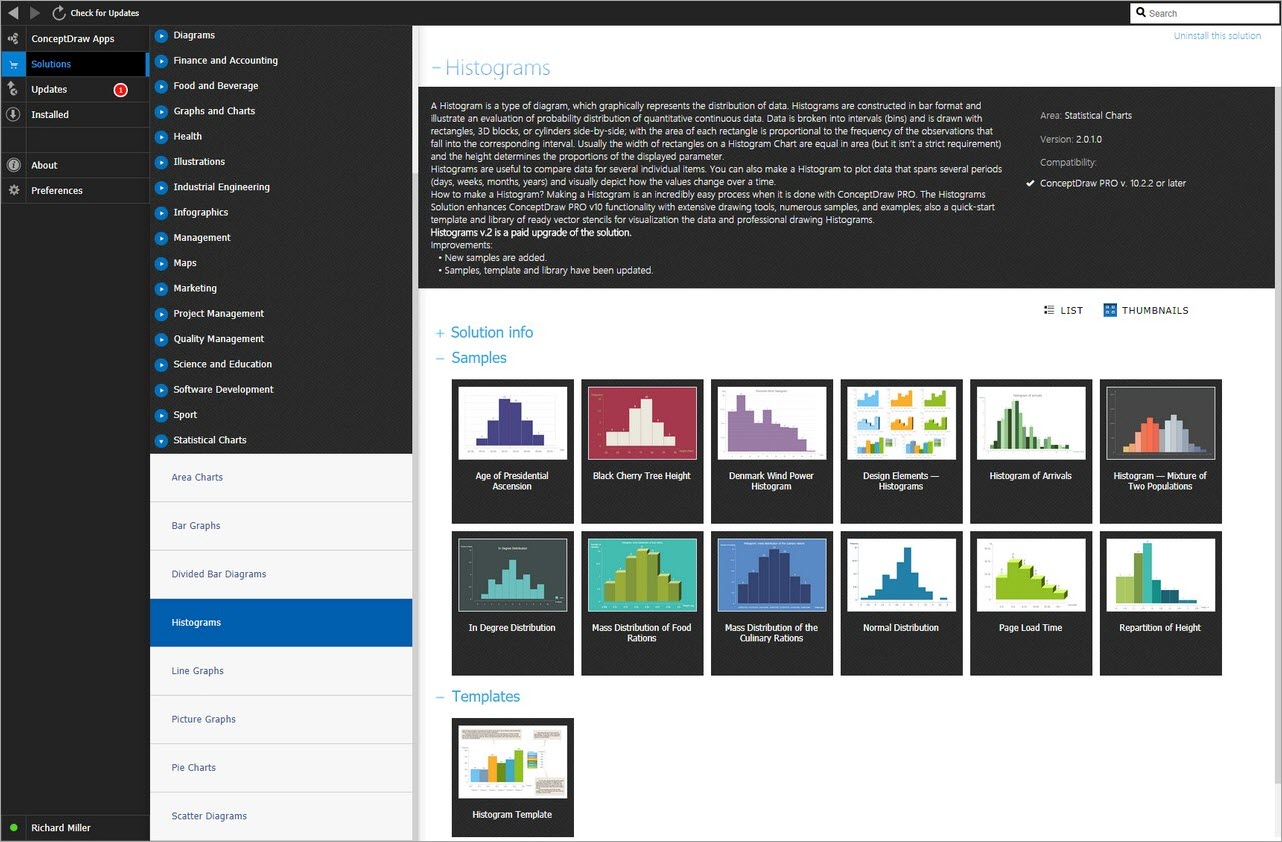
Example 3. How To Make a Histogram — Histograms Solution in ConceptDraw STORE
Easy Steps to Make a Histogram
Creating a Histogram comprises the following simple steps:
- Collecting and preparing data you want to visualize. At this stage, it is important to ensure that data are clean, organized, and ready for future processing.
- Determining the range of values, bins, and their width.
- Choosing a convenient software to generate a Histogram as simply and quickly as possible. We recommend using the ConceptDraw DIAGRAM software enhanced with the Histograms solution. The extensive solution's functionality, Histogram drawing tools, libraries of pre-made vector design elements, and professionally designed examples, samples, and templates will assist you at each stage of drawing and analyzing your Histograms.
- Use one of the ready Histogram objects and customize it using the commands from the Action button menu. Set the number of categories, show or hide the axes or table, add axis labels, show percentage values, set a minimal or maximum value for the horizontal axis, or apply any other action, as needed.
- Fill the table with your data to depict them in a Histogram automatically.
Now your Histogram is ready and you can analyze it to draw insights about the Histogram data distribution and interpret data correctly and efficiently.
The Best Histogram Design Software — ConceptDraw DIAGRAM
ConceptDraw DIAGRAM software extended with Histograms solution from the Graphs and Charts area is a powerful Histogram maker and will effectively help you in Histogram drawing.
It's very useful and convenient to use the ready predesigned vector elements from the Histograms library of Histograms solution to create a Histogram of any type fast and simply. You can create a new ConceptDraw document and then drag the appropriate Histogram object from the library or use the pre-made template or example to quick-start.
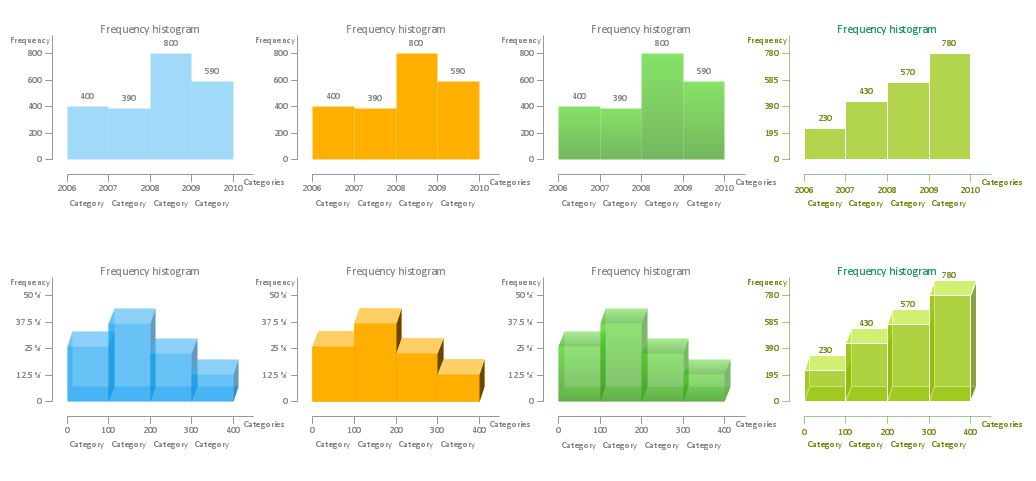
Example 4. Histogram Graph Maker — Histograms library Design Elements
Examples
You can also choose any favorite Histogram from Histograms examples included in the solution and available from the ConceptDraw STORE. All they are available for opening, viewing, and editing.
Using predesigned templates, samples, and examples as the base for your own Histograms is the easiest way that can be contrived to create Histogram graph — you will need only change the values on your own.
The Histograms designed with ConceptDraw DIAGRAM Histogram software are vector graphic documents and are available for reviewing, modifying, and converting to a variety of formats (image, HTML, PDF file, MS PowerPoint Presentation, Adobe Flash, or MS Visio), printing, and sending via e-mail in one moment.


