How to Make an Infographic
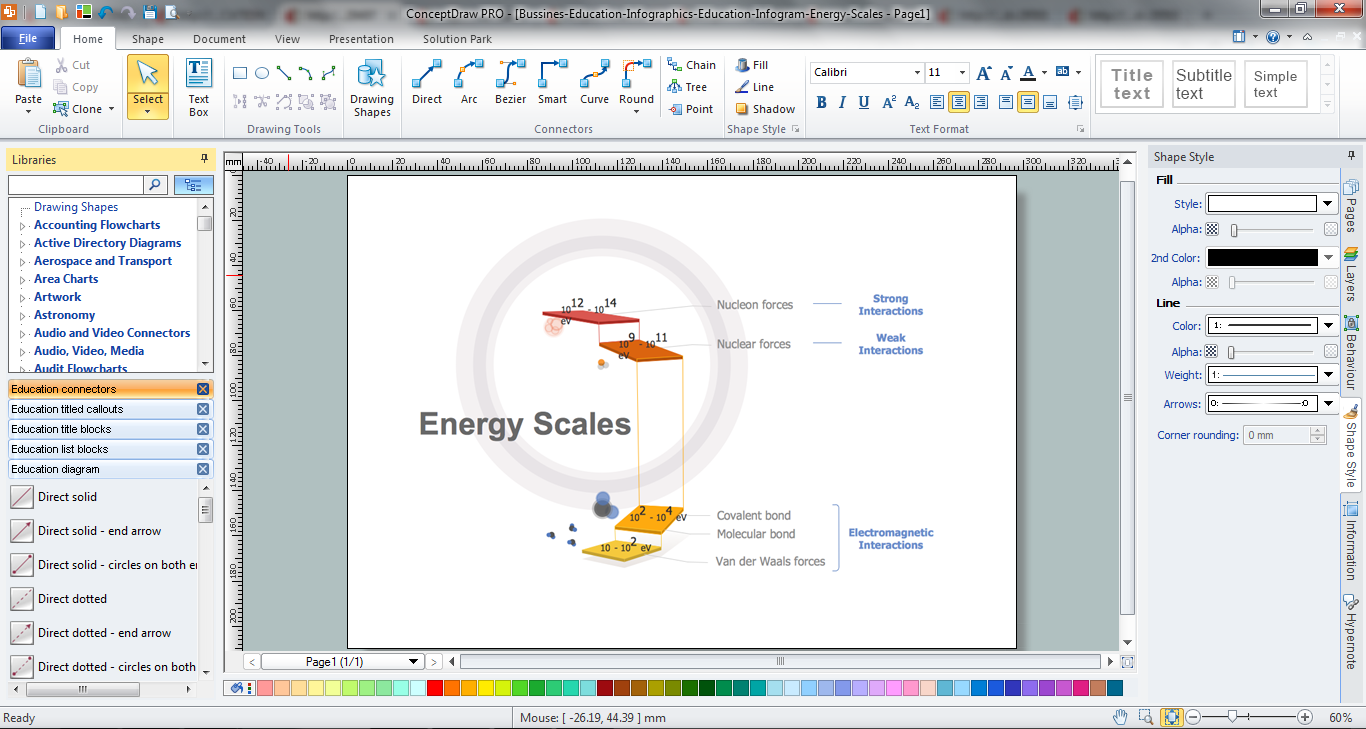
How to make an infographic quick and easy? The perfect way is to use the ConceptDraw DIAGRAM diagramming and vector drawing software extended with Education Infographics Solution from the Business Infographics Area.

Example 1. How to Make an Infographic in ConceptDraw DIAGRAM /p>
Education Infographics Solution offers the extensive drawing tools and the set of 11 libraries with wide variety of predesigned vector clipart:
- Education Backgrounds
- Education Callouts
- Education Charts
- Education Connectors
- Education Diagram
- Education Indicators
- Education List Blocks
- Education Maps
- Education Pictograms
- Education Title Blocks
- Education Titled Callouts
which will help you design any education infographics that are so useful and popular in the education process.
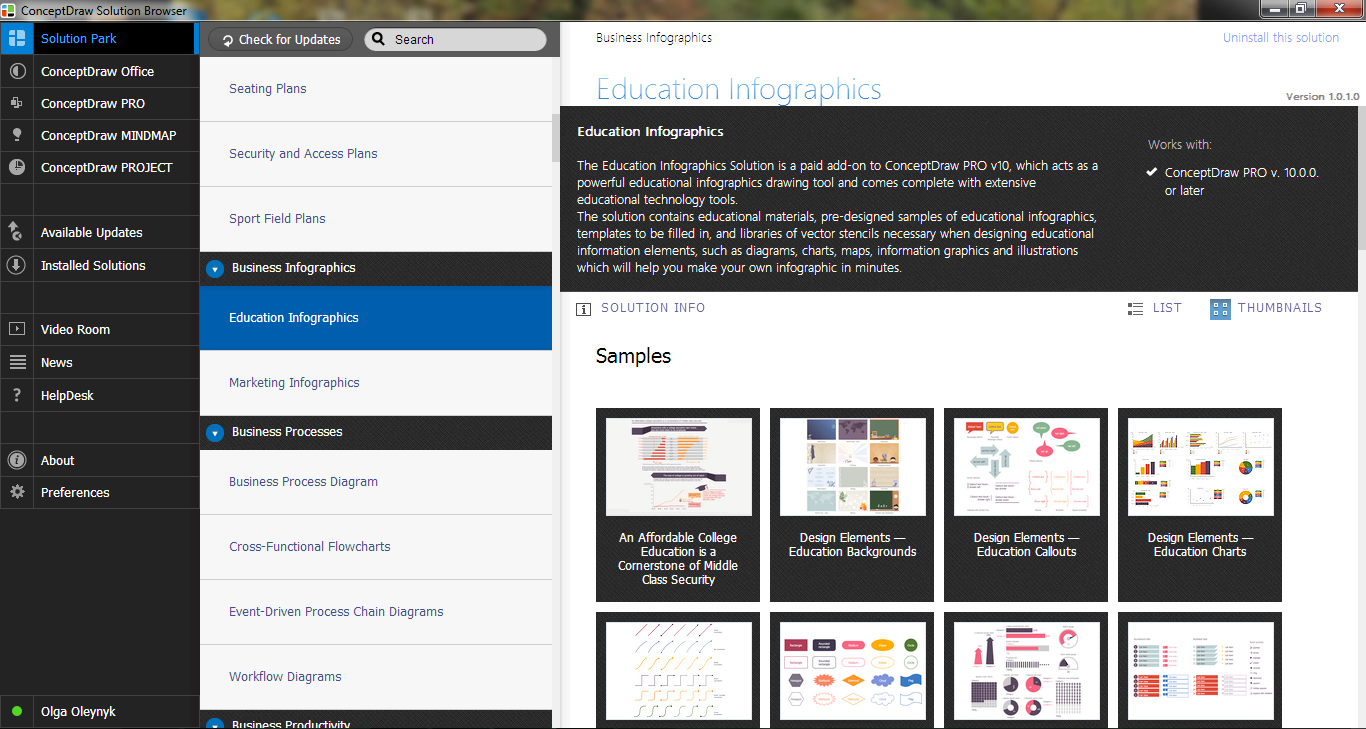
Example 2. Education Infographics Solution in ConceptDraw STORE
Turn also your attention to the collection of templates and samples included in Education Infographics Solution and available from ConceptDraw STORE. These are the good examples that will be exactly useful for you.
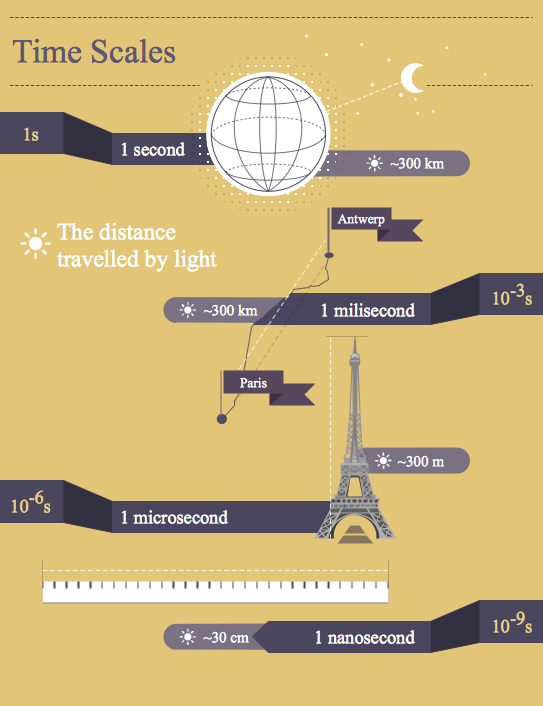
Example 3. How to Make an Infographic - Education Infogram Time Scales
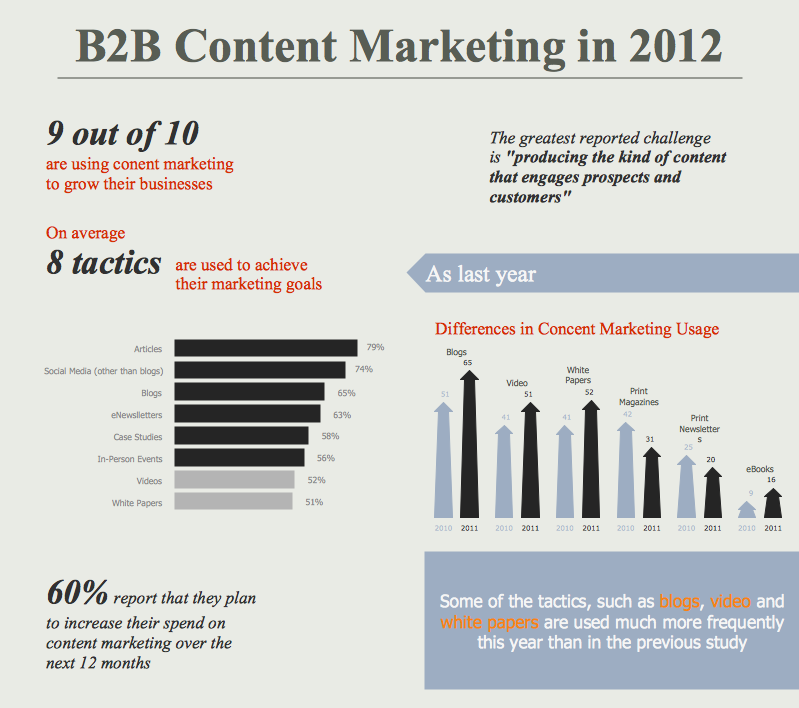
The education infographics samples you see on this page were created in ConceptDraw DIAGRAM using the vector objects from the Education Infographics Solution libraries. These examples successfully demonstrate solution's capabilities and are the good answer on the question how to make an infographic the most easy and quickly. An experienced user spent 10 minutes creating every of these samples.
All source documents are vector graphic documents. They are available for reviewing, modifying, or converting to a variety of formats (PDF file, MS PowerPoint, MS Visio, and many other graphic formats) from the ConceptDraw STORE. The Education Infographics Solution is available for ConceptDraw DIAGRAM users.


