How to Prepare Learning Presentations for Training
Using the ConceptDraw Social Media Response solution improves quality of content in social media and helps build an active customer community. It allows companies to be more effective in timely messaging thanks to the ability for rapid response to a customer′s post in social media. This saves budget for companies who use social media for promoting and as a lead generation tool.
The Social Media Response solution creates interactive social media flow charts and action mind maps. The solution includes a video tutorial and a number of samples helping social media teams refine and organize their response process. There are materials to help trainers and consultants develop a social media strategy and provide training for social media groups on how to effectively accomplish their daily work.
Tips for preparing a learning presentation intended for training a team.
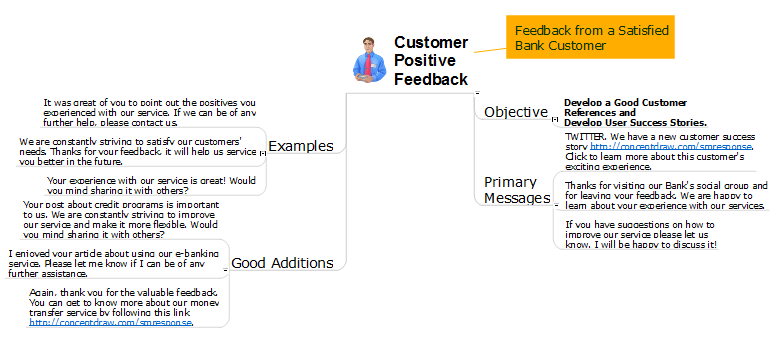
Sample 1. Customer Positive Feedback
See also Samples:
-
Mind Maps
-
Idea Communication
-
Marketing — Social Media
TEN RELATED HOW TO's:Interactive tool helps you find the appropriate response to social media mentions quickly. There are materials to help trainers and consultants develop a social media strategy and provide training for social media groups on how to effectively accomplish their daily work. Picture: How to Present a Social Media Response Plan DFD to Your TeamRelated Solution:Timeline is a type of diagram which illustrates the series of events in a chronological order on a linear timescale. How to make a timeline? It is convenient to use a modern powerful software. ConceptDraw DIAGRAM diagramming and vector drawing software extended with Timeline Diagrams solution from the Management area is exactly what you need.
 Picture: How to Make a TimelineRelated Solution:Mac compatible remote presentation, A simple way to share your presentation remotely via Skype. All participants receive presentation file.
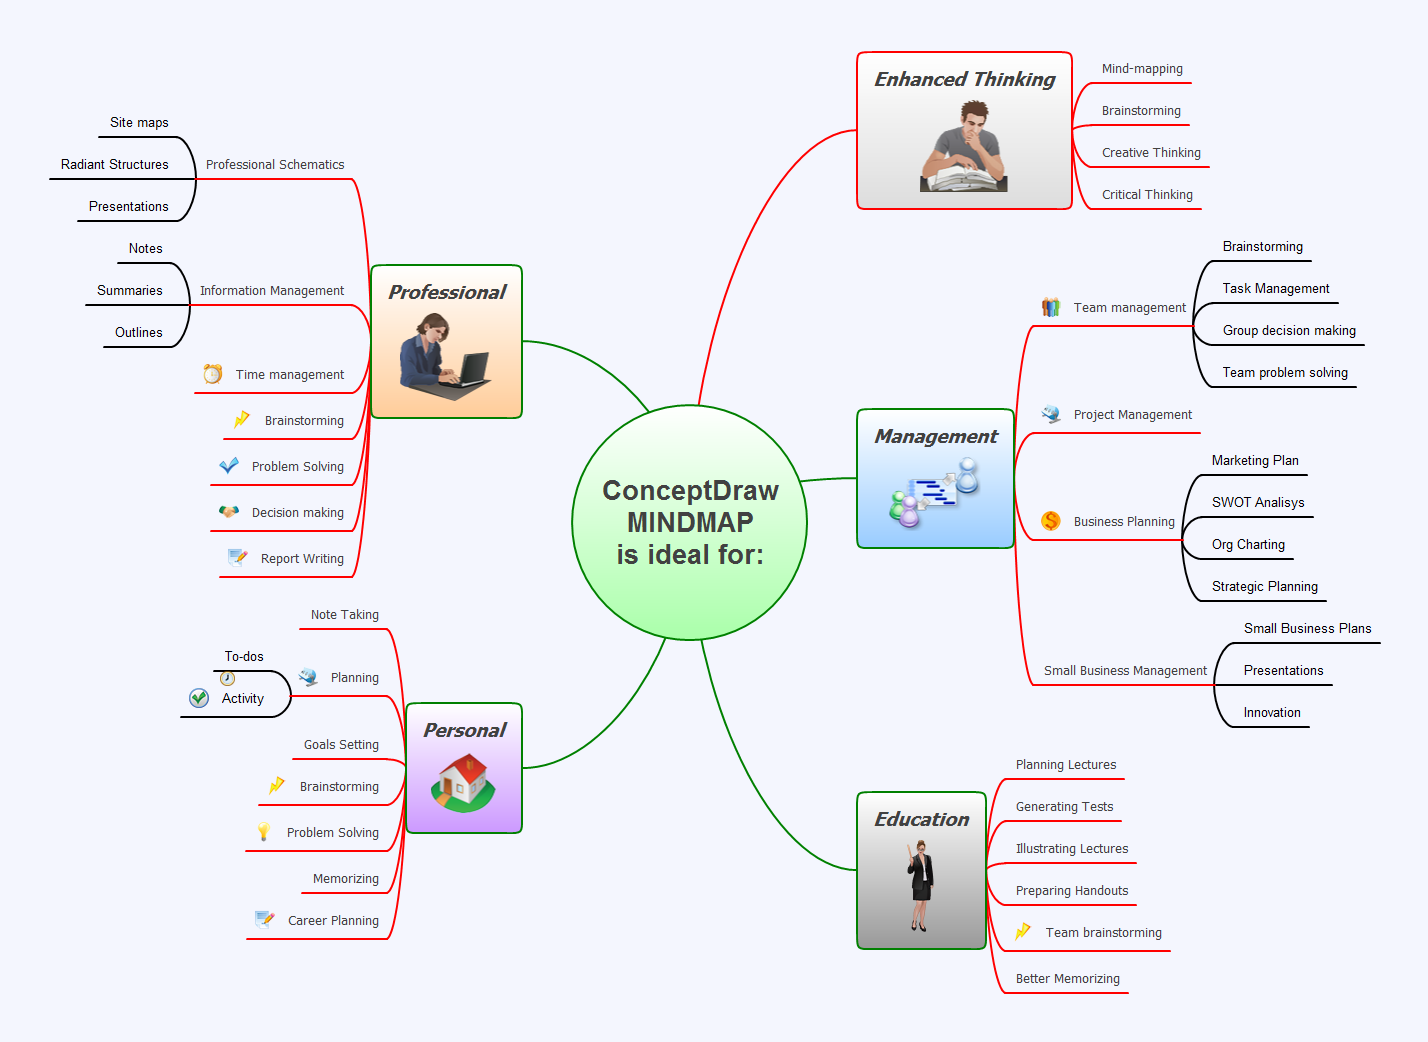 Picture: Mac Compatible Remote PresentationRelated Solution:E-Learning in Schools: Online Language Teaching tools. E-Learning software for remote presentations with Skype. Best practices for eLearning.
 Picture: Language School E-LearningRelated Solution:Create business process diagrams (BPMN 2.0.) with ConceptDraw using professional looking templates. ConceptDraw is business process improvement tools.
 Picture: Business Process Modeling Notation TemplateTeachers use Skype in the classroom to enrich experiences for students. Using mind mapping software in virtual classrooms for brainstorming and presentation make an effective way to gather information and track results.
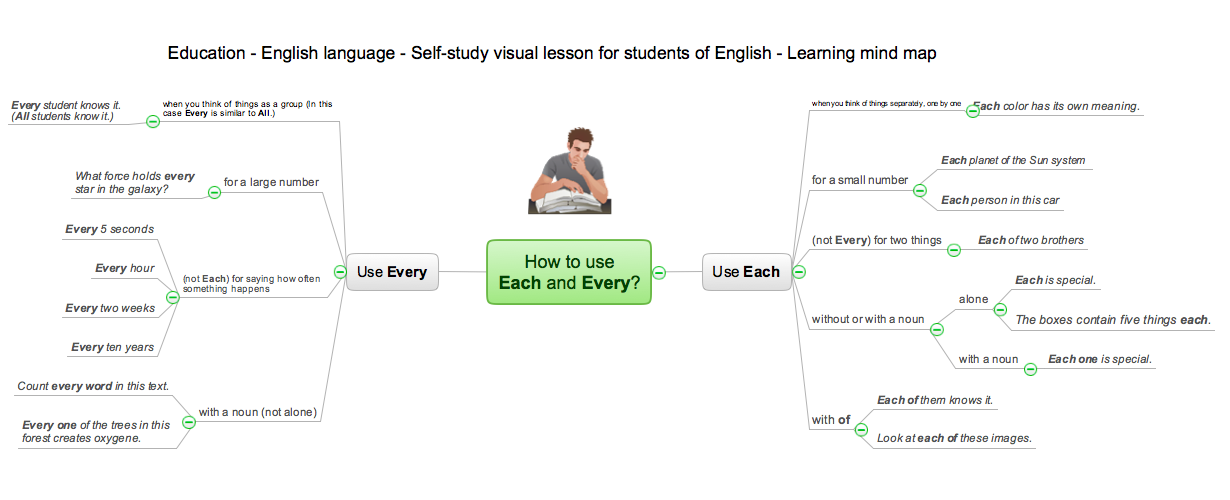 Picture: How Teachers Use Skype for eLearningRelated Solution:This sample shows the Flowchart that displays the layout and work flow of the cloud marketing platform. This diagram has a style of the marketing brochure. This style displays the central product that is related to the other issues. Using the ready-to-use predesigned objects, samples and templates from the Flowcharts Solution for ConceptDraw DIAGRAM you can create your own professional looking Flowchart Diagrams quick and easy.
 Picture: Flowchart Marketing Process. Flowchart ExamplesRelated Solution:Which trends are on the horizont of social media? What’s we have to prepare for? Look into the future with ConceptDraw products.
 Picture: The Means to Respond to Social Media MentionsRelated Solution:In any unclear situation create a workflow diagram. Workflow diagrams help to understand processes, find bottlenecks and fix the process. When you create workflow diagram using ConceptDraw DIAGRAM software you are able to focus on thinking, not drawing, that makes you as effective as possible.
 Picture: Create Workflow DiagramRelated Solution:eLearning Solutions: Free Platform for Remote Learning. Skype as a remote education tool. Digital Learning Technologies.
 Picture: Skype as eLearning PlatformRelated Solution:ConceptDrawDIAGRAM 18