The human genome is a set of nucleic acid sequences in a cell of a human organism. It contains hereditary information. The human genome consists of 23 chromosome pairs (22 pairs of autosomal chromosomes and one pair of sex chromosomes X and Y) placed in cell nuclei and in a small deoxyribonucleic acid (DNA) molecule in mitochondria. An approximately three billion of base pairs of DNA make up the entire set of chromosomes of the human body.
The human genome includes both protein-coding regions of DNA and noncoding regions. The first ones encode all the human genes. The coding DNA sequences account for 20—25 hundred active genes, however, it is only 1.5% of the genome. The rest ones do not encode any genes. These are non-coding RNA genes, regulatory DNA sequences, LINEs, SINEs, introns, and some other objects the function of which is non-clarified.
A lot of researches on the study of the human genome was conducted in the last decades. The first human genome sequences were published in February 2001 by the Celera Corporation and Human Genome Project. By 2004 almost all DNA sequence of the human genome was disclosed by DNA sequencing method, just 341 gaps in the sequence left. The completion of the Human Genome Project's sequencing was announced by the publication of a draft genome sequence. These data gave a good base for developing the whole biomedical science, genetics, anthropology, forensics, and much more from this area. They triggered new discoveries in the medical field and influenced progress in the diagnosis and treatment of different diseases. However, the sequence of the human genome is not yet fully understood at the moment.
The human genome is a unique sequence. It contains the fundamental information about a human, about the capability of a body to replicate, repair, renew the cells, survive, and maintain itself. There are no two identical human genomes on Earth, except the genomes of identical twins.
The human genome is represented as a collection of long polymers of DNA composed of constituent bases of adenine (A), cytosine (C), guanine (G), and thymine (T). Moreover, this sequence is not static, the different changes permanently arise in it and these can be as advantageous or neutral changes, as harmful. Being passed from a parent to child in a worse case they can even cause a decrease of surviving or fertility.

Example 1. Human Genome
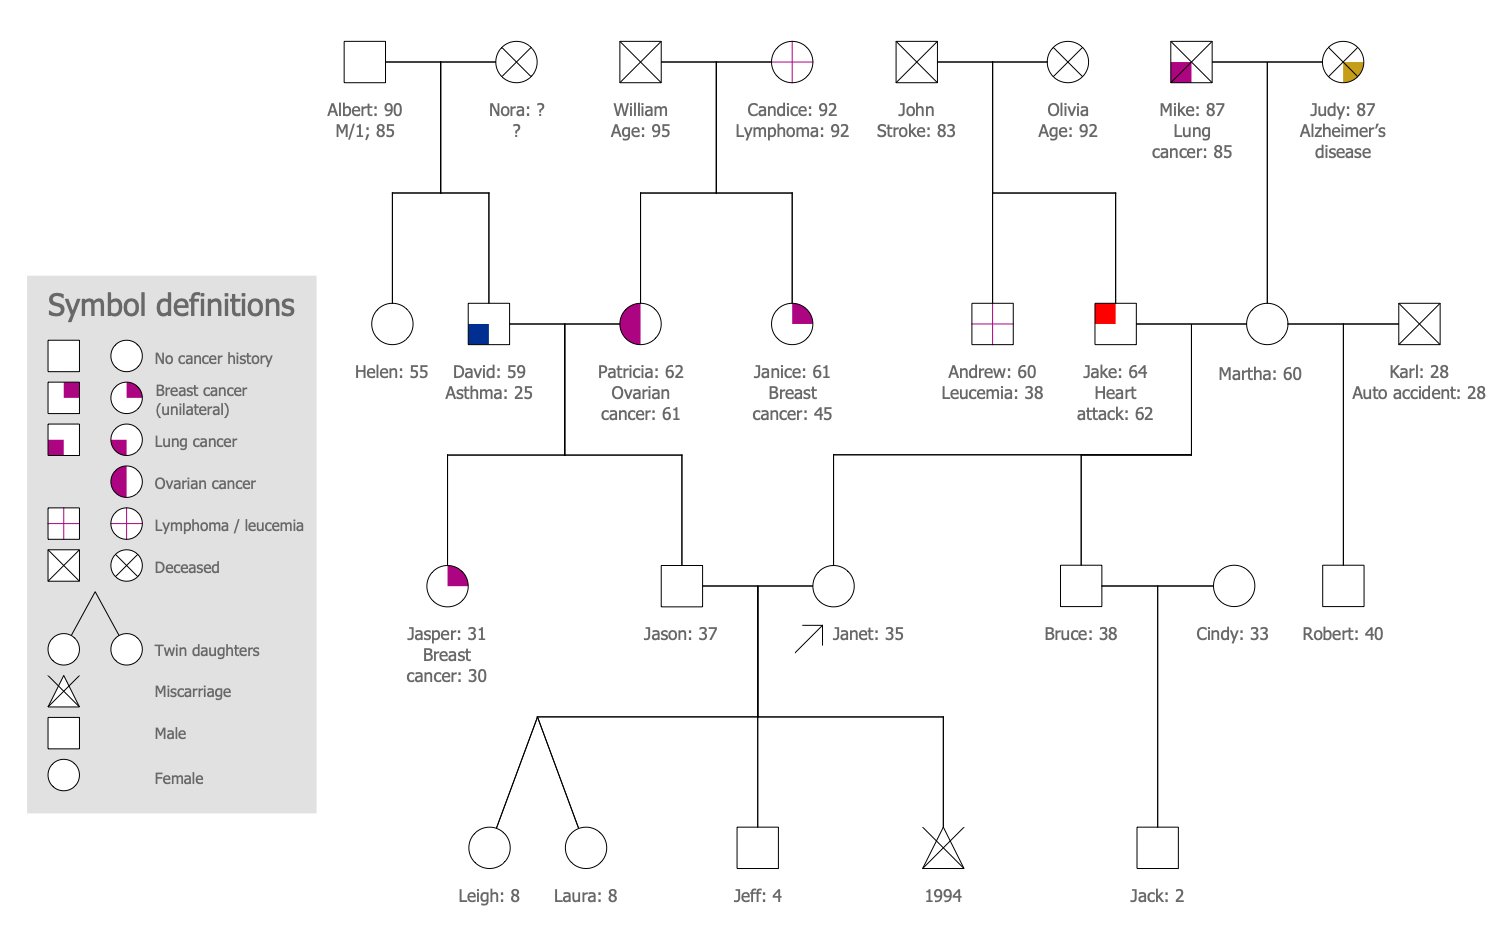
The human's genome contains all changes that happened to his ancestors. To track the genealogical tree, ancestors, and interactions within a family over multiple generations and to identify patterns the Genograms are used. A special type of Genograms including a graphical representation of the medical conditions for the family members, family history of illnesses is called a Medical Family Genogram. The diagrams of this type can be easily designed in ConceptDraw DIAGRAM software using the tools of the Genogram solution. Typically, it includes information about age, diseases and hereditary traits, cause of death, and much more information from medical history. These data are important for future generations in order to warn about the risks and predisposition for some diseases.

Example 2. Medical Family Genogram
The illustrations you see on this page were created in ConceptDraw DIAGRAM software using the drawing tools of the Genogram Solution. They successfully demonstrate the solution's capabilities and professional results you can achieve. An experienced user spent 10-15 minutes creating each of them.
Use the powerful tools of the Genogram Solution for ConceptDraw DIAGRAM software to create your own illustrations and diagrams of any complexity fast and easy, and then successfully use them in your work activity.
All source documents are vector graphic documents. They are available for reviewing, modifying, or converting to a variety of formats (PDF file, MS PowerPoint, MS Visio, and many other graphic formats) from the ConceptDraw STORE. The Genogram Solution is available for all ConceptDraw DIAGRAM users.
TEN RELATED HOW TO's:
Accounting is a cornerstone of any business, it’s basement. If you want to have a visual representation of your finance management, use audit flowchart symbols to document the money flow. Although some would say that accounting is boring, it is very a responsible duty.
The audit flowchart symbols is supplied with ConceptDraw Audit Flowcharts solution as a vector objects library. Together with Conceptdraw Drawing capabilities it forms the helpful tool for audit process planning and setting the steps of audit by designing audit flow charts. Audit Flow charts are used to organize fiscal information tracking process as well as in accounting, finance and investment management.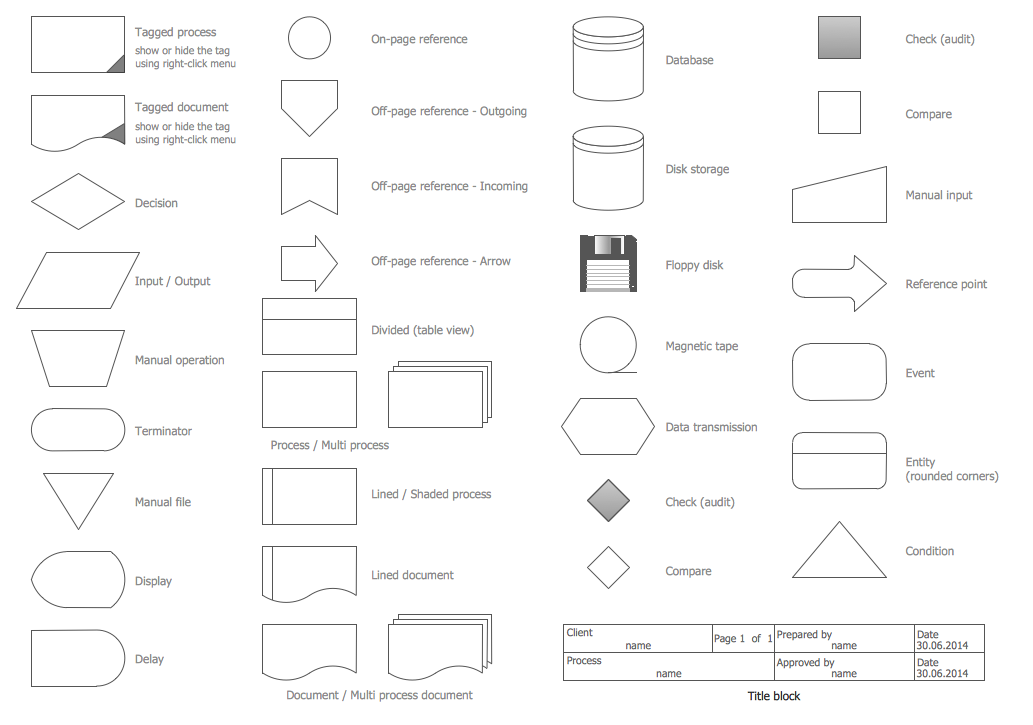
Picture: Audit Flowchart Symbols
Related Solution:
Data structure diagram (DSD) is intended for description of conceptual models of data (concepts and connections between them) in the graphic format for more obviousness. Data structure diagram includes entities description, connections between them and obligatory conditions and requirements which connect them. Create Data structure diagram with ConceptDraw DIAGRAM.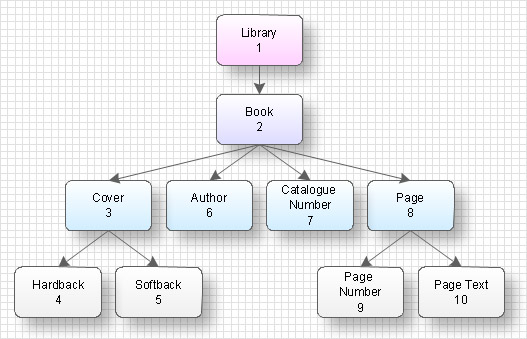
Picture: Data structure diagram with ConceptDraw DIAGRAM
Diagramming is an astonishing way to visualize business processes. The list of the most common business process flowchart symbols is quite long starting from basic flowcharts, continuing with SIPOC diagrams. Business process modeling was never easier than now, with special ConceptDraw Business Process Mapping solution.
To carry out all professional standard requirements for business processes mapping, it is necessarily to follow the special graphical notations. ConceptDraw Business Process Mapping solution offers an exhaustive suite of tools to aid business process mapping. There are three vector libraries SIPOC Diagrams, Business Process Flowcharts, and Swim Lanes that contains totally more than 50 symbols of standard BPM notations. This is all that professionals need to effectively evaluate and manage quality in business processes.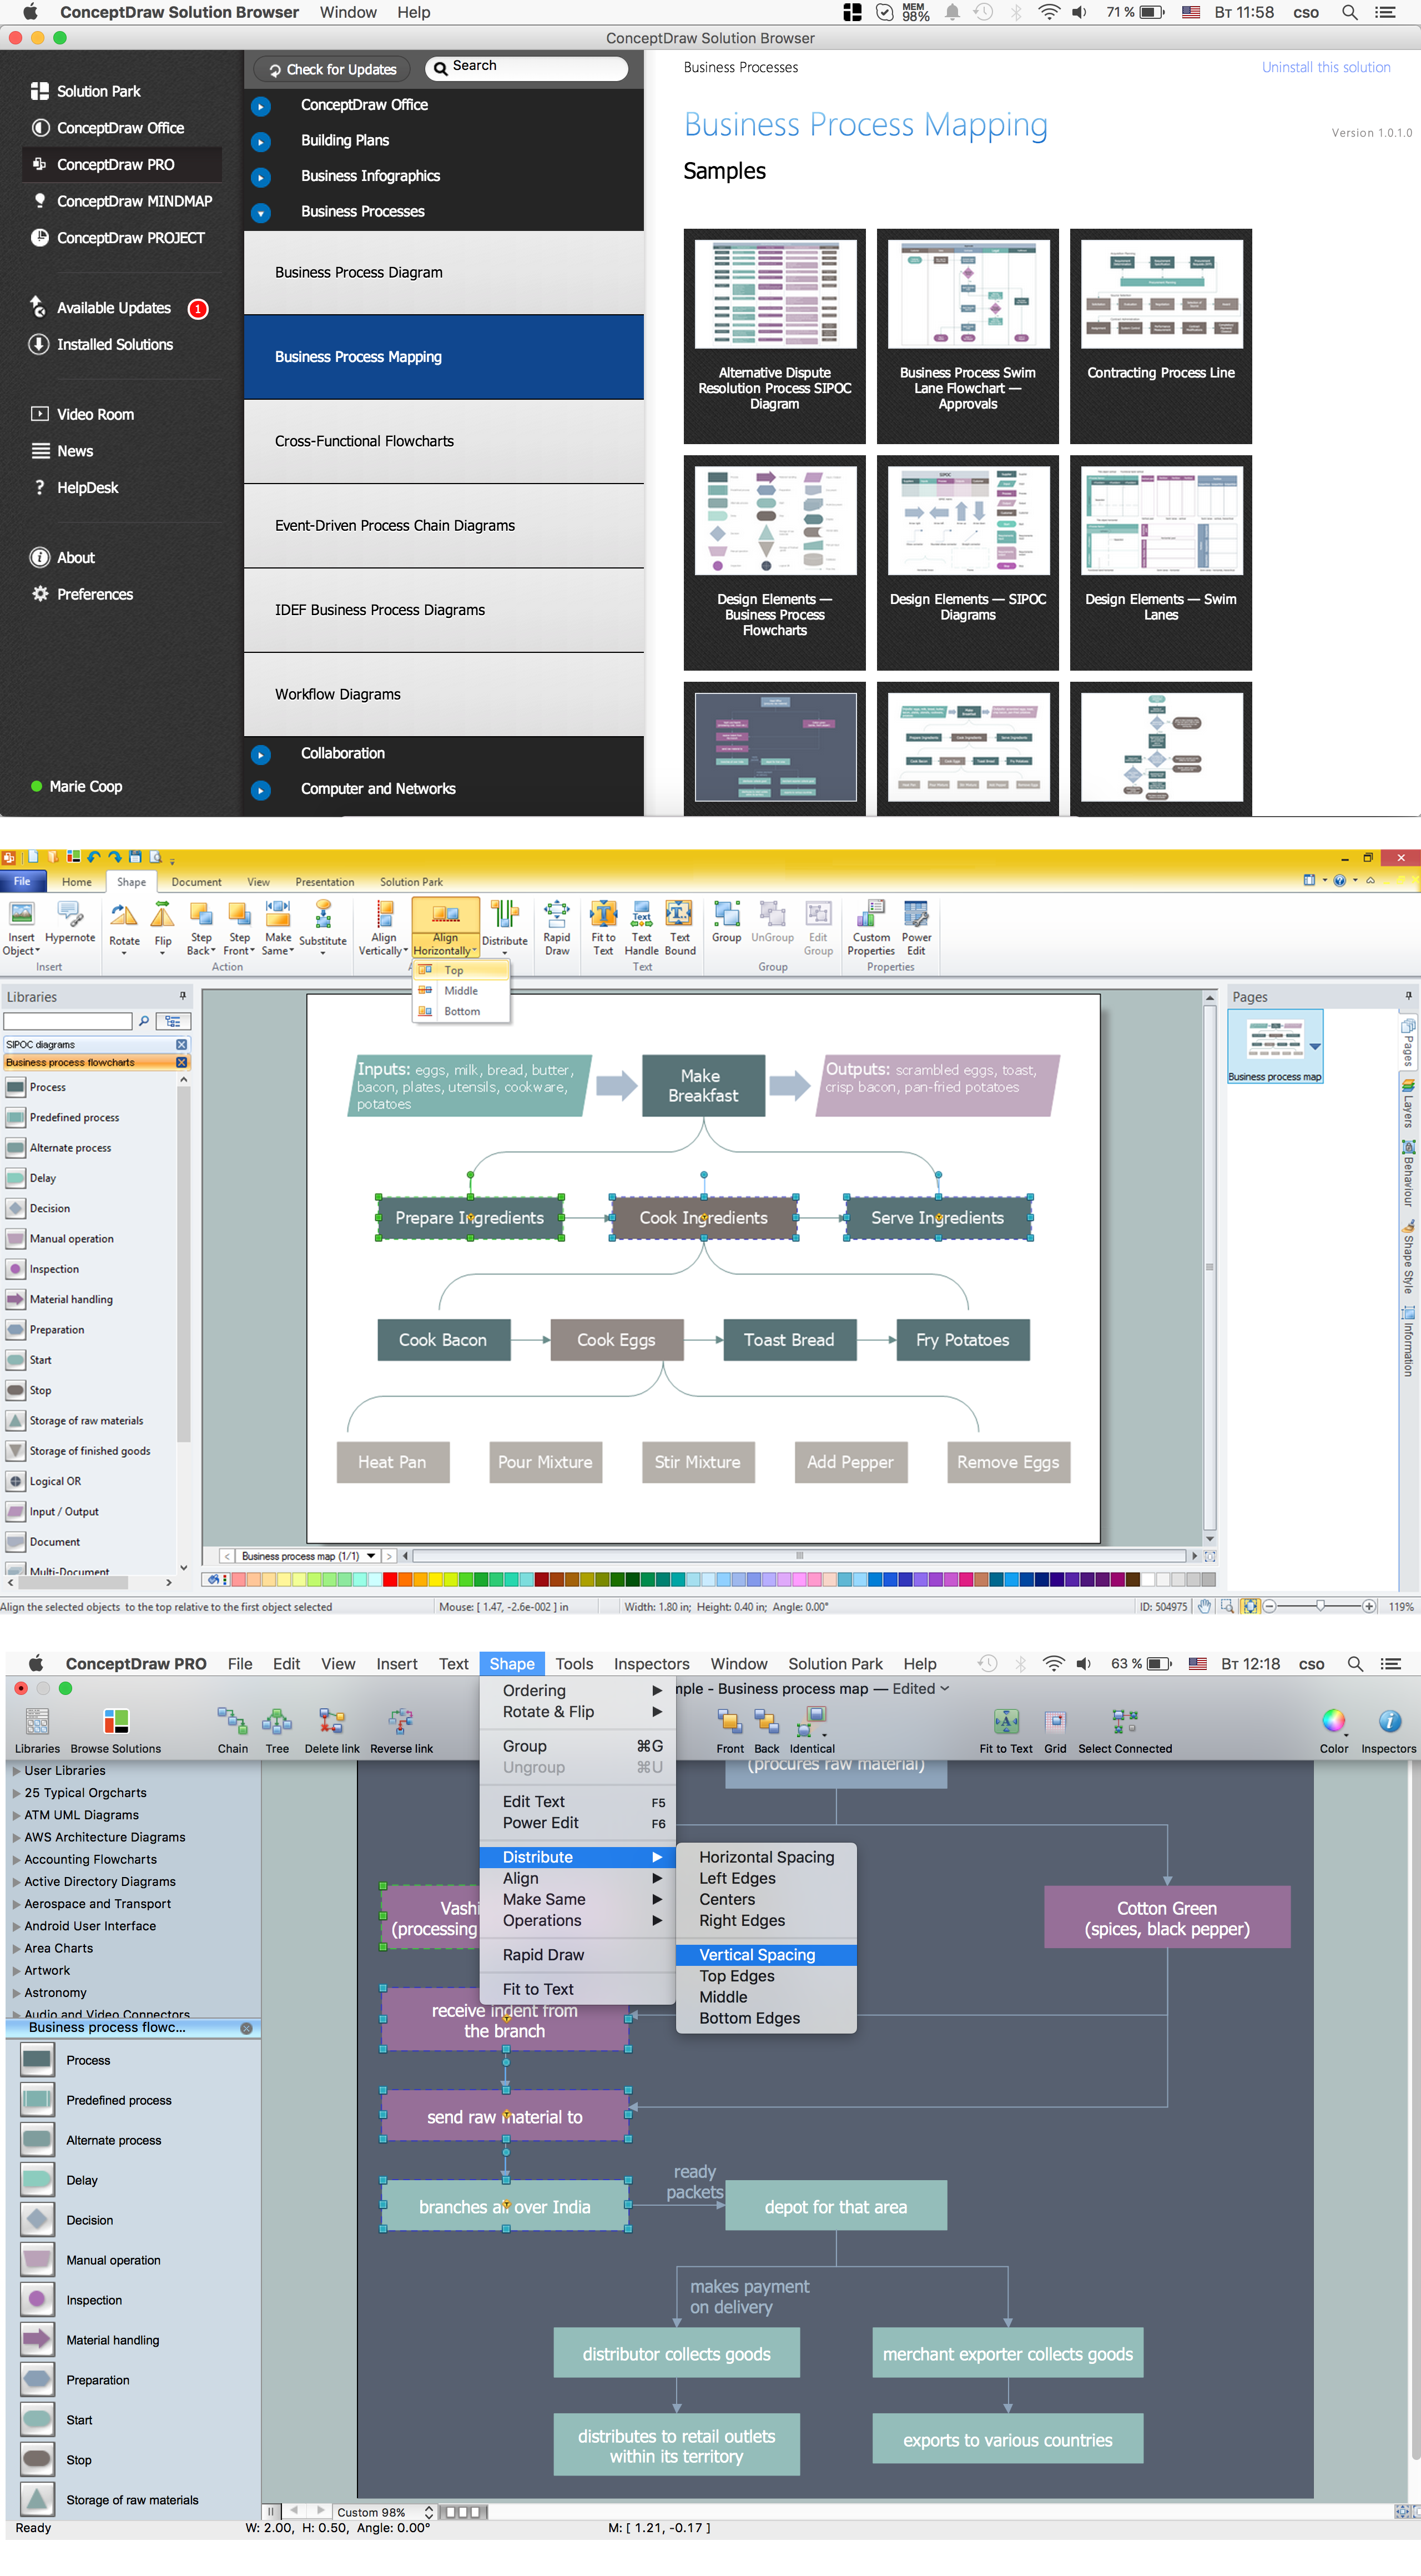
Picture: Business Process Flowchart Symbols
Related Solution:
If you need to describe some process, diagramming is a perfect tool for almost any imaginable purpose. The set of the most commonly used flow charts symbols is quite wide and includes symbols for operations, processes, data inputs and outputs. You can see the full list of all the symbols used for flowcharting in Flowcharts solution from Diagrams area in ConceptDraw Solution Park.
A flow chart is often used for visual representation of a sequential process flow. The flowchart approach to any process is to divide it into some sequential actions. What makes a flow chart so popular and clear to make out is the set of standard flowchart symbols that has the same reading independently from processes described with their applying. The current drawing represents the vector library containing the pack of standard flowchart symbols. This library is supplied with ConceptDraw Flowcharts solution.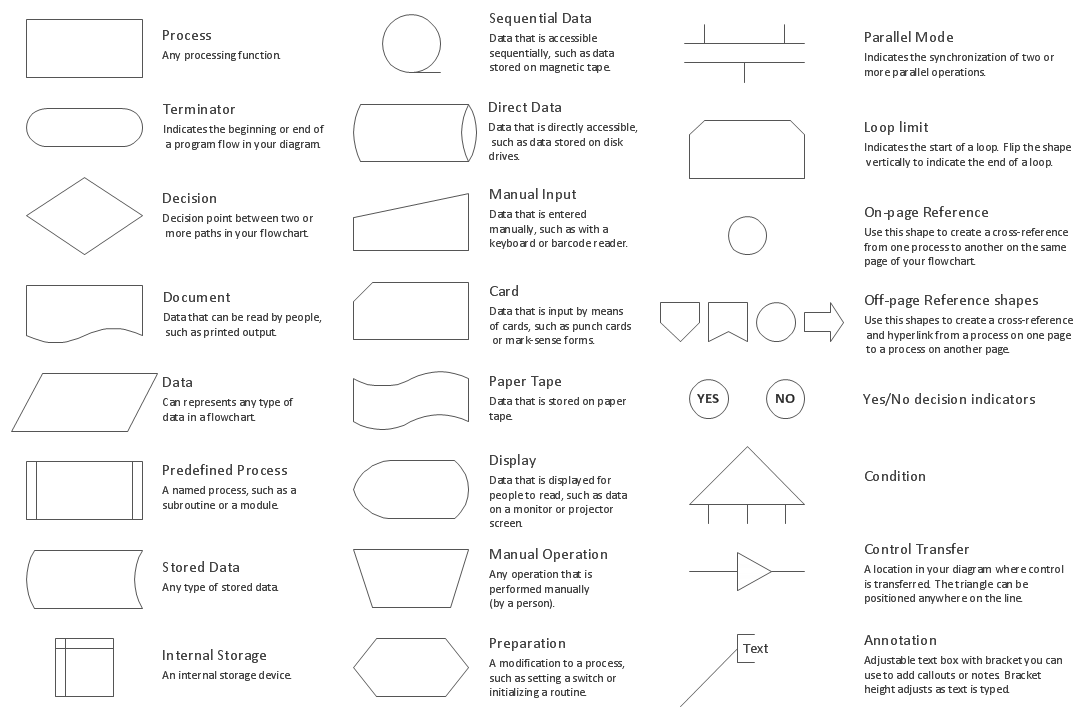
Picture: Flow Chart Symbols
Related Solution:
A flowchart is a simple but very functional tool when it comes to understanding a workflow or to removing unnecessary stages from a process. When drawing flowcharts, keep in mind that there are four common types of flowcharts, like document flowcharts and data flowcharts that show control over a data or document flow over a system. To show controls on a physical level, use system flowcharts. In addition, to show controls in a program, you can draw a program flowchart.
This flowchart diagram represents the piece of an article editing process, that involves the author and editor. It was created using the Basic Flowchart notation that consists from the basic flowchart symbols. The start and the end of the process are indicated with "Terminator" symbols. The "Process" symbols show the action steps consisting from making edits and searching for a compromise, when the author does not agree with the suggestions of the editor. The "Process" symbol is the general symbol in process flowcharts. The "Decision" symbol indicates a branching in the process flow. There are two branches indicated by a Decision shape in the current flowchart (Yes/No, Disagree/Agree). This basic flowchart can be used as a repeating unit in the workflow diagram describing the working process of some editorial office.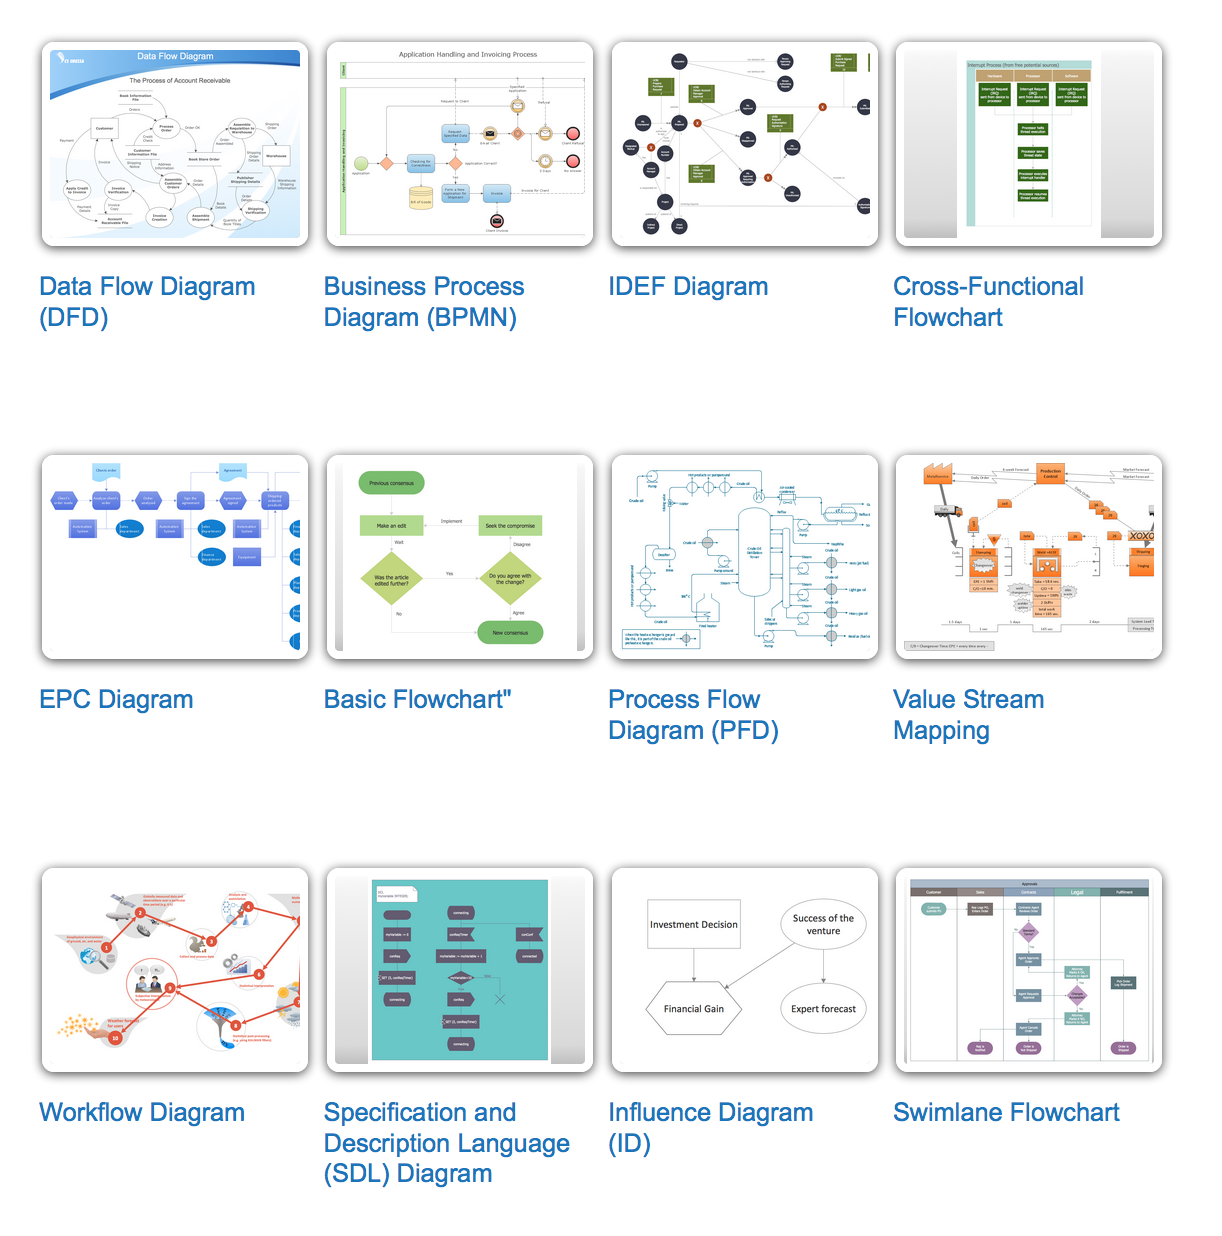
Picture: Types of Flowcharts
Related Solution:
Use ConceptDraw DIAGRAM diagramming and business graphics software to draw your own flowcharts of computer algorithms.
Picture: Process Flow app for macOS
Related Solution:
The ConceptDraw Flowchart component includes a set of samples and templates. This geathered as flowchart maker toolbox which focused on drawing flowcharts of any industry standards.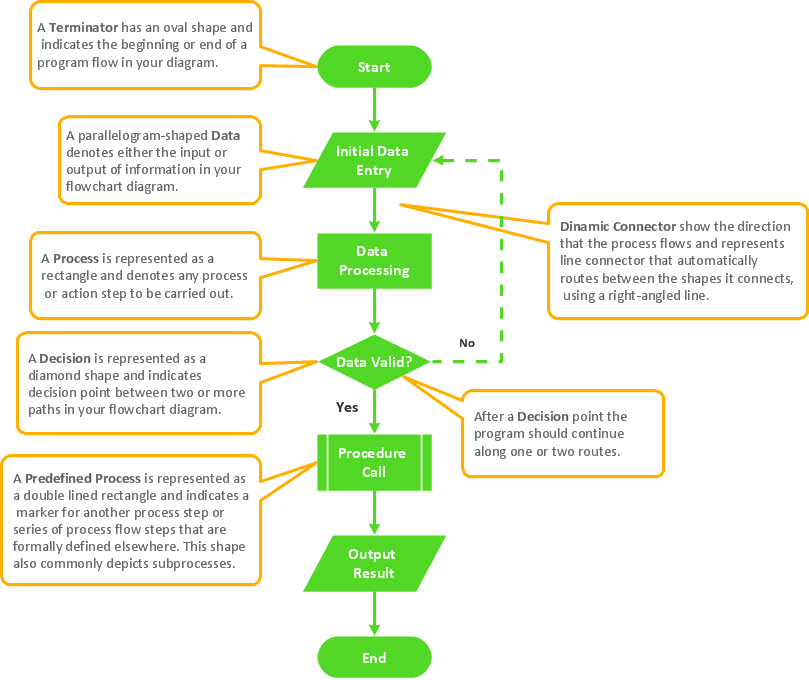
Picture: Flowchart Components
Related Solution:
Data flow diagrams are the graphical tool, used in the visualization of data flow of some data processing systems. It is the valuable process modeling tool. Also designing DFD is the important component of the initial part of any information system development project. The standard symbols are used to represent the interaction of a system components and how various kinds of components influence on data flow. The ConceptDraw Data Flow Diagrams solution is design to assist professional software engineers in making DFDs according to Gane and Sarson, and Yourdon and Coad notations.
Do you imagine yourself as a successful IT specialist? To your mind, they all use data flow diagram examples to learn and to get inspired. Aren’t you still with us?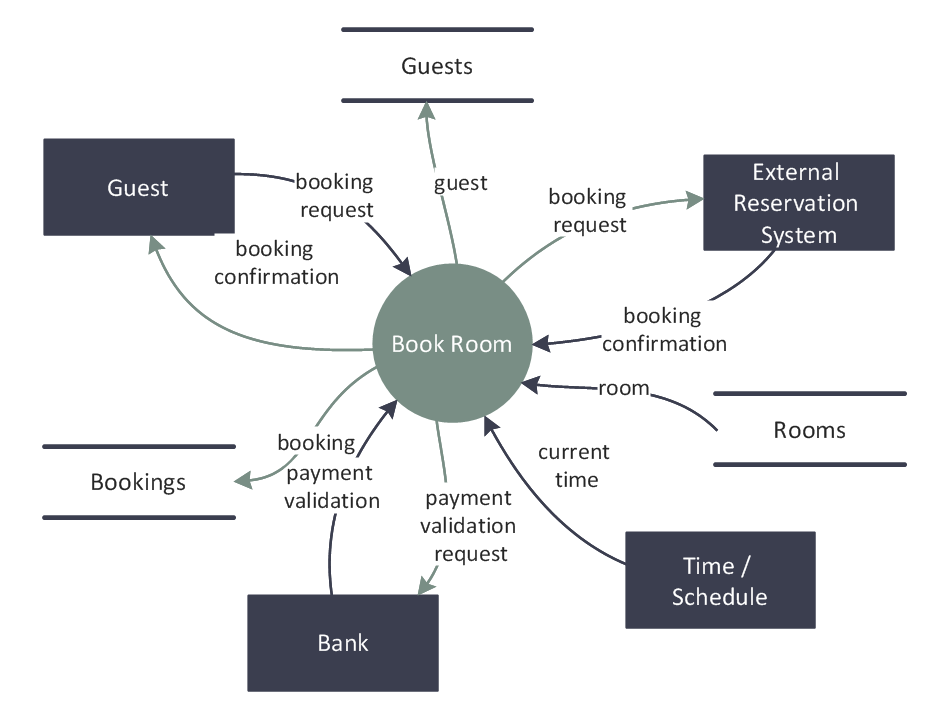
Picture: Data Flow Diagram Examples
Related Solution:
ConceptDraw DIAGRAM is a world-class diagramming platform that lets you display, communicate, and present dynamically. It′s powerful enough to draw everything from basic flowcharts to complex engineering schematics.
Video tutorials on ConceptDraw products. Try it today!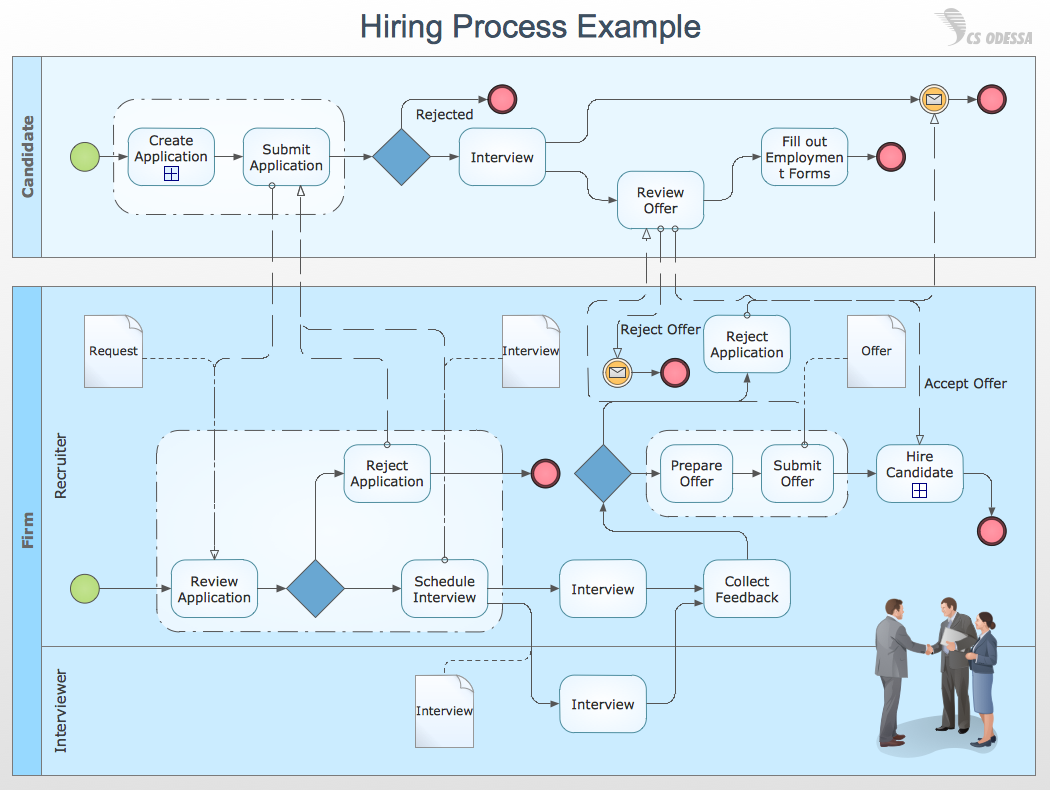
Picture: Business Process Mapping — How to Map a Work Process
Related Solutions:
Event-Driven Process Chain Diagrams for improvement throughout an organisation.
ConceptDraw DIAGRAM - software that reduces the time needed to create a business process model.
Picture: Graphical Symbols to use in EPC diagrams
Related Solution: