Ice Hockey Diagram — Entering Offensive Zone Drill
Playing ice-hockey you can always make any needed plan of the ice hockey field mentioning the positions of the players for planning the next game and so to be able to discuss the fails of the previous ones.
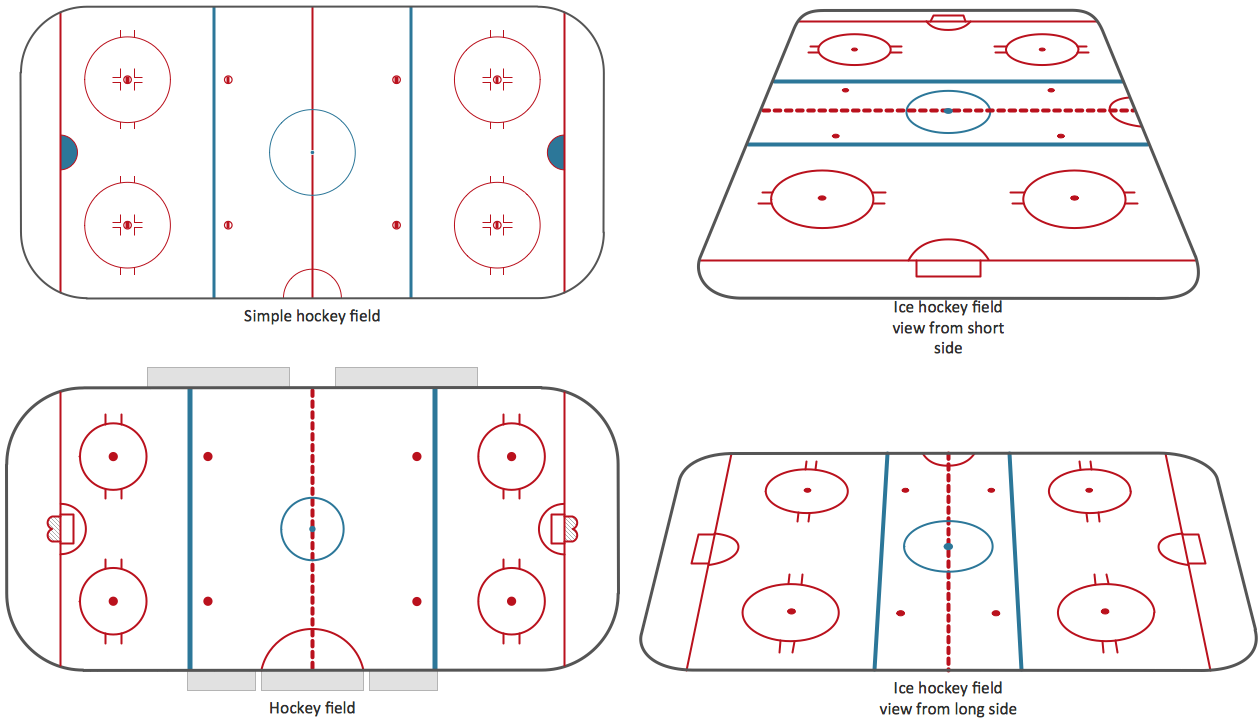
There are three zones within the ice hockey rink, such as those divided by the blue lines. There is a central zone, known to be called the “neutral one” or “centre ice”. The common term for the outer zones is for them to be called the “end zones”, being more commonly referred to by terms, which are relative to each of the team. The end zone is the one in which an ice hockey team is trying to score – it is the attacking zone. Sometimes the attacking zone is also called as the “offensive zone”. The end zone, in which each team's goal net is located, is called the defending zone. Sometimes the defending zone is also known to be called as the “defensive zone”.
The blue line is always considered to be a part of the zone where the puck is in. Although, in case the puck is in the neutral zone, then the blue line is a part of the neutral zone. The puck is known to be completely crossing the blue line to be considered in the end zone. And straight after the puck is in the end zone, the blue line becomes a part of that end zone, but only if that puck completely crosses the blue line in the other direction, then it is considered to be in the neutral zone again.
There are lots of different tactics of how to an play ice-hockey game, such as a defensive play called “forecheck”, which is made in the offensive zone with the goal of applying the pressure to the opposing team for regaining the control of the puck itself. The process of forechecking is usually executed in one of these three situations: 1) it can be a recovery of the puck after a so-called “dump in”, 2) a recovery of the puck after the rebound on a scoring attempt, 3) a recovery of the puck immediately after a turnover for regaining the possession. Forechecking can be either conservative or aggressive, depending on the coaching style. It always also depends on the skating skills of the players. The aggressive forechecking strategies are more often used by the ice hockey players who have good skating mobility. At the same time the conservative plays such as the “neutral zone trap” are always better to use for such ice hockey players who have not as much agility.
Another play is known to be called as the “2-1-2 forecheck”. The mentioned ice hockey forechecking strategy uses the two forwards deep in the offensive zone, with the remaining forward positioned high in the offensive zone. There are two defencemen positioned at the highest part of the mentioned zone near the blue line, so this forecheck can be used to apply both physical and mental pressure on the opposing team. The needed skills are necessary for trying to move the puck out of their defensive zone with a goal of forcing a turnover keeping in mind. The positioning of the ice hockey players removes options for moving the puck all along the boards, resulting into forcing the play to the middle.
There are five skaters, each of which has a specific role in the execution of the mentioned “2-1-2 forecheck”: the first forward has to enter the zone with speed, making contact with the puck carrier. In case the defenceman has the puck in the open ice F1 or in the corner, he must check the player and so to try to separate the puck from the defenceman. Straight after the puck is separated from the defencemen, then it is up to the second forward to get the puck. The second forward is expected to read the situation and so to react in a proper way. In case first forward is giving chase to the defenceman, then second forward must get into the passing lanes of the defenceman until the first forward can make a so-called body-check on the defenceman in order to separate the puck. But once the puck is separated, then the second forward has to skate the sooner the better in order to retrieve the puck.
The third forward is the third man which can be found in the zone, staying higher in it, being ready for a pass from the second forward. Both first and second forwards are deep into the zone, being the first "2" in the “2-1-2 forecheck” combination. The third forward, though, is the "1" as he is alone located in the high part of the mentioned zone. F3 is expected to stay on the side of the puck, known as the strong side, being positioned as well as being ready for a pass from the second forward.
The fourth skater which can be found in the offensive zone is known to be called a defenceman, who is high in the zone only in case the possession of the puck is not lost. In case it happens, then it is defenceman's responsibility to skate hard towards the puck and so to get it back to the first forward or to the second forward. The described situation is known to be called as the process of "pinching the wide rim."
The last, the fifth skater in the zone is the one remaining the defenceman. He also is known to be staying high in the zone, supporting the side without the puck. The mentioned without the puck is known to be called as the “weak side”. Thus, in case the puck is sent to the other side, then the ice hockey player who is known to be remaining the defenceman can pinch the rim in order to get it back to the first forwarder or to the second forwarder. Later, the defenceman can cover the high point of the weak side and both him and who remains him become the second "2" in the “2-1-2 forecheck” situation. The mentioned system of forechecking expects the skaters to be good enough to succeed.
A combination of the "Ice Hockey Rinks" and "Ice Hockey Positions" libraries gives you an ability to create a ice-hockey-related drawing in seconds. Follow next steps to create you own ice hockey schema:
- From the "Ice Hockey Rinks" library drop a rink object to your document
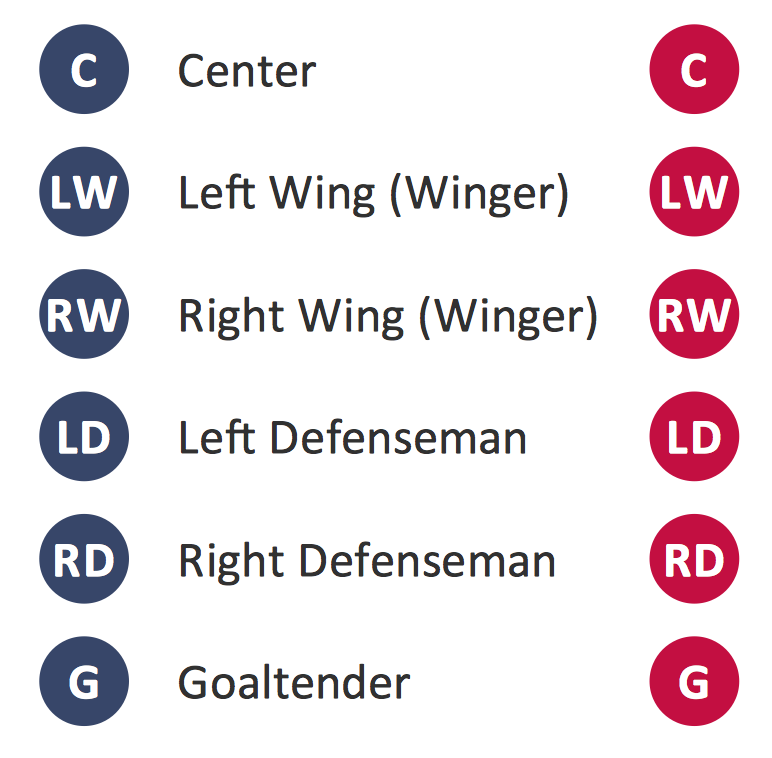
- From the "Ice Hockey Positions" library drop all positions object you need to your document
- Place positions on the rink according to your drawing idea
- Add arrows or text labels if needed.

Sample 1. Ice Hockey Diagram — Entering Offensive Zone Drill
As it was already mentioned, you can always represent the described positions of the ice hockey players as well as the zones, used in the game of ice hockey in a way of making a great looking drawing, mentioning both the players and so their positions within the ice hockey rink as long as you have ConceptDraw DIAGRAM drawing software. Thus, any ice hockey related drawings can be always simply made within only a few minutes using all the needed tools, such as design elements and the pre-made templates of such sport filed plans to edit.