Made with
ConceptDraw
DIAGRAM 18

IDEF0 Flowchart Symbols

IDEF (Integration Definition for Function Modeling) relates to the family of modeling languages in the field of systems and software engineering. IDEF covers a wide range of uses, from the functional modeling to the object-oriented analysis and design. There are many types of IDEF diagrams and methods, two among them are used as the base for business process models - IDEF0 and IDEF3.

The IDEF0 method is built on the functional modeling language Structured Analysis and Design Technique (SADT) and focuses on activity modeling. The modeling of the entire business and its processes is always difficult process, because even for small-size businesses the business processes are complex. The IDEF0 method facilitates the modeling of the business as a complex system and makes it simple for understanding.

The IDEF0 Diagrams are succesfully used for documenting the business, for analysis, development, reengineering, integration of information and software systems. The IDEF0 notation is based on the Air Force Wright Aeronautical Laboratories Integrated Computer-Aided Manufacturing (ICAM) Architecture and was standardized in 1993 by the National Institute of Standards and Technology.

The ability to create the IDEF0 flowcharts and business diagrams rapidly and without efforts is made possible thanks to wide range of intuitive tools of ConceptDraw DIAGRAM software and IDFE0 notation supplied by IDEF0 Diagrams solution from the Software Development area. This solution is rich for the ready-to-use specific IDEF0 flowchart symbols grouped in IDEF0 Diagram library.

IDEF0 Flowchart Symbols Library

Example 1. IDEF0 Diagram Library

The IDEF0 Diagram library contains 18 IDEF0 flowchart symbols. All they are vector, so you can resize them without loss of quality, change their color to make your flowcharts and diagrams more attractive.

IDEF0 Flowchart Symbols

Example 2. IDEF0 Flowchart Symbols

Note that one more set of IDEF0 flowchart symbols is also offered by IDEF0 library from the IDEF Business Process Diagrams solution from the Business Processes area of ConceptDraw Solution Park. You can combine the objects from both these libraries at your diagram, if required.

IDEF0 Library Design Elements

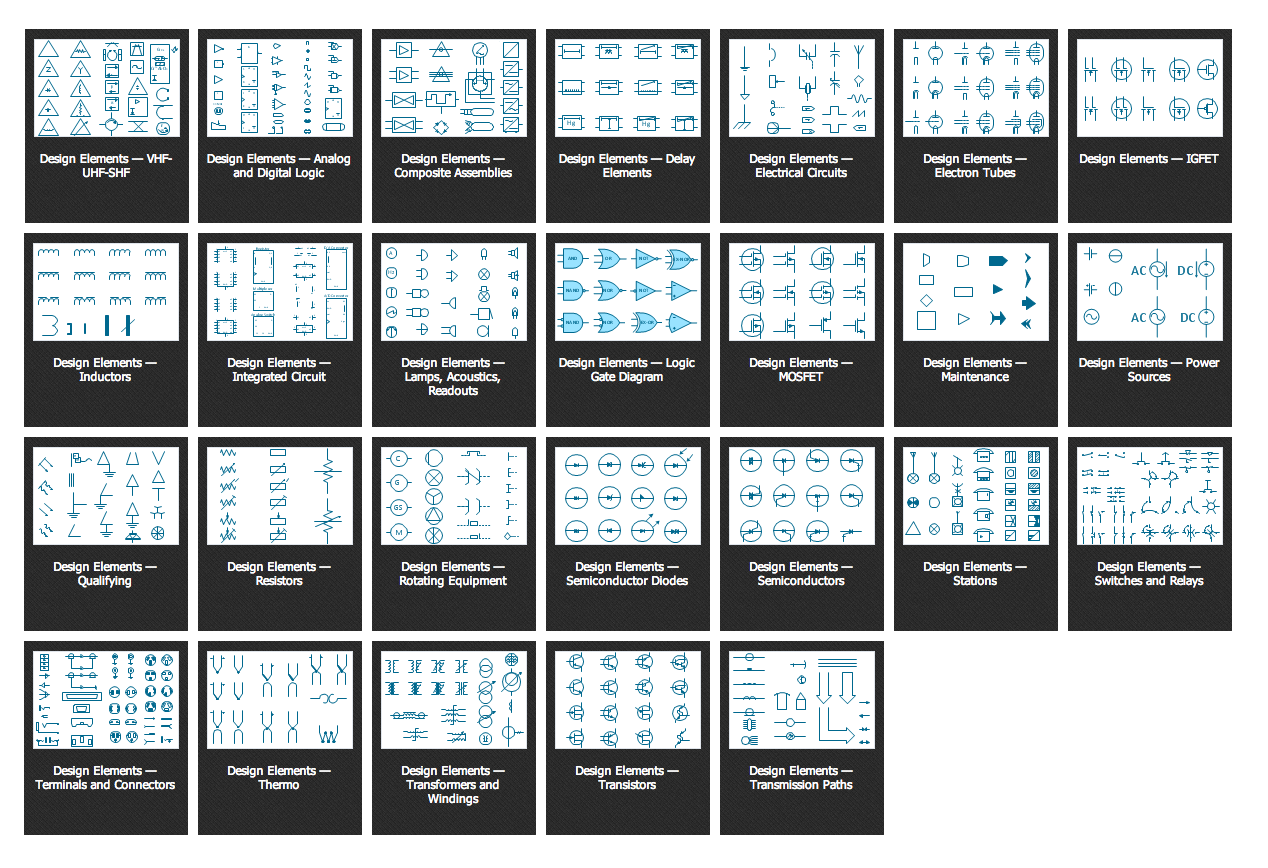
Example 3. IDEF0 Library Design Elements

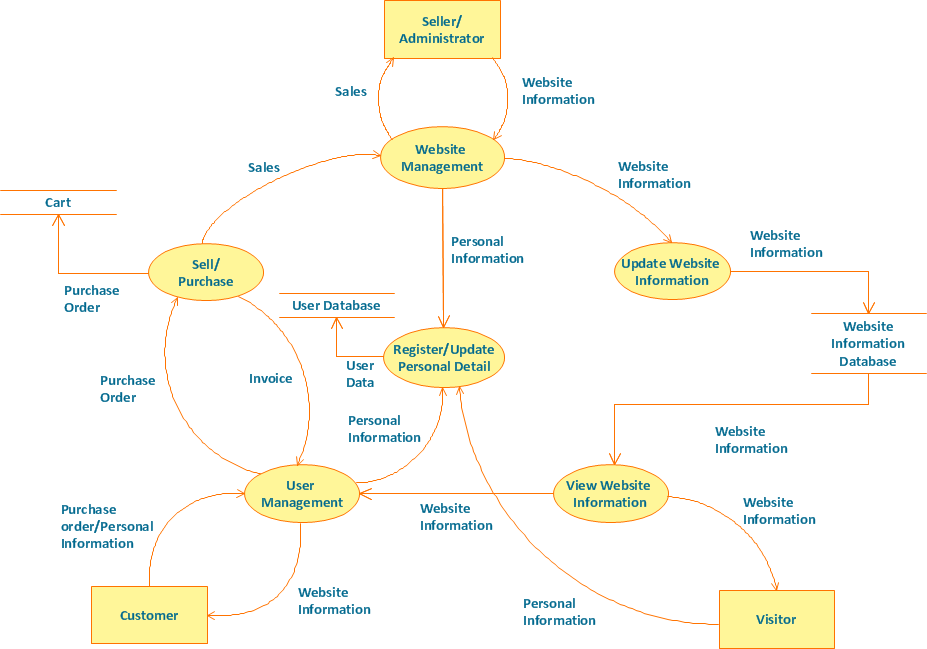
The flowcharts and diagrams are the major components of IDEF0 models and are used to model the decisions, actions, and activities of an organization or other system. An IDEF0 model is made up of several diagrams, each diagram describes in more detail a box from a more general diagram.

Follow the next few steps to create the IDEF0 diagram:

  1. You can start design with Diagram Box element from the IDEF0 Diagram library.

    Adding the Diagram Box

    Example 4. Adding the Diagram Box

  2. Then add the boxes that represent functions such as activities, actions, processes or operations by dragging them from the library into the Diagram Box. Arrange the boxes and resize the Diagram Box, if needed.

    Adding the Boxes at IDEF0 Diagram

    Example 5. Adding the Boxes at IDEF0 Diagram

  3. To make changes to IDEF0 objects, use the Action button menu at the object's right top corner.

    IDEF0 Object's Action Menu

    Example 6. IDEF0 Object's Action Menu

  4. The data and objects which interrelate with the functions are represented by arrows, connect the IDEF0 elements with arrow connectors. Add the text and make color changes.

    IDEF0 Diagram - Application Development

    Example 7. IDEF0 Diagram — Application Development

The IDEF0 Diagrams solution offers also large quantity of predesigned templates and samples that are available from ConceptDraw Solution Park. Use any of them to create your own IDEF0 Diagram on its base.

IDEF0 Flowchart Symbols

Example 5. IDEF0 Diagrams Solution

The ConceptDraw DIAGRAM software allows you create the IDEF0 digrams and flowcharts of complex processes more easily by providing variety of drawing tools, connector tools, samples, templates and drag-and-drop IDEF0 flowchart symbols contained in IDEF0 Diagrams library from the IDEF0 Diagrams solution of Software Development area and IDEF0 library from the IDEF Business Process Diagrams solution of Business Processes area.

Export IDEF0 Diagram to PDF, PPT, Vision

Example 5. Export IDEF0 Diagram to PDF, PPT, Visio.

Any IDEF0 Diagram designed in ConceptDraw DIAGRAM software can be then easy printed, exported to various formats, including PPT, PDF, MS Visio, HTML, and many other graphic formats.


NINE RELATED HOW TO's:
Structured-systems analysis and design method uses data flow diagrams to represent the process of data flowing through a system. Talking about this might be useless without a proper example of DFD for online store (Data Flow Diagram). This DFD example shows all the distinctness that a diagram can bring into a scattered data structure. Data flow diagrams are used to show how data is processed within some business processes. Making DFD is a common practice for business process modeling and analysis. This diagram represents the online store business flow. It describes inputs and outputs within online selling process and depicts the interactions between its participants. This DF diagram can be used by system analysts to create an overview of a business, to study and discover its inherent strengths and weak points.Example of DFD for Online Store
Picture: Example of DFD for Online Store (Data Flow Diagram)
Related Solution:
Baseball diagram is the simplest way to explain Baseball details. ConceptDraw DIAGRAM software extended with the Baseball solution is an amazing tool for producing and presenting baseball diagrams.Baseball Diagram – Fielding Drill – Hit the Cutoff
Picture: Baseball Diagram – Fielding Drill – Hit the Cutoff
Related Solution:
ConceptDraw DIAGRAM diagramming and vector drawing software offers the Timeline Diagrams solution from the Management area which is rich for the timeline examples, samples, templates and ready-to-use vector shapes.Timeline Examples *
Picture: Timeline Examples
Related Solution:
A Flow Map is a type of thinking maps, which help organize and understand information easily. Use ConceptDraw DIAGRAM software to ✔️ create a Flow Map of any degree of complexity in a few minutes, ✔️ display the interrelated information, ✔️ structure information sequentially or chronologically, ✔️ represent manufacturing or engineering processesFlow Map
Picture: Flow Map: A Step-by-Step Guide
Related Solution:
ConceptDraw DIAGRAM diagramming and vector drawing software enhanced with Electrical Engineering Solution from the Industrial Engineering Area of ConceptDraw Solution Park offers you powerful tools and libraries with incredibly large quantity of predesigned electrical symbols as electrical schematic symbols for easy designing professional looking Electrical Schematics.Electrical Symbols, Electrical Schematic Symbols *
Picture: Electrical Symbols, Electrical Schematic Symbols
Related Solution:
Processing Flow Chart is a simplified sketch used in chemical and process engineering to illustrate general plant streams, major equipment, and key control loops. ConceptDraw DIAGRAM enhanced with Flowcharts Solution is ideal software for designing ✔️ Processing Flow Charts, ✔️ Process Flow Charts, ✔️ Flow Chart Process MapsProcessing Flow Chart in ConceptDraw DIAGRAM Software
Picture: Processing Flow Chart
Related Solution:
ERD drawing becomes easier with predesigned entity relationship symbols, work flow shapes, entity relationship stencils. All variety of ERD symbols you may need for ERDs design is packed into libraries and templates from Entity-Relationship Diagram (ERD) Solution for ConceptDraw DIAGRAM diagramming and vector drawing software. But anyone have an ERD symbols quick reference? Detailed reference information for them is represented at the tables.Anyone Have an ERD Symbols Quick Reference? *
Picture: Anyone Have an ERD Symbols Quick Reference?
Related Solution:
In electronics, a logic gate is an idealized or physical device implementing a Boolean function; that is, it performs a logical operation on one or more logical inputs, and produces a single logical output. Depending on the context, the term may refer to an ideal logic gate, one that has for instance zero rise time and unlimited fan-out, or it may refer to a non-ideal physical device 26 libraries of the Electrical Engineering Solution of ConceptDraw DIAGRAM make your electrical diagramming simple, efficient, and effective. You can simply and quickly drop the ready-to-use objects from libraries into your document to create the electrical diagram.Electrical Symbols — Logic Gate Diagram *
Picture: Electrical Symbols — Logic Gate Diagram
Related Solution:
ConceptDraw DIAGRAM is ideal for software designers and software developers who need to draw Booch OOD Diagrams.Booch OOD Diagram
Picture: Booch OOD Diagram
ConceptDraw
DIAGRAM 18