Made with
ConceptDraw
DIAGRAM 18

IDEF3 Standard

In contrast to IDEF0 standard, IDEF3 standard is more particularly specialized. This standard is intended for description and further analysis of technological processes of an enterprise. Using IDEF3 standard it is possible to examine and model scenarios of technological processes. Scenario is a description of consecution of properties changes of an object which takes part in the technological process, e.g. half-finished product which is under processing. Each scenario is documented correspondingly. For documenting of the scenario there are two types of documents: documents, which describe properties and consecution of the process execution (standards, methods and technologies description) and documents, which describe results of the process execution (reports and work statistics). IDEF3 standard allows to get information about process and attendant documentation and to analyze it for increasing of the process management effectiveness. Using IDEF3 standard you can collect and document information about processes key points, define the degree of influence on the course of processes execution and model scenarios without change of the production process itself.

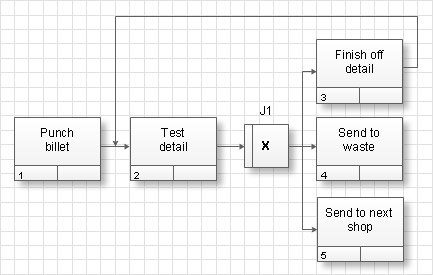
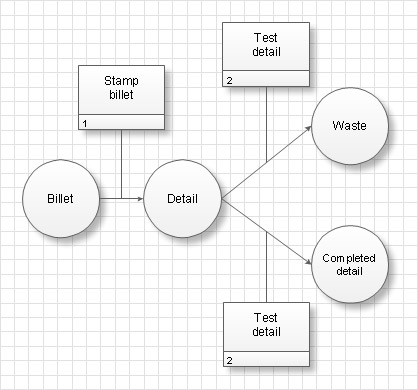
There are two types of diagrams in IDEF3 standard. These diagrams describe the same technological process from different sides. First type of diagram is Process Flow Description Diagrams (PFDD). The second type - Object State Transition Network (OSTN) diagrams.

For instance if it is necessary to describe the process of stamping the detail from a billet, the PFDD diagram will contain a description of consecution of actions which are executed with the billet during the given process, and the OSTN diagram will contain the detail states on each process stage.

Rectangular blocks on the diagram are called functional units or Units of Behavior (UOB). Each UOB has the name in the verb form and a unique number and denotes an event within the limits of the process (a stage, an action or decision making). UOB are connected by arrows in consecution of the process execution. There are 3 different kinds of arrows: Precedence arrow - a solid line, which is drawn from left to right or top-down; Relational Link - a dotted line, used for description of relations between UOB; Object Flow - an arrow with two arrow-heads. Such arrow denotes that the object is used in two or more subruns. For example, when the object is created in one subrun and is used in another one.

The block marked with the cross on the diagram is called a Junction. Such blocks are used for indication of decision makings during the process. Accordingly to IDEF3 standard there are two types of Junctions: for confluence (Fan-in Junction) and branching (Fan-out Junction) of arrows. Simultaneous junction and branching is not allowed. Junctions can be of different types. The junction type is denoted on the diagram.

Indication Name Fan-in Junction Fan-out Junction
Asynchronous AND Asynchronous AND All preceding subruns must be completed All subsequent subruns must be started
Synchronous AND Synchronous AND All preceding subruns must be completed simultaneously All subsequent subruns must be started simultaneously
Asynchronous OR Asynchronous OR One or several preceding subruns must be completed One or several subsequent subruns must be started
Synchronous OR Synchronous OR One or several preceding subruns must be completed simultaneously One or several subsequent subruns must be started simultaneously
Synchronous OR XOR (Exclusive OR) Only one preceding process must be completed Only one subsequent process must be started

All junctions in PFDD are numerated, each number has prefix "J", e.g. J1, J2 and so on.

Each UOB can be represented in the form of sequence of blocks with the necessary degree of detailed elaboration. For example the block “Testing of a detail” can be represented in the form of sequence of blocks, which in their turn will form PFDD diagram. Such diagram will be called a Child diagram, and the initial diagram – a Parent diagram.

The OSTN diagram represents a list of object state and descriptions of influences which correspond to UOB blocks from the corresponding PFDD diagram. Object states are represented by circumferences and their changes – by directed lines, which are signed the same way as corresponding UOB blocks.

IDEF3 Standard *

TEN RELATED HOW TO's:
ConceptDraw DIAGRAM diagramming and vector drawing software offers the unique Business Process Mapping Solution from the Business Processes Area of ConceptDraw Solution Park. Powerful drawing tools of this solution make it effective Business Process Mapping software and help easy design professional looking business process diagrams and flowcharts.Process Mapping *
Picture: Process Mapping
Related Solution:
Design efficiently the technical flow charts in ConceptDraw DIAGRAM software for various fields and provide ✔️ clarity, ✔️ accuracy, ✔️ usability, ✔️ simple communication, analysis, and improvementTechnical Flow Chart Example Design in ConceptDraw DIAGRAM
Picture: Technical Flow Chart Example
Related Solution:
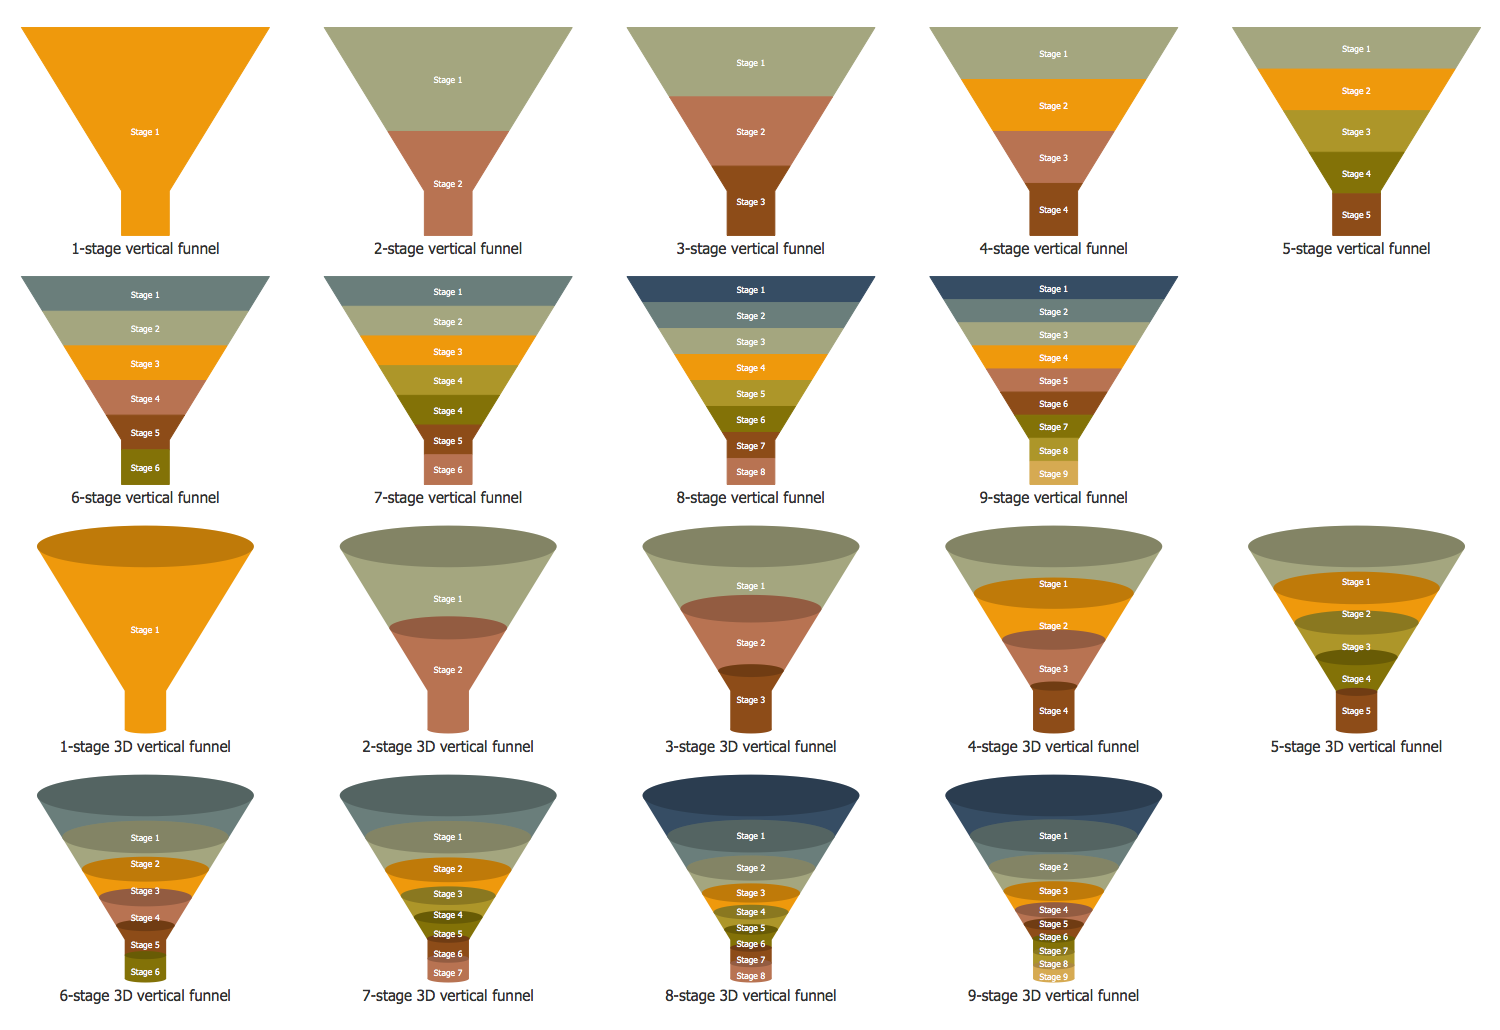
Funnel diagram can be also known as a funnel chart being similar to a stacked percent bar chart. This drawing is a type of chart that can be often used in order to represent the stages in some sales process. It can be also used for showing the amount of potential revenue for each of the described stages. In order to make a funnel diagram, the Funnel Diagrams solution can be used while working in the ConceptDraw DIAGRAM diagramming and drawing software. Having the pre-made design elements as well as the examples of funnel diagrams, the Funnel Diagrams solution allows any ConceptDraw DIAGRAM user to make their own unique as well as professionally-looking drawings.Funnel Diagram *
Picture: Funnel Diagram
ConceptDraw DIAGRAM enhanced with Audio, Video, Media solution is a helpful tool for illustration of a CCTV network. It contains library of vector cliparts of video and TV devices and different digital gadgets for drawing such illustrationsBasic CCTV System Diagram. CCTV Network Diagram Example *
Picture: Basic CCTV System Diagram. CCTV Network Diagram Example
Related Solutions:
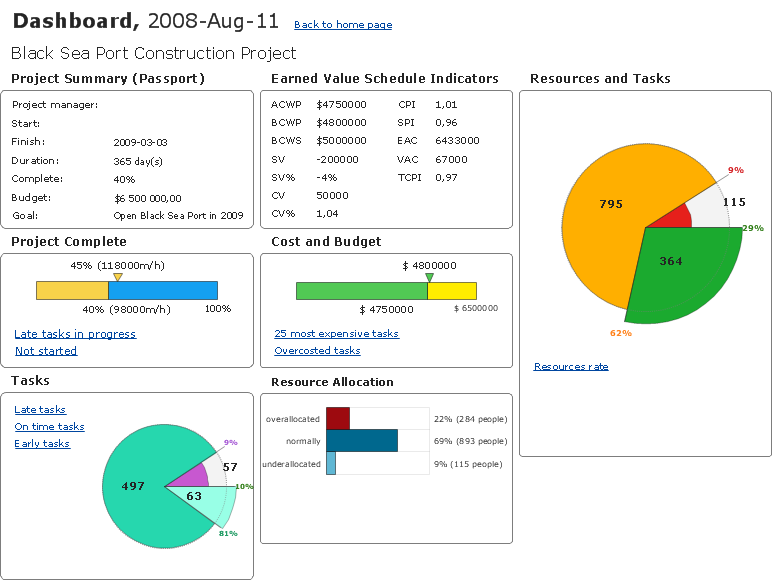
ConceptDraw PROJECT contains an extensive tool set to help project managers. The rich data visualization capability that is provided by ConceptDraw products helps you create project dashboards, one-click reports, multi-project views, Gantt charts, and resource views. Let′s learn how to get maximum value using ConceptDraw PROJECT!How To Create Project Report *
Picture: How To Create Project Report
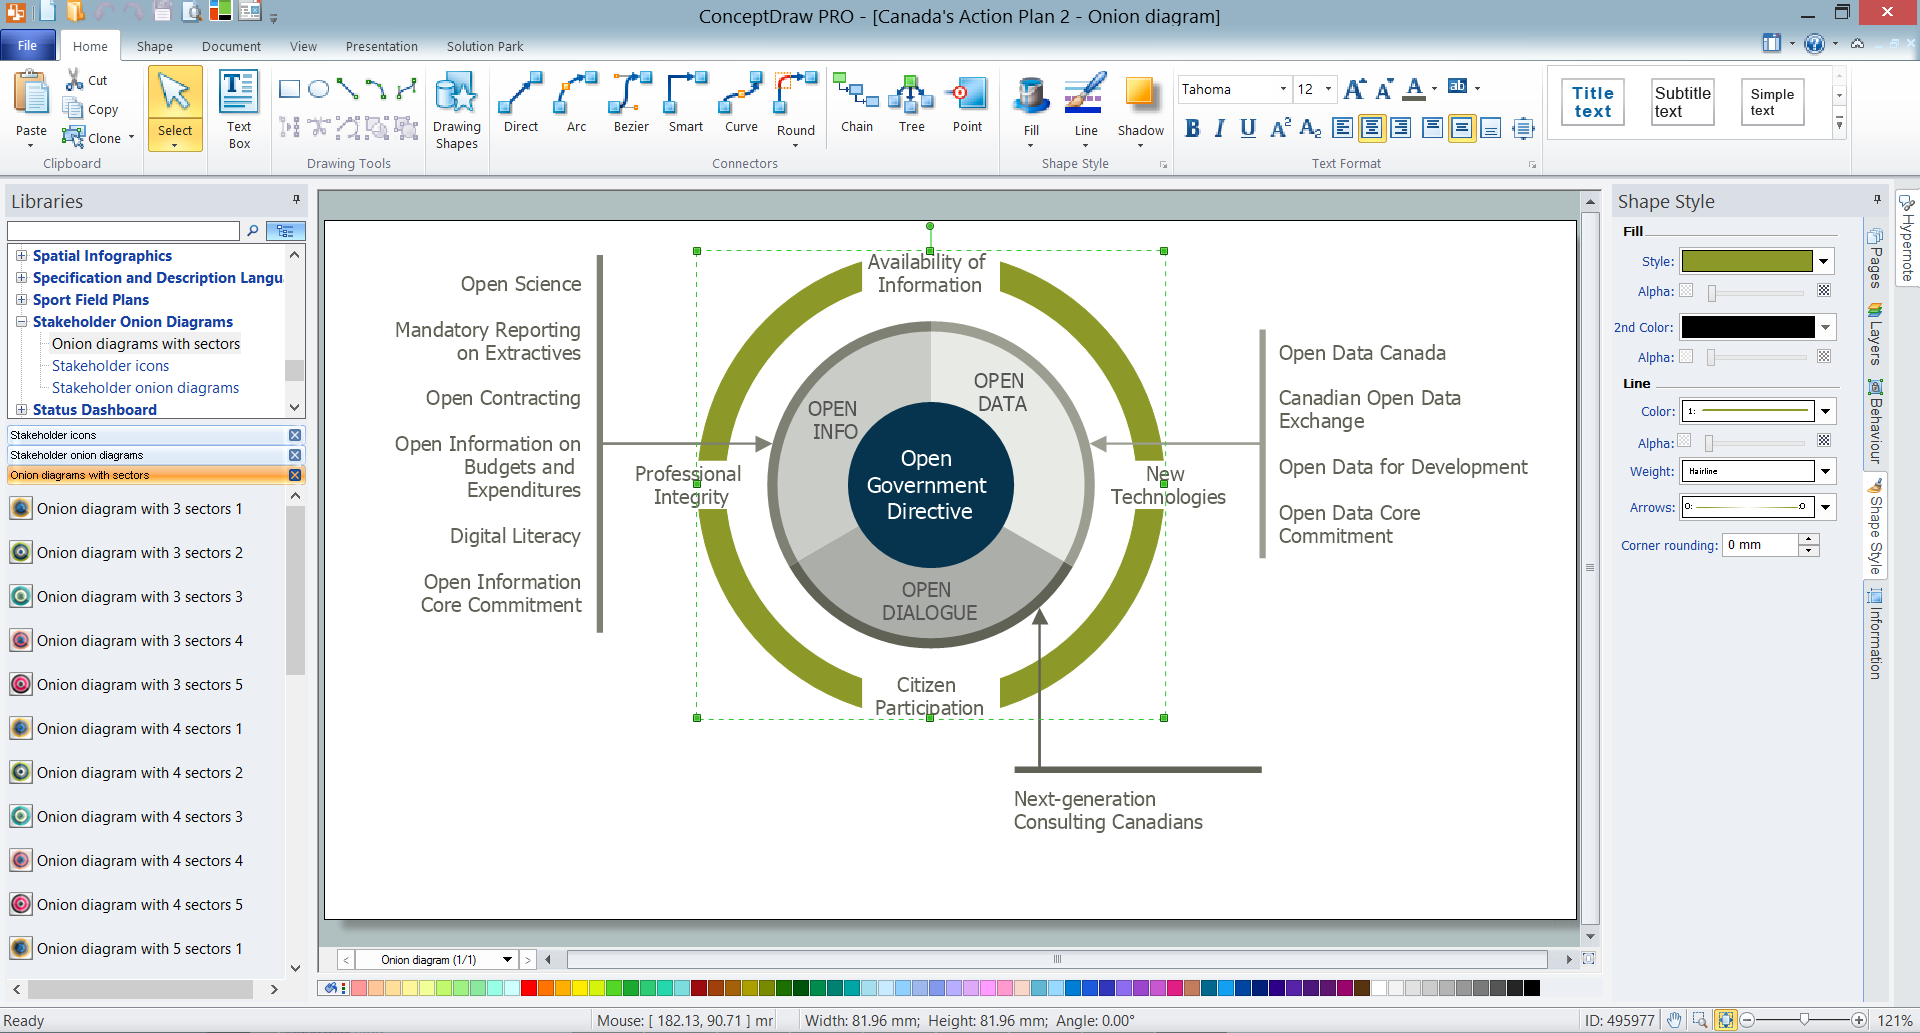
An onion diagram is a kind of chart that shows the dependencies among parts of an organization or process. The chart displays items in concentric circles, where the items in each ring depend on the items in the smaller rings. The Onion Diagram is able to show layers of a complete system in a few circles. But how to create Onion Diagram? Now, it's very easy thanks to the ConceptDraw DIAGRAM diagramming and vector drawing software extended with Stakeholder Onion Diagrams Solution from the Management Area of ConceptDraw Solution Park.How To Create Onion Diagram *
Picture: How To Create Onion Diagram
Related Solution:
At the base of the identity of an organisational is its organizational culture.Pyramid Diagram *
Picture: Pyramid Diagram
Related Solutions:
Home remodeling is something that many people face at one point or the other. The first part of any home remodeling is to create a new home plan. At first, it may seem a daunting and costly endeavor, but to take it on yourself, you just need to choose the right home remodeling software. Digital drawing software, such as ConceptDraw DIAGRAM , includes home plan examples to help you get started, as well as multiple advanced and powerful options, and an intuitive interface to go with them. People who want to make changes in their houses planning have previously prepare a plan of rebuilding, of house, apartment or any other construction. If somebody desires to change anything in the interior design he also requires a plan, as it’s handy to see on the plan the coming result and then begin to implement it. All these tasks will be solved better with ConceptDraw DIAGRAM and its solution for Building Plans. You will design professional looking Home Plans quick and easy using the vector libraries, templates and samples, supplied with Solution.Home Remodeling Software
Picture: Home Remodeling Software. Home Plan Examples
Related Solution:
Using ConceptDraw quality mind maps is a perfect addition to quality visualization in your company.Quality visualization in your company *
Picture: Quality visualization in your company
Related Solution:
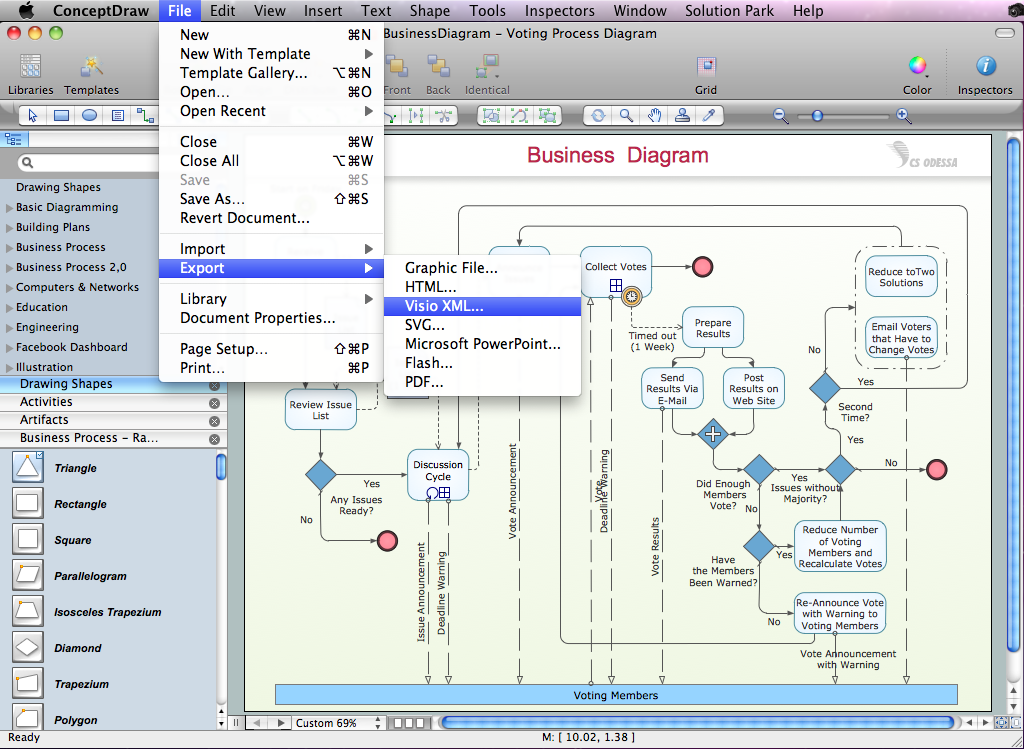
Once you have created your document in ConceptDraw DIAGRAM and you want to share it with your colleagues and friends, who uses MS Visio on their computers, you can easily export your document using ConceptDraw DIAGRAM export to Visio XML files (VDX) feature. Now you can share your ConceptDraw documents with MS Visio users.Export from ConceptDraw DIAGRAM Document to MS Visio® XML *
Picture: Export from ConceptDraw DIAGRAM Document to MS Visio® XML
ConceptDraw
DIAGRAM 18