Identifying Quality Management System
Working in many different fields of business activity, the ConceptDraw DIAGRAM users make any wanted drawings they need, including those involved in the quality management activities.
Working for such sphere of business activity as quality management, people have to ensure that the organization they work for, as well as the product or service they provide, is consistent. To succeed in their job, they try to make sure they work in order to perform in four different components of quality management, such as quality planning, quality control, quality improvement and quality assurance.
Quality management is known to be focused on the means in order to achieve the goal of providing the good quality products and/or services, apart from being focused on the service or/and product quality as it is. Using control of processes and quality assurance as well as products to achieve more consistent quality, the quality management is known to be one of the most popular spheres of the business activity.
The main principle of the quality management is to guide the organization towards the improved performance. The top managers are usually in charge for such activity. Usually the top managers are in charge for achieving such goals as pleasing their customers as customer focus is basically the primary one for such organizations.
Once the customers’ requirements are met and the customers’ expectations are exceeded, then it means that the main objective of the quality management of some particular organization is achieved.
Attracting and retaining the confidence of its customers seems to be the most important thing to succeed in for all the managers within some particular company. If also the other interested parties on whom the achievement depends are pleased, then it is even better. Every single aspect of the customer interaction is expected to be provided by an opportunity of creating more value for those customers.
The understanding of both current as well as future needs of all the customers and the other interested parties is expected to be contributed to the sustained success of any particular organization, mainly – by the leaders of the organization at all levels, who are meant to be establishing the unity of purpose as well as the direction, creating the special conditions for people to become engaged in achieving the company’s quality objectives.
The unity of purpose is as much important as engagement and the direction of the people who enable some organization to align its policies, strategies, resources and processes in order to achieve all its objectives.
Engagement of people is also a very important constituent of any manager's work within any organization. Empowered, engaged and competent people are essential to enhance the company’s capability at all levels throughout the organization in order to deliver the value once it is created.
In order to manage an organization in both an effective as well as an efficient way, it is always important to involve the right people at all levels. It is also very important to respect them all as individuals ensuring their engagement in achieving the organization’s quality objectives in this way. Thus, recognition, empowerment and enhancement of competence can facilitate such things.
Predictable and consistent results are those which are simpler to achieve in more efficient as well as an effective way once the activities are well understood and well managed. Consisting of the interrelated processes, the quality management system is the one used for simplifying the understanding of in what way the results are produced by this mentioned system, enabling an organization to optimize its performance.
All the successful organizations have their main focus on improvement as it is essential for any organization to enable it to maintain the current levels of performance and to react to all the changes in its external and internal conditions, creating the new opportunities.
All the decisions based on the evaluation and the analysis of data as well as information are always more likely to produce the desired results. That is why all the decision-making processes are so complex: they have to be all well planned before they are brought to life.
A quality management system is simply a collection of different business processes which is focused on the achieving one important goal — to meet the customers’ requirements as well as to enhance their satisfaction, being aligned with the organization's strategic direction and its purpose. The described system is the one being expressed as the organizational aspirations, policies, goals, processes, resources and documented information are all needed to be implemented and maintained.
The organizations are expected to be seeking certification or compliance for defining the processes which are known to be forming the quality management system as well as the interaction and the sequence of such processes. There are a few books can be found which provide different “step-by-step” guides for those who seek the quality certifications of their products.
The examples of the described processes include the order processes, the production plans, the product/ service/ process measurements for complying with the specific requirements, such as the measurement systems analysis and the statistical process control, calibrations, internal audits, corrective actions, preventive actions, identification, labelling and control of the so-called “non-conforming products” for preventing its delivery, inadvertent use or processing.

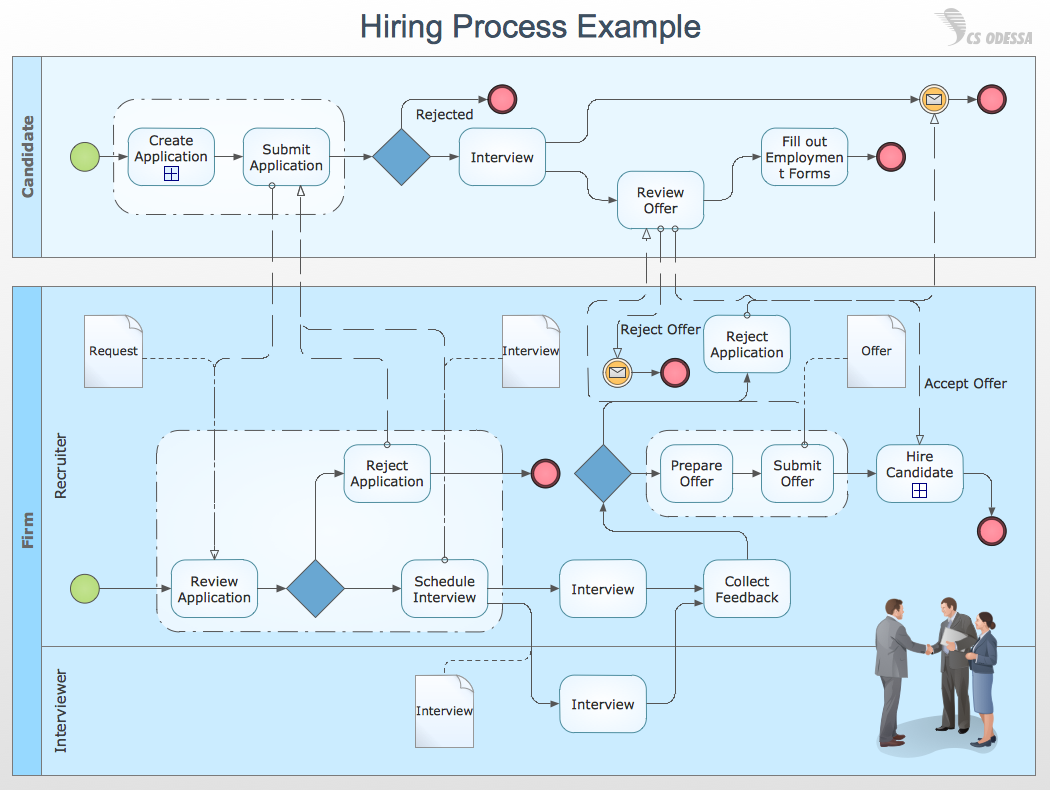
Pic.1 Business process TQM diagram.
Having ConceptDraw DIAGRAM diagramming and drawing software you can always mentioned the described processes in a way of a professionally created flowcharts, charts, schemes, plans and maps. Total Quality Management diagrams can be simply made in ConceptDraw DIAGRAM within only a short period of time as long as you use the right solution for such purpose.
TEN RELATED HOW TO's:
While creating flowcharts and process flow diagrams, you should use special objects to define different statements, so anyone aware of flowcharts can get your scheme right. There is a short and an extended list of basic flowchart symbols and their meaning. Basic flowchart symbols include terminator objects, rectangles for describing steps of a process, diamonds representing appearing conditions and questions and parallelograms to show incoming data.
This diagram gives a general review of the standard symbols that are used when creating flowcharts and process flow diagrams. The practice of using a set of standard flowchart symbols was admitted in order to make flowcharts and other process flow diagrams created by any person properly understandable by other people. The flowchart symbols depict different kinds of actions and phases in a process. The sequence of the actions, and the relationships between them are shown by special lines and arrows. There are a large number of flowchart symbols. Which of them can be used in the particular diagram depends on its type. For instance, some symbols used in data flow diagrams usually are not used in the process flowcharts. Business process system use exactly these flowchart symbols.
Picture: Basic of Flowchart: Meaning and Symbols
Related Solution:
The Total Quality Management Diagram solution helps your organization visualize business and industrial processes. Create Total Quality Management diagrams for business process with ConceptDraw software.
Picture: Definition TQM Diagram
Related Solution:
The Total Quality Management Diagram solution helps your organization visualize business and industrial processes. Create Total Quality Management diagrams for business process with ConceptDraw software.
Picture: Probability Quality Control Tools
Related Solution:
When trying to figure out the nature of the problems occurring within a project, there are many ways to develop such understanding. One of the most common ways to document processes for further improvement is to draw a process flowchart, which depicts the activities of the process arranged in sequential order — this is business process management. ConceptDraw DIAGRAM is business process mapping software with impressive range of productivity features for business process management and classic project management. This business process management software is helpful for many purposes from different payment processes, or manufacturing processes to chemical processes. Business process mapping flowcharts helps clarify the actual workflow of different people engaged in the same process. This samples were made with ConceptDraw DIAGRAM — business process mapping software for flowcharting and used as classic visio alternative because its briefly named "visio for mac" and for windows, this sort of software named the business process management tools.
This flowchart diagram shows a process flow of project management. The diagram that is presented here depicts the project life cycle that is basic for the most of project management methods. Breaking a project into phases allows to track it in the proper manner. Through separation on phases, the total workflow of a project is divided into some foreseeable components, thus making it easier to follow the project status. A project life cycle commonly includes: initiation, definition, design, development and implementation phases. Distinguished method to show parallel and interdependent processes, as well as project life cycle relationships. A flowchart diagram is often used as visual guide to project. For instance, it used by marketing project management software for visualizing stages of marketing activities or as project management workflow tools. Created with ConceptDraw DIAGRAM — business process mapping software which is flowcharting visio alternative or shortly its visio for mac, this sort of software platform often named the business process management tools.
Picture: Process Flowchart
Related Solution:
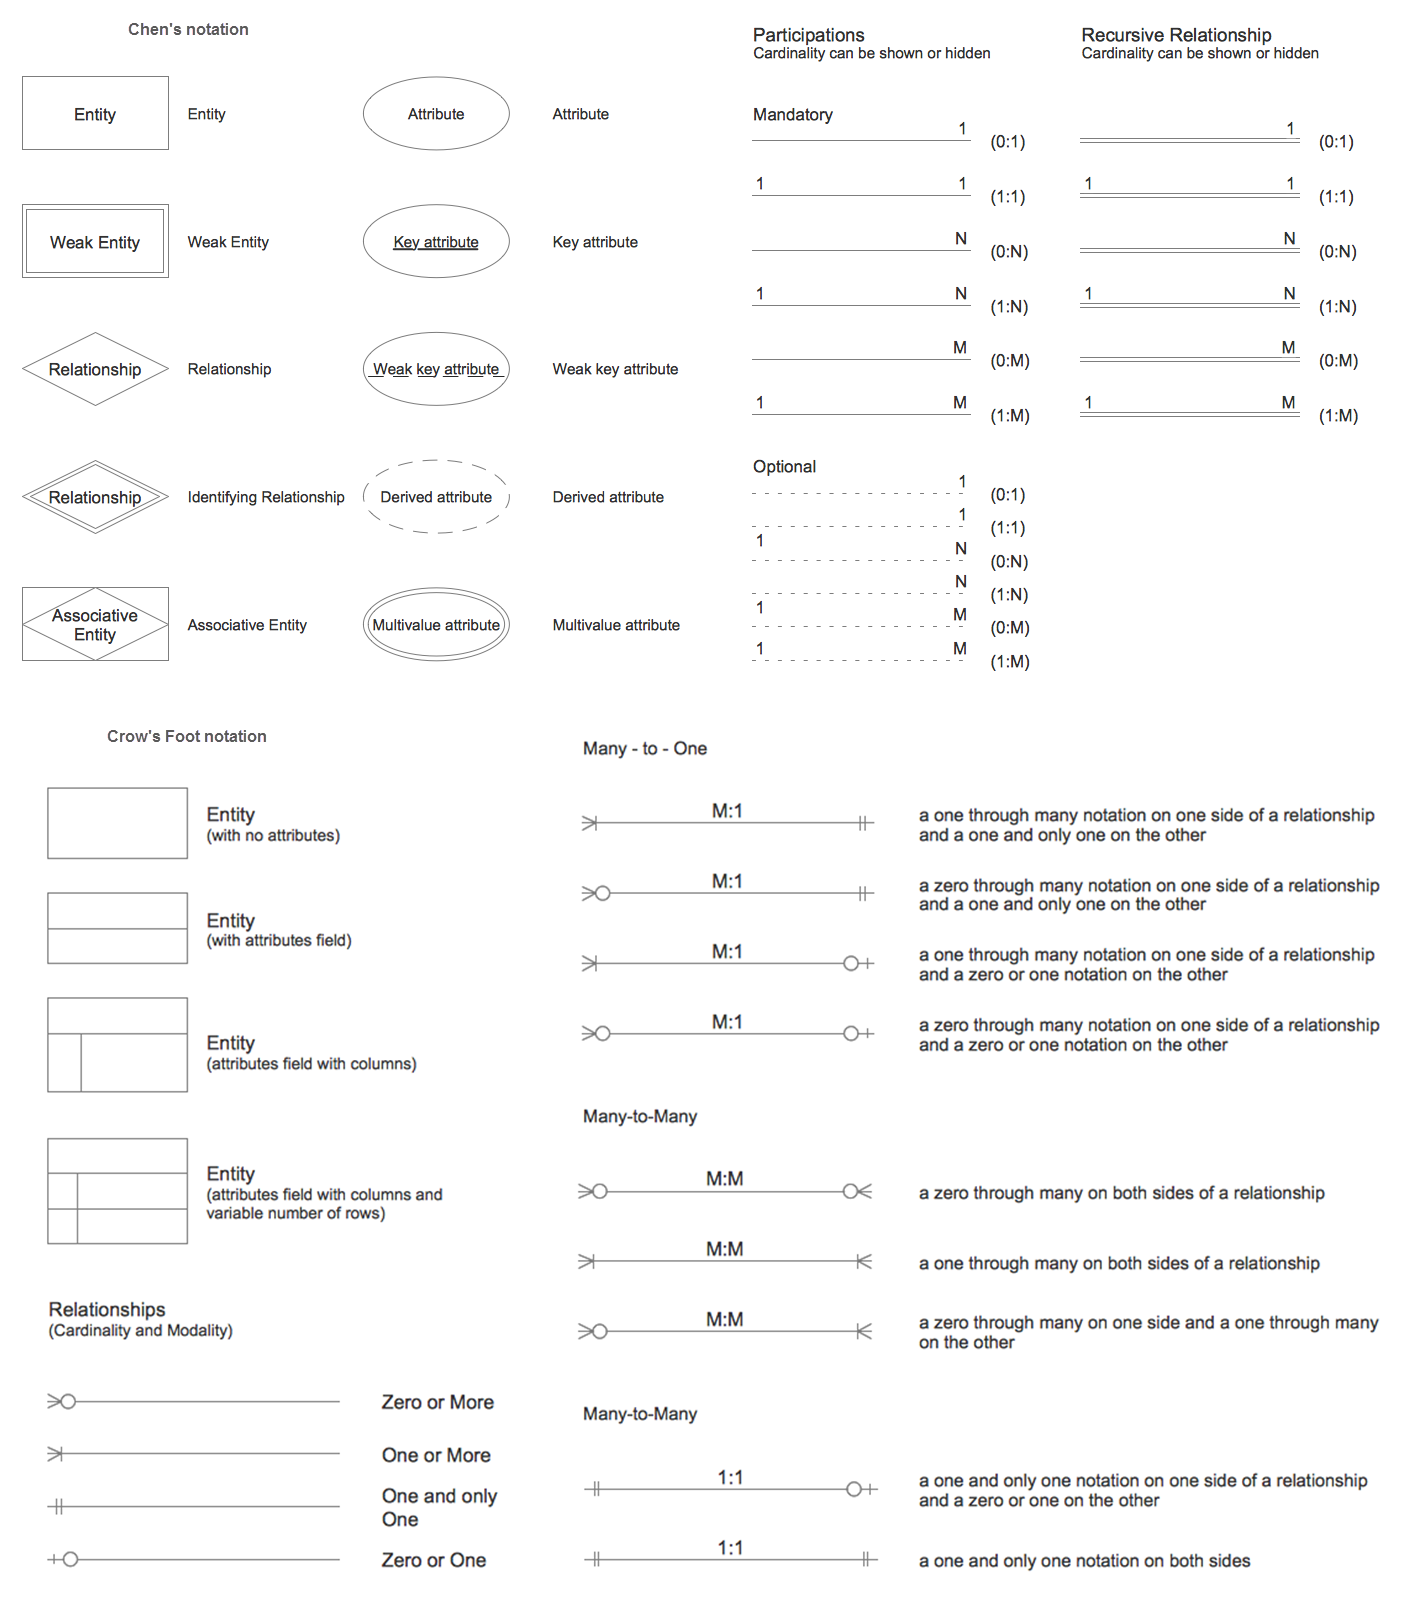
When we start to speak about databases, we must always mention database structure visualization. One of the most common ways to do it is to create an entity relationship diagram, and to put appropriate symbols on it. It is important either for database projecting and for its' future maintenance.
Entity Relationship Diagram describes data elements and their relationships within a database. There are a set of special symbols that depict each element of an entity relationship diagram. Entities - represents some stable components such as supplier, employee, invoice, client, etc. Relation symbols show how the entities interact. Attributes define characteristics of the relationships. Attributes can be one-to-one or many-to-many. Physical symbols is used in the physical models. They represent items such as fields, tables, types and keys. ERD physical symbols are the building material for the database. Notation lines are used to illustrate the relationships. The most common method is Crow’s Feet notation. You can use ConceptDraw Entity-Relationship Diagram (ERD) solution to represent a database using the Entity-Relationship model.
Picture: Entity Relationship Diagram Symbols
Related Solution:
ConceptDraw DIAGRAM is a world-class diagramming platform that lets you display, communicate, and present dynamically. It′s powerful enough to draw everything from basic flowcharts to complex engineering schematics.
Video tutorials on ConceptDraw products. Try it today!
Picture: Business Process Mapping — How to Map a Work Process
Related Solutions:
The Total Quality Management Diagram solution helps you and your organization visualize business and industrial processes. Create Total Quality Management diagrams for business process with ConceptDraw software.
Picture: TQM Diagram Example
Related Solution:
Unified Modeling Language (UML) is a language of graphic description for object modeling in the field of software engineering. UML was created for definition, visualization, designing of software systems. UML is an open standard that uses graphic notations for creating visual models of object-oriented software systems.
The Rapid UML Solution for ConceptDraw DIAGRAM presentsthe intuitive RapidDraw interface that helps you to make the UML Diagram of any of these 13 types quick and easy.
Picture: UML Software
Related Solution:
You can describe your own quality processes, brainstorm, and structure quality issues; then you can easily and quickly present it to your team.
Quality Management Mind Maps - Presentations, Meeting Agendas, Problem will be solved.
Picture: Why do you need the quality management for the organization
Related Solution:


