Immunology Visual Analytics
The methods of scientific and information visualization and visual analytics allow understanding the work of complex systems and processes. They support the analysis of huge volumes of interrelated data by means of using the visual interfaces, easier performance of diverse analytical tasks, like indication links, monitoring changes. Visual analytics is used to explore data, generate hypotheses and solutions, show connections between entities, find patterns in data, and identify trends.
The specialists of almost all fields of science utilize data visualization tools, create different graphs, charts, plots, maps, illustrations, infographics. But the use of visual tools and visual analytics is the most actual for the immunology field on the reason of its complexity and large volumes of data like flow cytometry, Luminex data, genotyping data, etc.
The visual analytics in immunology makes easy the understanding the working mechanisms of the immune system, structural and functional features of the immune responses. It helps the better perception of information, contributes to the development of science, making new discoveries and even breakthroughs in the field of immunology and immunization.
Visual analytics tools include diagrams, charts, graphs, infographics, illustrations, dashboards, histograms. You can design any from this variety fast and easy using the tools of a powerful Immunology solution from the Health area and other solutions from the ConceptDraw Solution Park. These tools make your data accessible and facilitate their understanding, contribute the increasing efficiency in their use, and enhance decision-making.

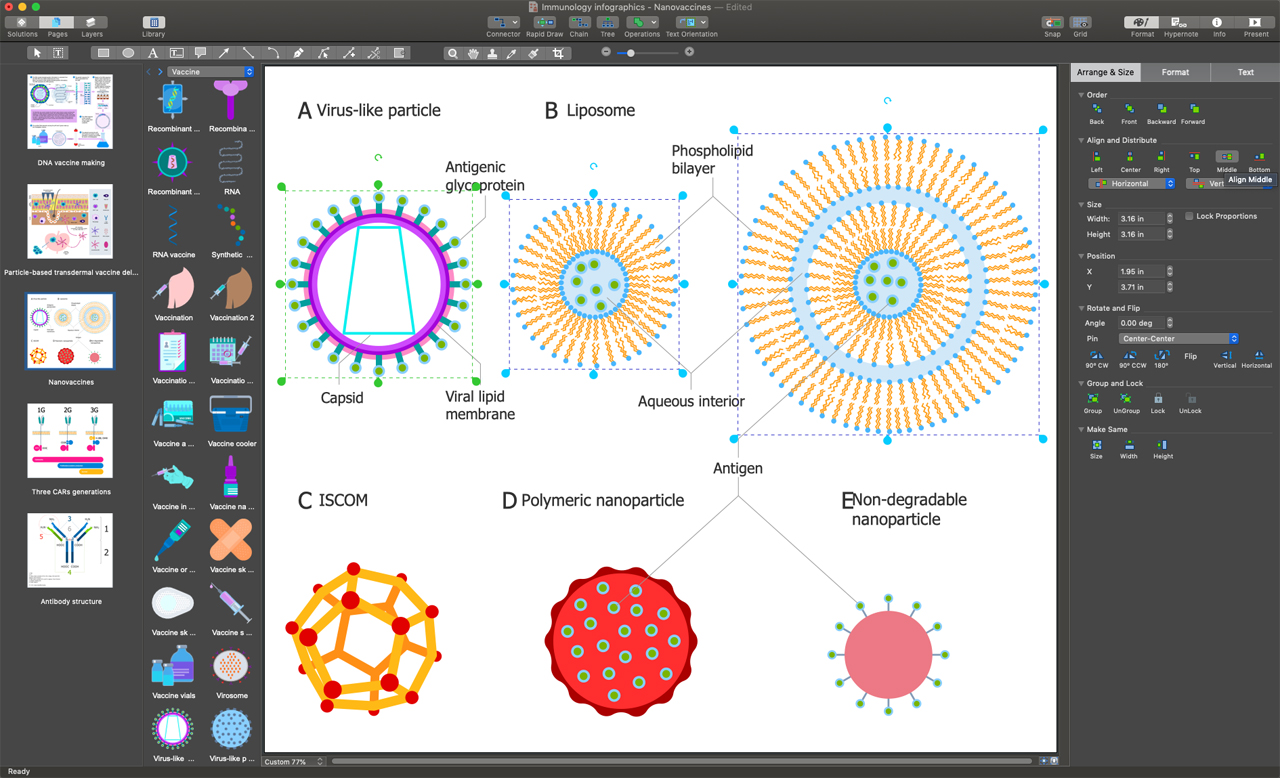
Example 1. Immunology Visual Analytics in ConceptDraw DIAGRAM
Due to the enormous collection of vector design elements — antigens and pathogens, antibodies, immune cells, immunotherapy, and much more immunology-related icons and clipart, ConceptDraw's Immunology solution greatly helps in visual analytics in the immunology area. Any visual immunology design, illustration, infographic, or diagram can be now constructed in a few easy movements. Place the information or data you want to present in your diagram. Then simply drag all desired accompanying clipart or icons from the libraries to your document, arrange them, and make formatting settings.
Example 2. Immunology Solution Libraries Design Elements
The immunology illustration you see on this page was created in ConceptDraw DIAGRAM software using the Immunology Solution. It successfully demonstrates solution's capabilities and professional results you can achieve. An experienced user spent 10 minutes creating it.
Use the powerful tools of the Immunology Solution for ConceptDraw DIAGRAM software to create your own illustrations and diagrams of any complexity fast and easy, and then successfully use them in your work activity.
All source documents are vector graphic documents. They are available for reviewing, modifying, or converting to a variety of formats (PDF file, MS PowerPoint, MS Visio, and many other graphic formats) from the ConceptDraw STORE. The Immunology Solution is available for all ConceptDraw DIAGRAM users.
