
Sample 1. Influence Diagram Software
This sample shows the Influence diagram. It is a directed acyclic graph with three types of nodes: Decision node is drawn as a rectangle, Uncertainty node is drawn as an oval, Value node is drawn as an octagon. The nodes are connected with arcs.

Sample 2. Influence Diagram
The Influence diagrams produced with ConceptDraw DIAGRAM are vector graphic documents and are available for reviewing, modifying, and converting to a variety of formats for diagram makers (image, HTML, PDF file, MS PowerPoint Presentation, Adobe Flash or MS Visio).
Sometimes, the influence can be visualized more effectively than with Influence Diagram. For instance, the influence can be figured as a bubble diagram. The possible visualization idea is using bubbles associating the size of circles with a level of influence and the distance between circles - with probability of influence. Depending on visual objective, there are more options: also the size of circles can be associated with a number of influensive factors and the distance between circles associated with a level of impact. Instead of bubble diagram it also can be shown with pyramid diagram or mindmap diagram. All this visualization options are availbale in ConceptDraw DIAGRAM. This diagram maker software include professionally designed symbols and templates from ConceptDraw Solution Park.
Diagram Maker :
The full list of supported diagrams available in ConceptDraw Solution Park, this is extensive collection of graphical symbols and charting elements for major charting types, such as Venn diagram to visualize intersections, flow and chart diagram, block diagram, column and bar charts, bubble and line, spider charts and many other. It refers to the area of ConceptDraw Solution Park — Management Area for planning and organizing. Ther are templates for decision making, planning, analisys, timelines and typical orgcharts diagrams.
TEN RELATED HOW TO's:
ConceptDraw MINDMAP an Alternative to MindJet MindManager - The power, economy, and versatility of ConceptDraw MINDMAP takes personnel and team productivity to another level. Discover today what this means to you.
Picture: Why People Select ConceptDraw MINDMAP
Related Solution:
The 7 Management and Planning Tools solution implements well-known methodologies for problem analysis and solving. Different products from the ConceptDraw Office suite can be used as a complete solution for any of the methodologies in this solution. ConceptDraw Office provides visual communication during every stage of work.
Picture: 7 Management & Planning Tools
Related Solution:
ConceptDraw DIAGRAM is a very easy-to-use and intuitive database design tool which can save you hundreds of work hours. See database diagram samples created with ConceptDraw DIAGRAM database modeling database diagram software.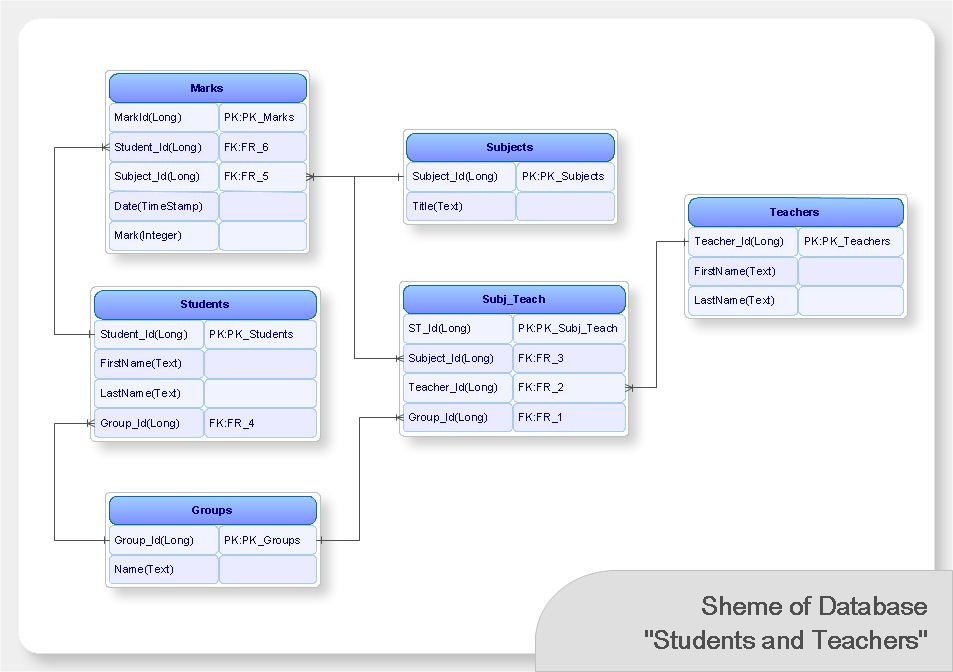
Picture: ConceptDraw DIAGRAM Database Modeling Software
ConceptDraw DIAGRAM has the powerful tools for rapid drawing Fishbone diagrams and identifying many possible causes for an effect for problem solving. Causes can be grouped into major categories to identify these sources of variation. Easy create Fishbone diagrams with the ConceptDraw DIAGRAM software and Fishbone Diagrams solution included to ConceptDraw Solution Park!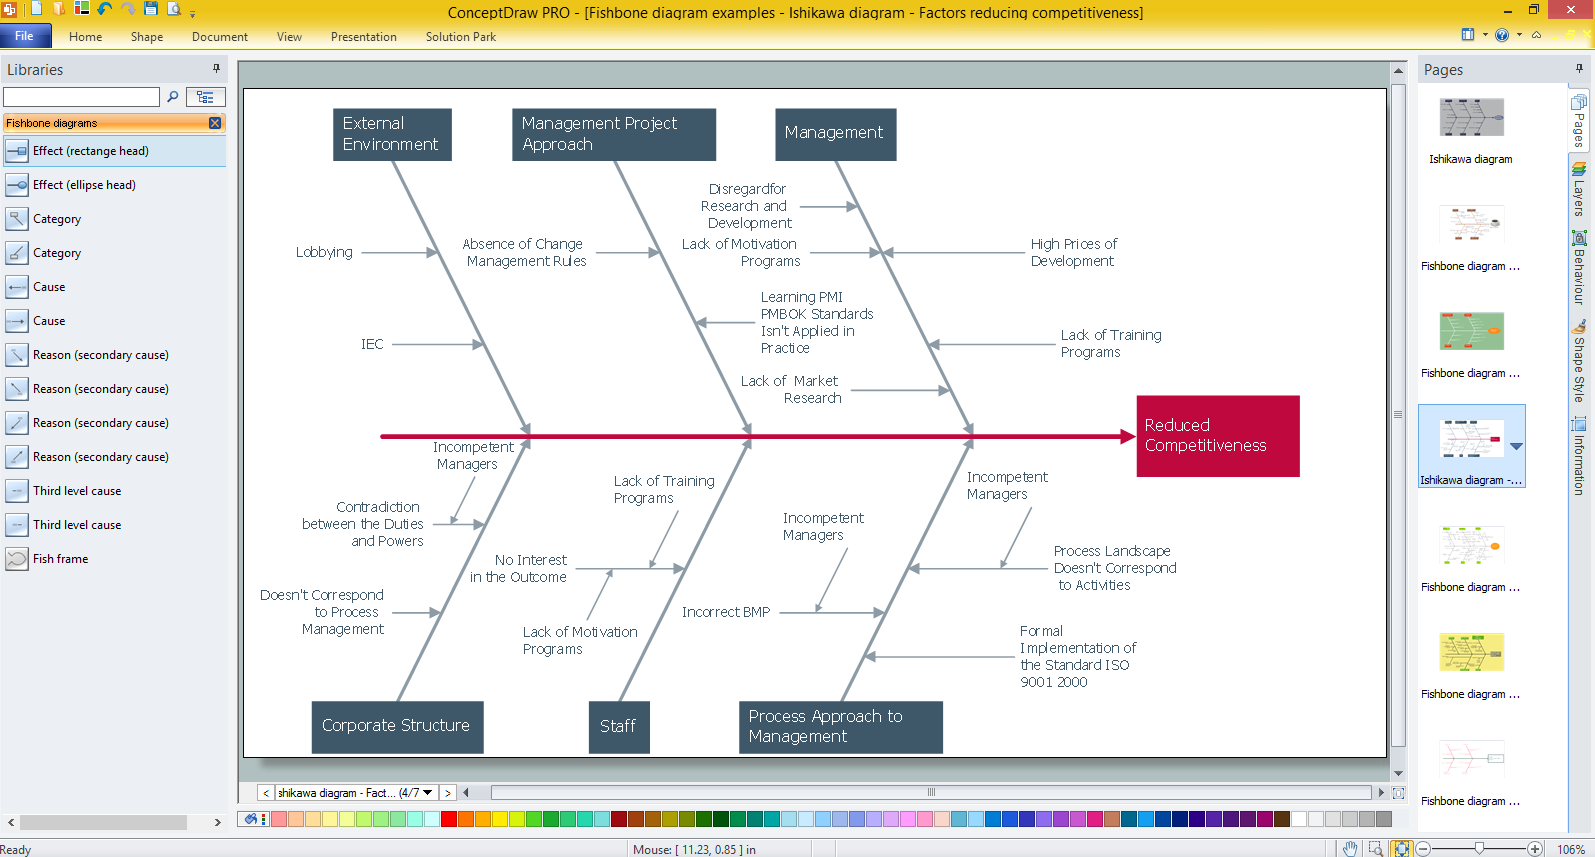
Picture: Create Fishbone Diagrams with the ConceptDraw
Related Solution:
When we think of an hierarchy, we intuitively imagine a pyramid. Thus, a lot of management tools use pyramid charts as examples or illustrations of various documents or models. You can create any type of triangle diagram using ConceptDraw DIAGRAM.
A triangle (pyramid) diagram is often used in marketing to show the data hierarchy. This pyramid diagram represents the Top Brand Model. It illustrate the model of rebranding strategy. It can be used by marketing agency dealing with rebranding strategies development. It’s critical for marketing diagrams to be both clear and eye catching. ConceptDraw Pyramid diagrams solution meet all these requirements and can be successfully applied for creating and presenting various marketing pyramidal diagrams.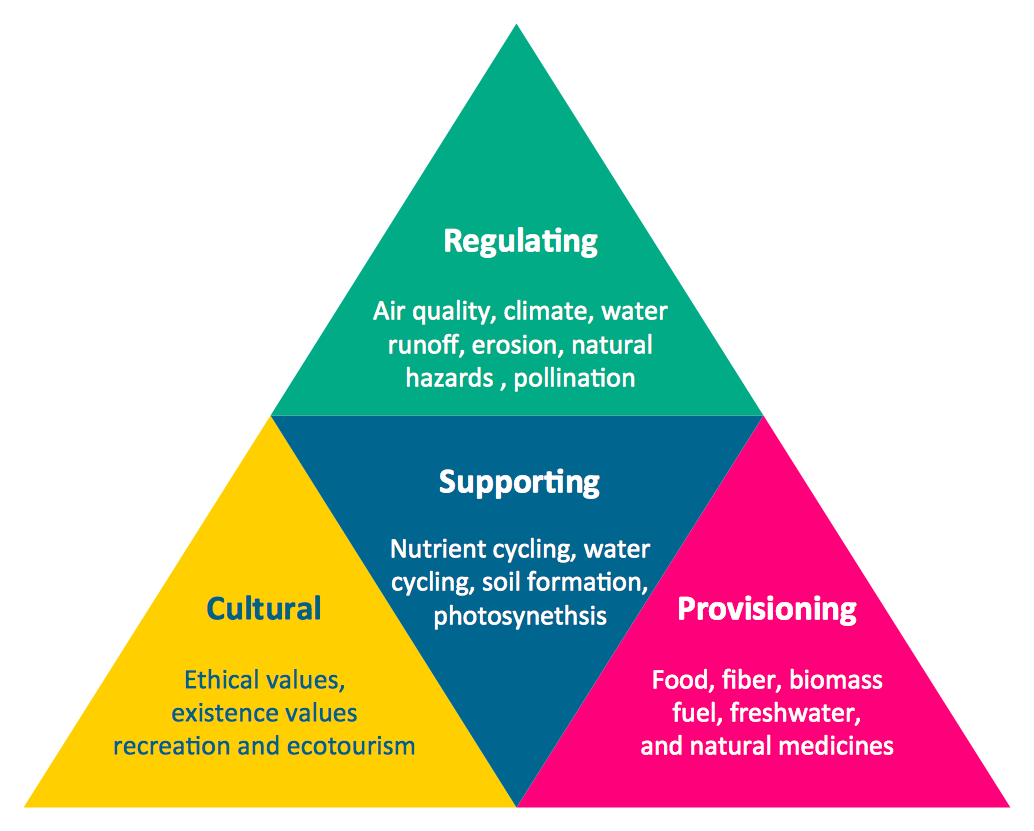
Picture: Pyramid Chart Examples
Related Solutions:
ConceptDraw gives the ability to draw simple diagrams like flowcharts, block diagrams, bar charts, histograms, pie charts, divided bar diagrams, line graphs, area charts, scatter plots, circular arrows diagrams, Venn diagrams, bubble diagrams, concept maps, and others.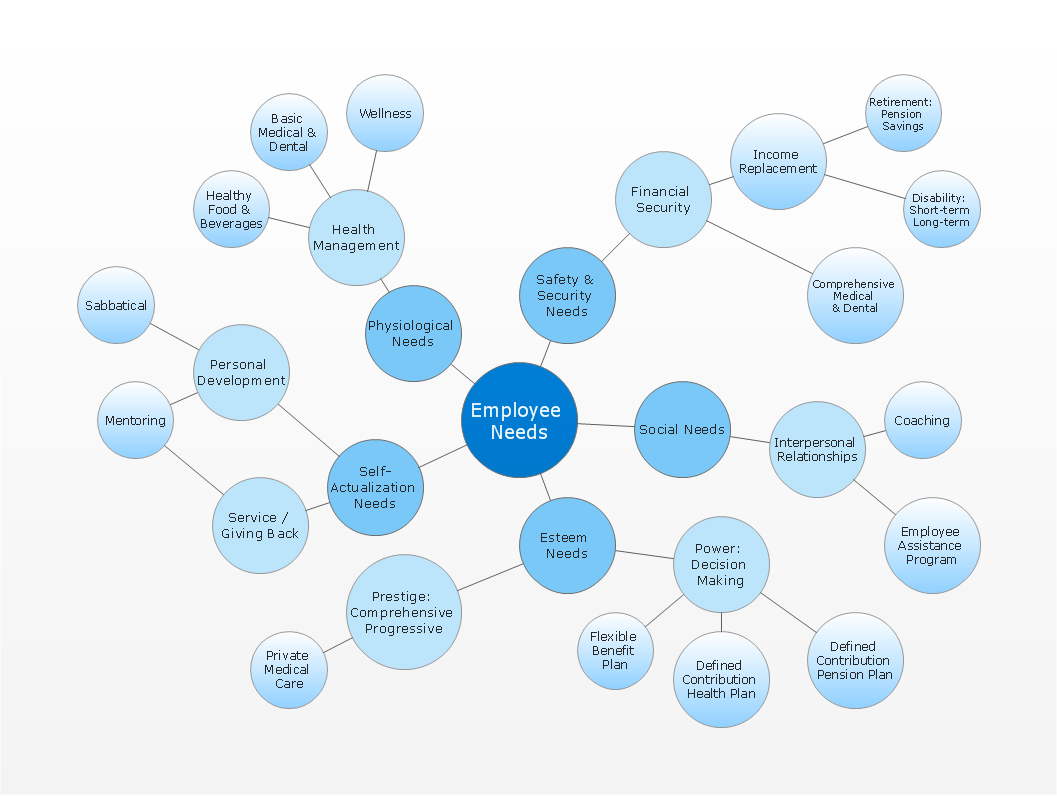
Picture: Simple Drawing Applications for Mac
Related Solution:
The term “cloud” is very popular and widely used now, it is a server, data processing centre, or a network which lets to store the data and software, provides access to them, allows to run applications without installation and gives the possibility to process data hosted remotely via the Internet connection.
For documenting the Cloud Computing Architecture with a goal to facilitate the communication between stakeholders are successfully used the Cloud Computing Architecture diagrams. It is convenient and easy to draw various Cloud Computing Architecture diagrams in ConceptDraw DIAGRAM software with help of tools of the Cloud Computing Diagrams Solution from the Computer and Networks Area of ConceptDraw Solution Park.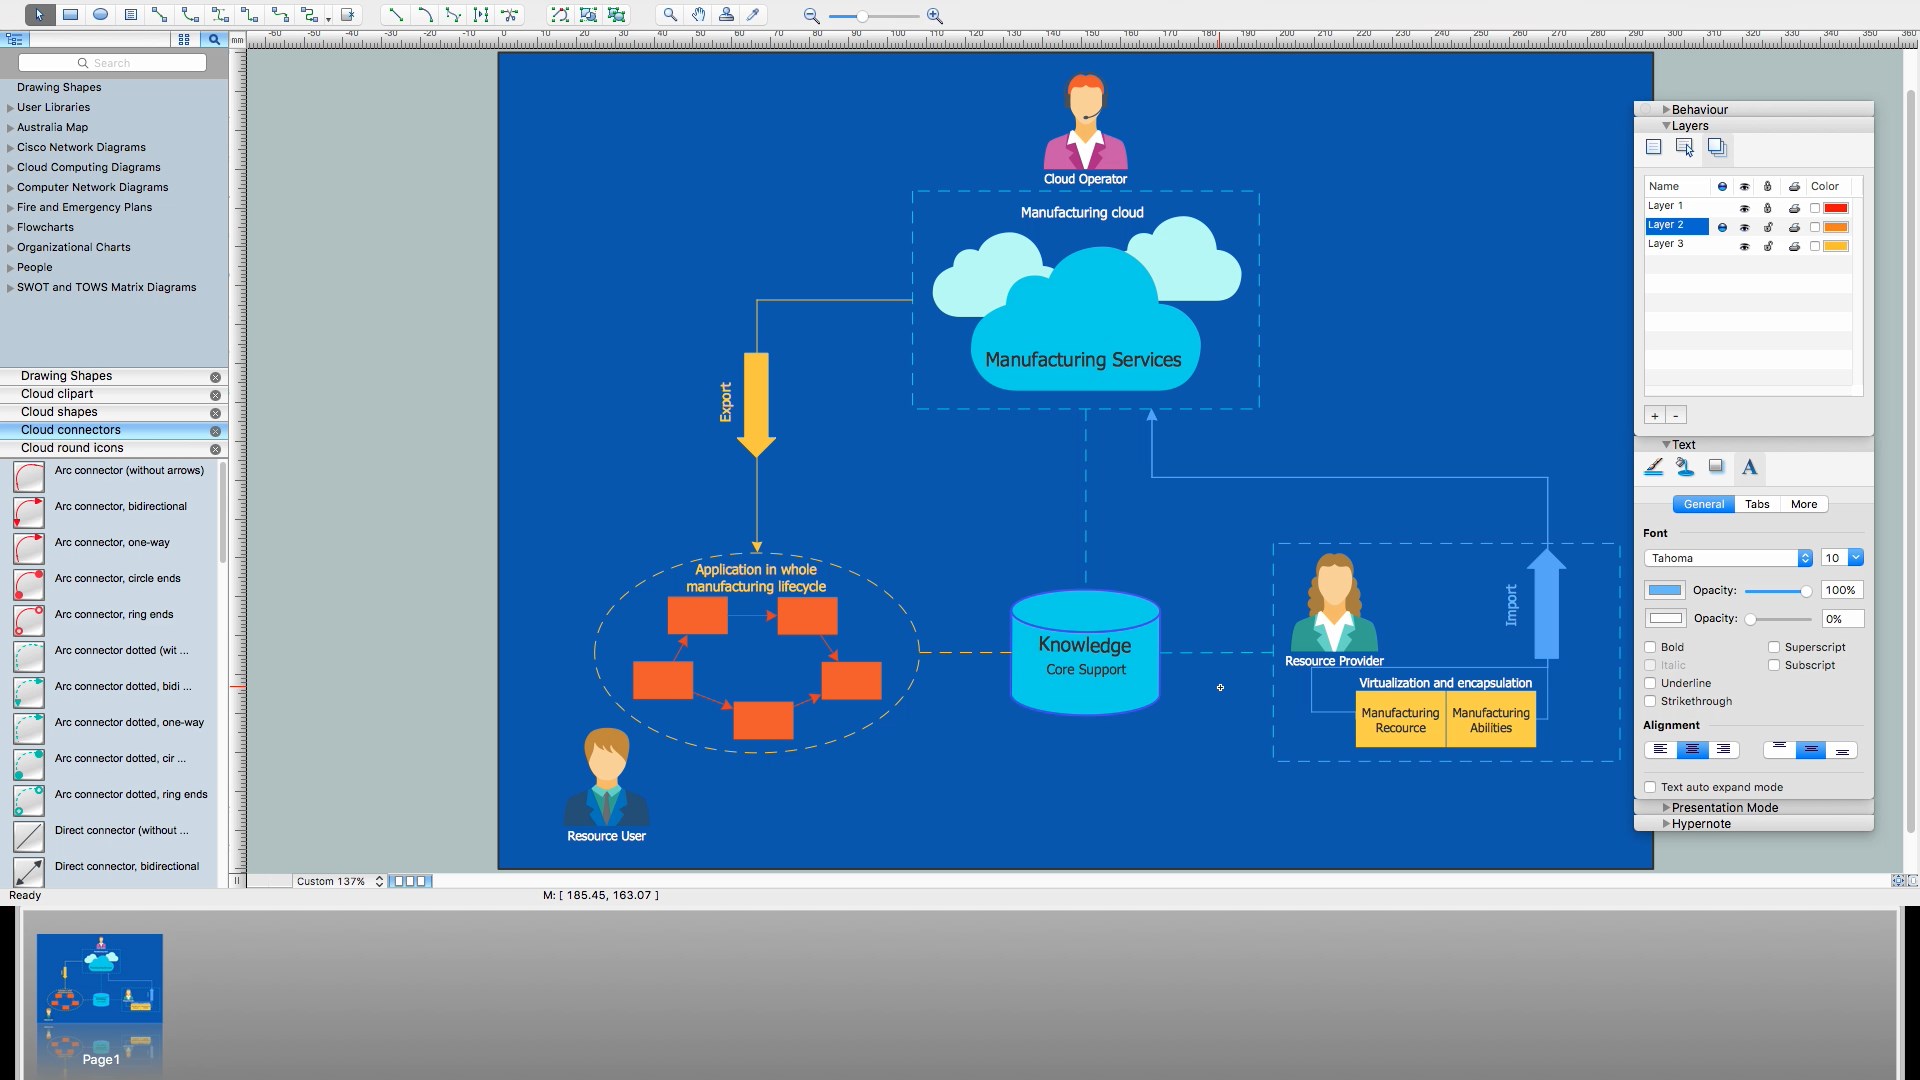
Picture: How to Build Cloud Computing DiagramPrincipal Cloud Manufacturing
Related Solution:
Accounting Data Flow from the Accounting Flowcharts Solution visually describes the financial accounting process, shows the accumulated information about transactions and events for creating the balance sheet and the final income statement.
Accounting Flowcharts Solution contains also a wide variety of templates and samples that you can use as the base for your own Accounting Flowcharts of any complexity.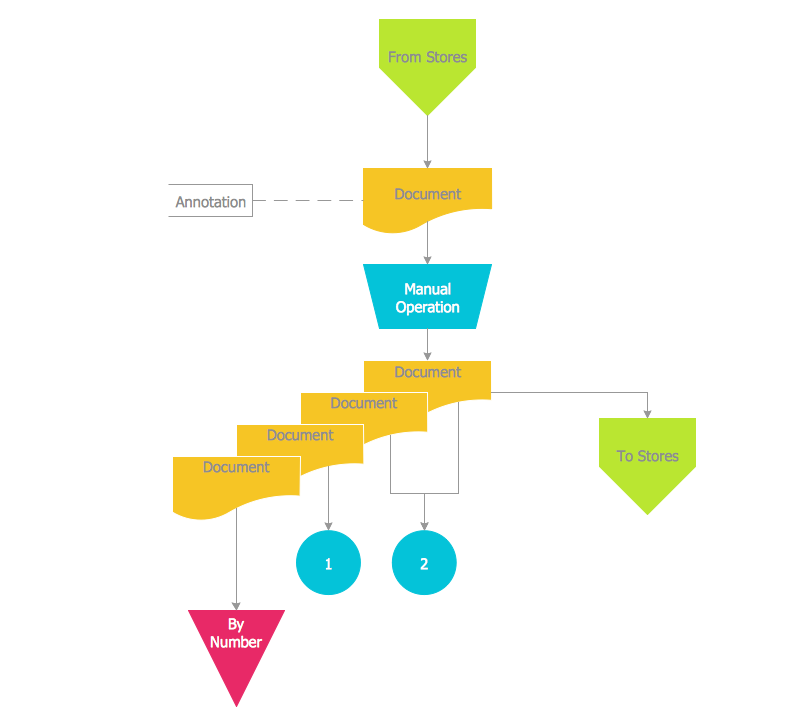
Picture: Accounting Data Flow from the Accounting Flowcharts Solution
Related Solution:
There are many ways to describe a database structure. One of the most usual is to draw an entity relationship diagram (ERD) using a Crow’s Foot notation to represent database elements. If you don’t want to draw it on paper, you should use an appropriate software.
An entity-relationship (ER) diagram is used to show the structure of a business database. ERD represents data as objects (entities) that are connected with standard relationships symbols which Illustrate an association between entities. ERD, there is a wide range of ERD notations used by data bases architects for reflecting the relationships between the data entities. According to the crow’s foot notation relationships are drawn as single labeled lines designating a certain kinds of relationship. Crow foot notation is a most frequently used ERD standard, because of improved readability of diagrams, with a more accurate use of space on the page._Win_Mac.png)
Picture: Entity Relationship Diagram - ERD - Software for Design Crows Foot ER Diagrams
Related Solution:
Learn about Systems Engineering, its process and discover practical examples illustrated through diagrams. ✔️ How to draw Systems Engineering diagrams using the ConceptDraw DIAGRAM software?
Picture:
What is a Systems Engineering?
Examples of Systems Engineering Diagrams
Related Solution: