Infographic Making Software
An infographic is a graphic visual representation of data, information, or knowledge. It is an effective tool created as an attractive, clear, and vivid image. It helps to enhance the human visual system's ability to see interconnections, patterns, and trends. Infographics are the best way to visualize information in different fields, summarize data, collect and show statistical data. They bring clarity and make complex information understandable and easily remembered by people. Infographics help direct your audience to key points, assist them in understanding your point of view, and coming to a correct conclusion. The more appealing the information is, the easier it is to digest and the more likely your audience is engaged to process it, also it brings you new clients and greater success.
Due to their simplicity and compelling view, infographics gained great popularity in advertising, business, management, marketing, statistics, education, and many other fields. They are used in presentations, reports, and other print materials, on billboards, and on the web. Beautiful infographics boost your productivity, they are successfully shared all over the Internet and on social media. It is also a way to bring your ideas to life and receive feedback.
Infographics are a powerful way of data visualization and a strong advertising tool. They present a lot of information in a small space, help to simplify complex subjects, compare different pieces of data, containing minimum of text and obligatory appealing visual content. Infographics may include images, clipart, diagrams, quantitative information in the form of graphs, timelines, maps, also textual information, interactive elements, and other kinds of symbols and pictograms to make them appealing to the audience.
Infographics are a valuable tool for driving results in business. They are attractive, easy to digest, and easily shareable in mass media and social media, which provide the possibility to reach a wider audience and greater success. Infographics are a beneficial way to present information to your shareholders and business partners. They can see the company's growth in appealing graphs, not in raw numbers, and compare if they meet their expectations. Data visualization helps the audience to come to their own conclusions.
In marketing and advertising, visually attractive content helps to get a new audience, attracts people to products and services, helps to get a sense of the brand and increase its awareness. You can also explain the aspects and advantages of your marketing strategy to clients or colleagues, attract attention and build trust with your audience, make your clients feel confident and need your product or service.

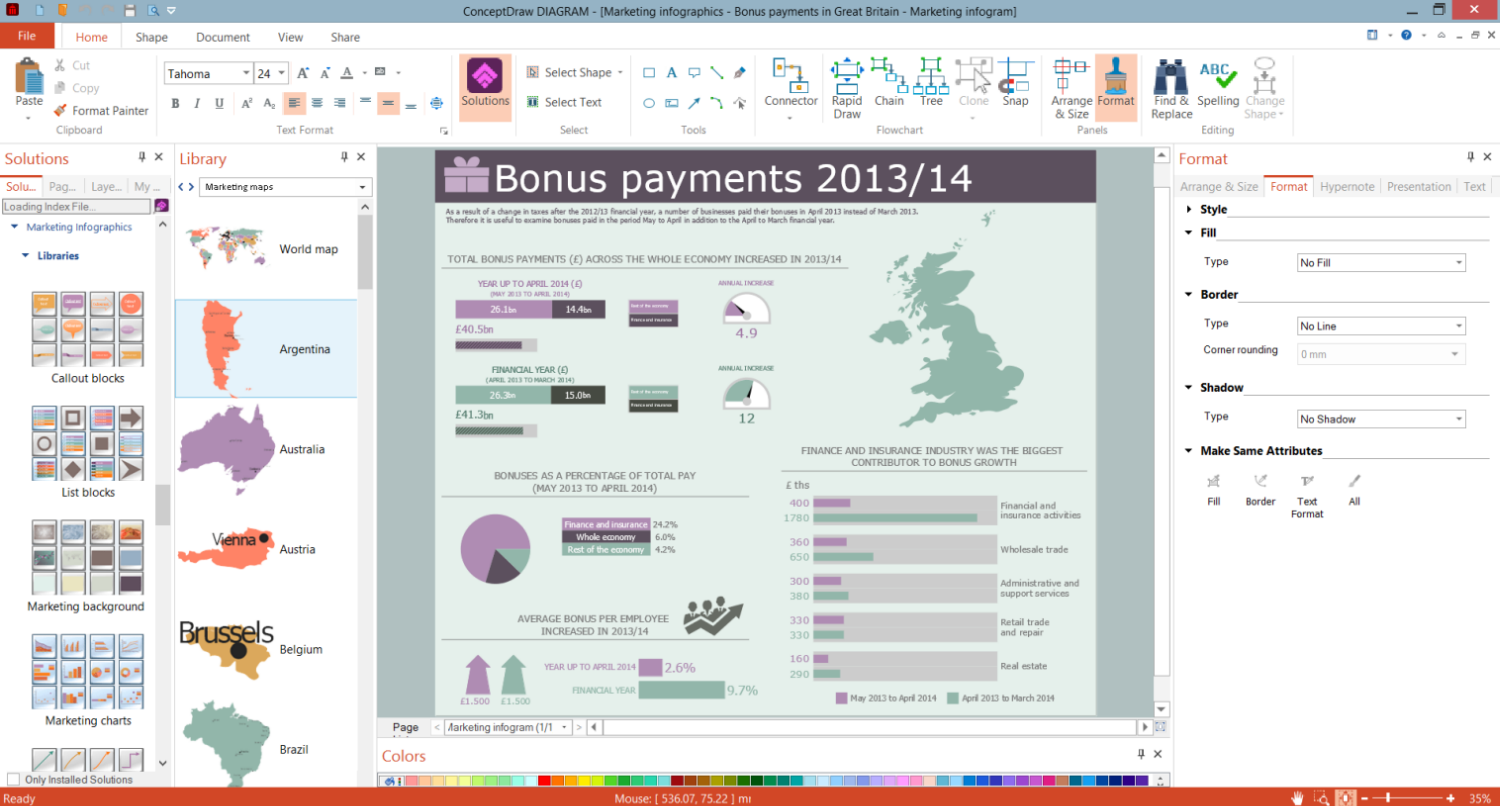
Example 1. Infographic Making Software DIAGRAM
Infographics help to illustrate the decision-making process, the project's progress, the system's architecture, and many other aspects of your business project. If you work with big amounts of data, research data, infographics help to structure them, summarize the main data points, present the information in an understandable and easy-for-perception way, and do an in-depth analysis. Sometimes, infographics help to break processes into smaller and more understandable steps. You can also share your findings, conclusions, market research, introduce a new idea, the latest development or a new concept. The infographics may include maps and show the distribution of data on it, for example, to show the difference in consuming a particular product or service in different regions of a particular country or in the entire world, compare the indicators for different countries, show the progression, and predict the future values.
Infographics are incredibly useful in education, they help to break down complex information and display knowledge in a simple form. By presenting information through visuals, the lecturers keep their students engaged in the learning process efficiently. This form is the most appealing way to digest information, it makes educational materials visual and likely to be remembered. Infographics with timelines allow presenting information with accounting time periods in chronological order when particular activities happened. Infographics make it easier to process information because visual content is processed faster by the human brain than written one.
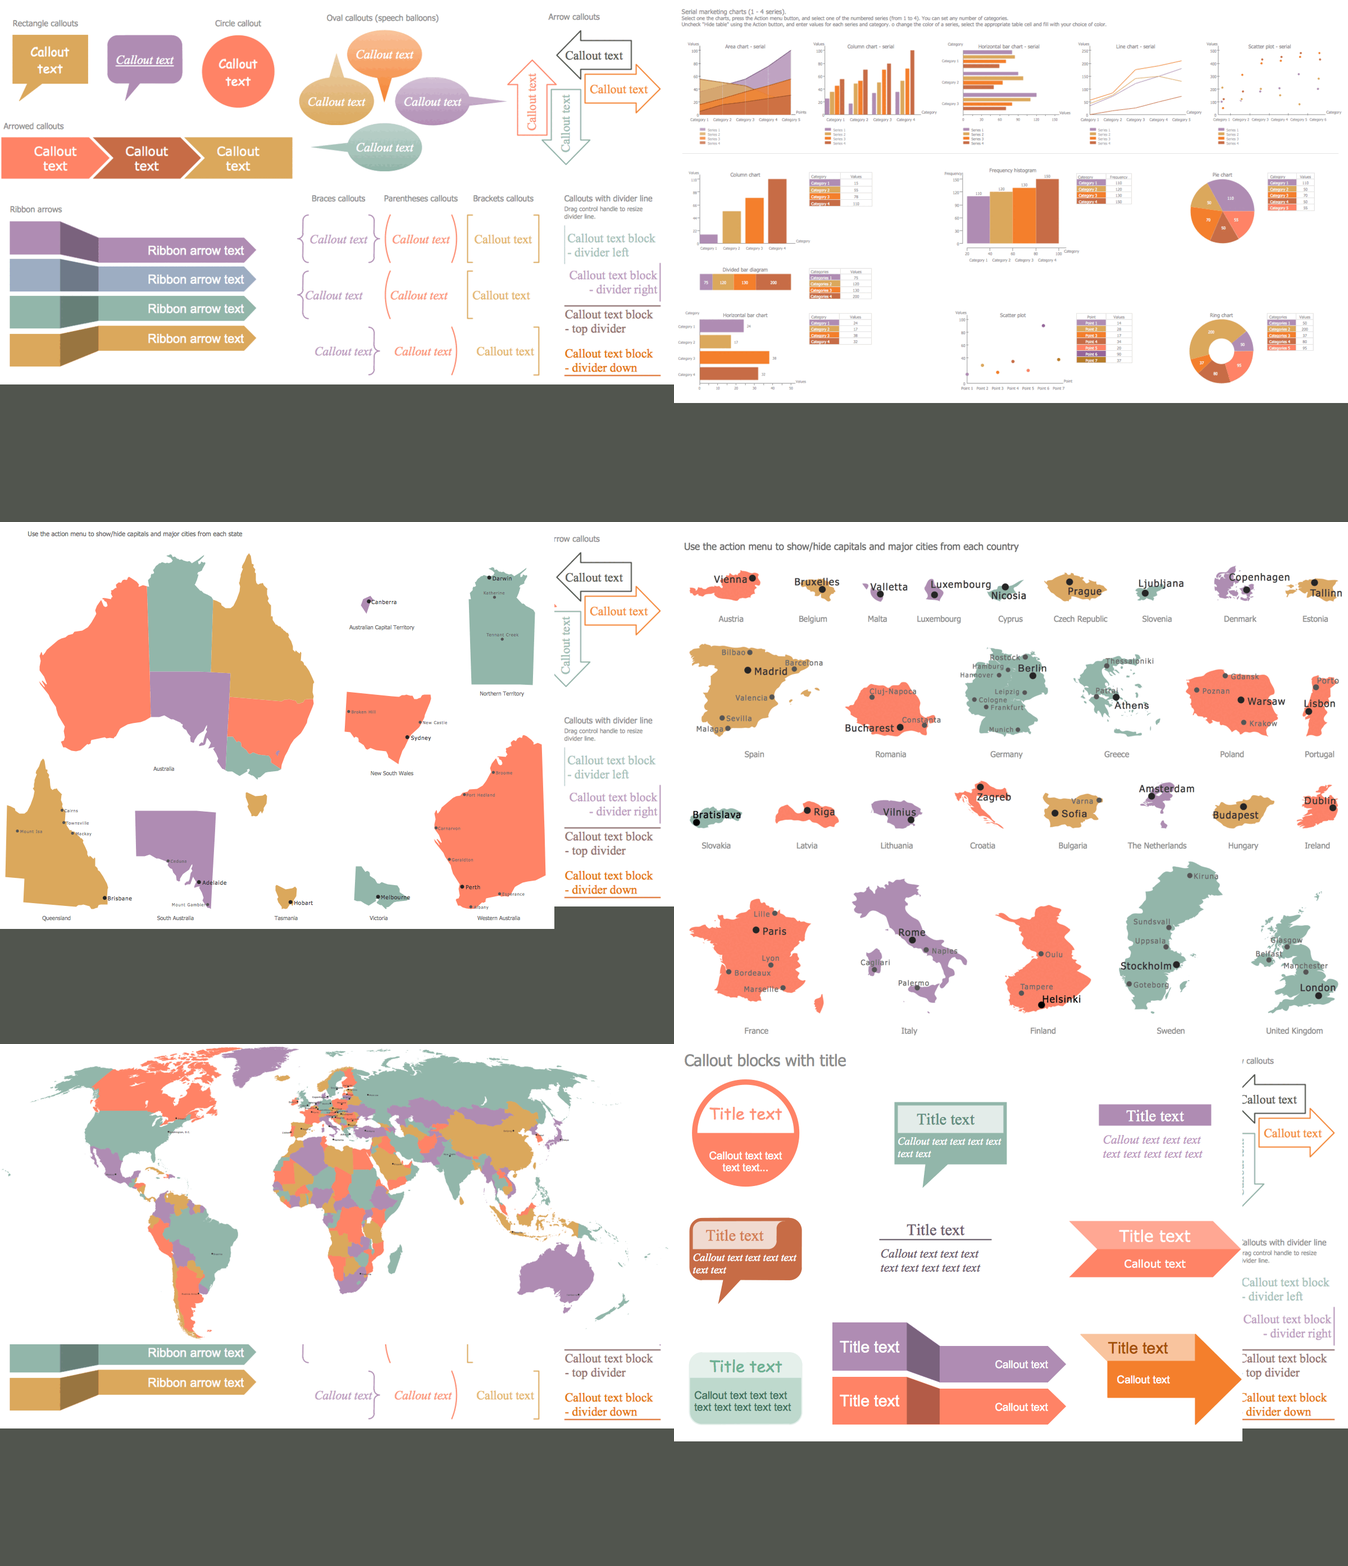
Example 2. Marketing Infographics Libraries Design Elements
You don't have to be a professional designer in order to create an infographic. Using the drawing tools of ConceptDraw DIAGRAM infographic making software you can create stunning visuals in an engaging and pleasing manner quickly and easily. The ready-made vector design elements from the Marketing Infographics solution libraries will help you to stay efficient. Identify your target audience and include the relevant content to your infographic to create appealing complex or simple infographics targeted directly to your audience. Experience all the advantages of using infographics, which are better for communicating data and information than strict text and numbers in spreadsheets.
You can create an infographic from scratch or use the pre-made samples included in the Marketing Infographics solution or other solutions from the Business Infographics package. They also can become your inspiration. Design your infographics using attractive colors, shapes, icons, and other graphics in a unified style. Apply various fonts or bold fonts to highlight certain information and attract the audience's attention to it. Once your infographic is ready, you can share it with your audience, your team to receive feedback and make appropriate changes, if required.
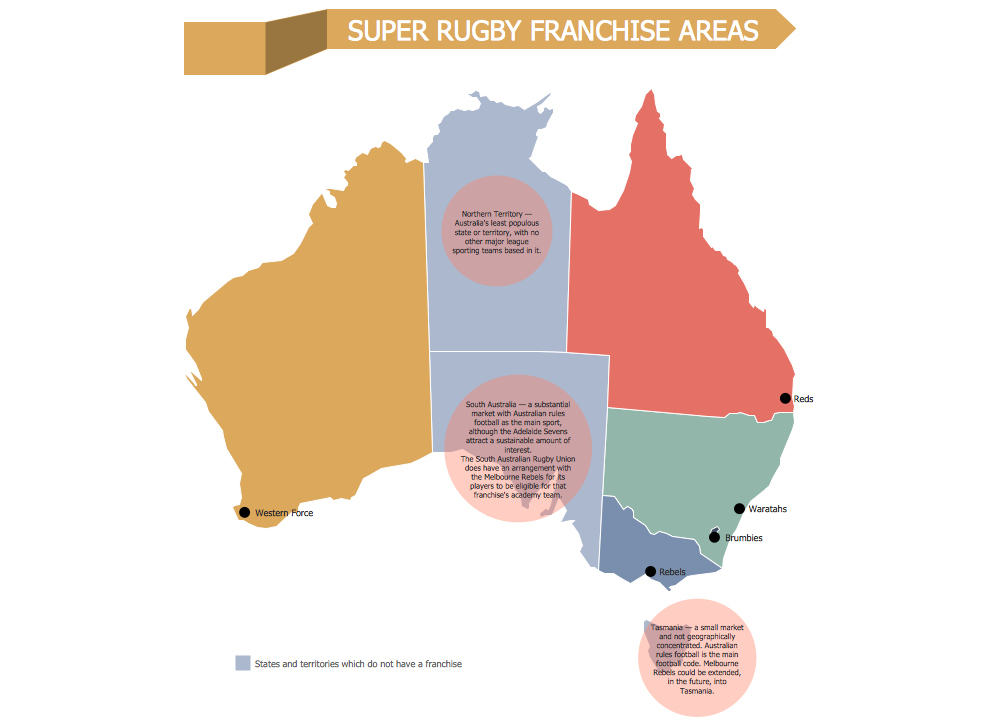
Example 3. Marketing Infographics — Super Rugby Franchise Areas
The infographics you see on this page were created in ConceptDraw DIAGRAM software using the Marketing Infographics Solution and its pre-made pictograms and clipart. They successfully demonstrate the solution's capabilities and professional results you can achieve. An experienced user spent 10-15 minutes creating each of these samples.
Use Marketing Infographics Solution for ConceptDraw DIAGRAM diagramming and vector drawing software to create your own professional looking Internet Marketing Infographic of any complexity quick, easy and effective, and then successfully use it in various marketing campaignes, presentations, websites publications, blog posts, etc.
All source documents are vector graphic documents. They are available for reviewing, modifying, or converting to a variety of formats (PDF file, MS PowerPoint, MS Visio, and many other graphic formats) from the ConceptDraw STORE. The Marketing Infographics Solution is available for ConceptDraw DIAGRAM users.

