Interactive voice response (IVR) networks.
Computer and Network Examples
Interactive Voice Response (IVR) is a system of the prerecorded voice messages that allows a computer to interact with humans. IVR performs the function of the routing calls within a call center, using the information entered by the customer on the phone keypad in the touchtone mode.
The examples of the IVR systems are telephone banking, televoting, credit card services, automobile systems for hands-free, etc. IVR systems are usually used for service the high call volumes, for improvement the customer experience, reducing the costs.
ConceptDraw DIAGRAM is a powerful diagramming and vector drawing software that allows quick and easy draw the IVR network diagrams.
Computer and Networks Area provides solutions that contain the libraries with a great number of predesigned vector stencils, a set of professional looking examples that you can change for your needs.

Example 1. Interactive voice response (IVR) networks
This example was created in ConceptDraw DIAGRAM using the Computer and Networks Area of ConceptDraw Solution Park and show the Interactive Voice Response (IVR) network.
All networks designed with ConceptDraw DIAGRAM are vector graphic documents and are available for reviewing, modifying, and converting to a variety of formats (image, HTML, PDF file, MS PowerPoint Presentation, Adobe Flash or MS Visio).
See also Samples:
TEN RELATED HOW TO's:
A Storage area network (SAN) is a dedicated network that provides access to data storage and operations only on the block level. SAN usually has own network of storage devices/elements and disk arrays that are connected with each other and to a remote data-sharing network. SANs are widely used for enhancing the storage devices (optical jukeboxes, disk arrays, tape libraries) that are accessible for networked servers.
This example was created in ConceptDraw DIAGRAM using the Computer and Networks Area of ConceptDraw Solution Park. It shows the hybrid of Storage area network (SAN) and Network Attached Storage (NAS) technologies.
Picture: Storage area networks (SAN). Computer and Network Examples
Related Solution:
The ConceptDraw vector stencils library Cisco WAN contains equipment symbols for drawing the computer wide area network diagrams.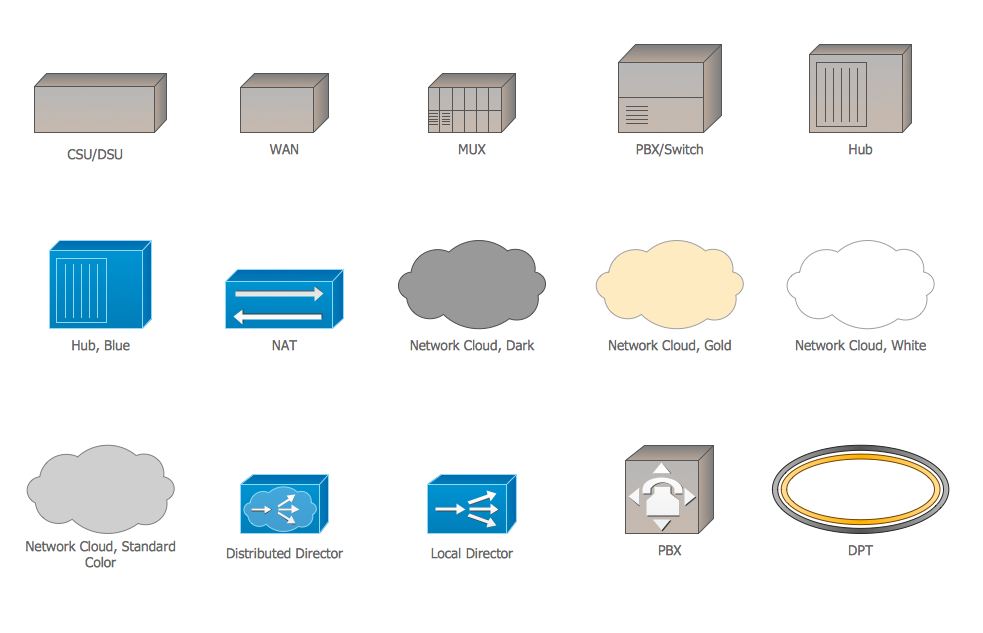
Picture: Cisco WAN. Cisco icons, shapes, stencils and symbols
Related Solution:
The ConceptDraw vector stencils library Cisco Products Additional contains equipment symbols for drawing the computer network diagrams.
Picture: Cisco Products Additional. Cisco icons, shapes, stencils and symbols
Related Solution:
Mindmap Presentation. Present Mindmaps via Skype with ConceptDraw MINDMAP.
Picture: MindMap Presentation
Related Solution:
The UML diagrams in this Solution are divided into three broad categories: Structure Diagrams; Behavior Diagrams; Interaction Diagrams.
The 13 diagrams contained in the Rapid UML Solution offer an essential framework for systems analysts and software architects to create the diagrams they need to model processes from the conceptual level on through to project completion.
Picture: How to create your UML Diagram
Related Solution:
The ConceptDraw vector stencils library Cisco Media contains symbols for drawing the computer network diagrams.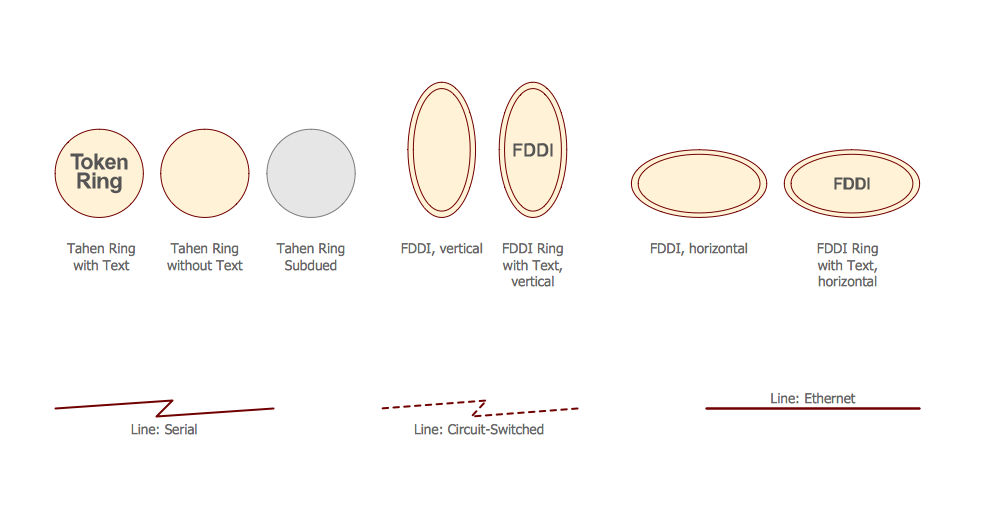
Picture: Cisco Media. Cisco icons, shapes, stencils and symbols
Related Solution:
The economic calendar is a convenient way to display the economic events, the situation on the financial markets, it is a handy tool to keep track the chronology and dynamics of important events in the economy. But how design an economic calendar? ConceptDraw DIAGRAM extended with Calendars Solution from the Management Area is a useful, convenient and effective software for quick and easy design professional looking and attractive economic calendars.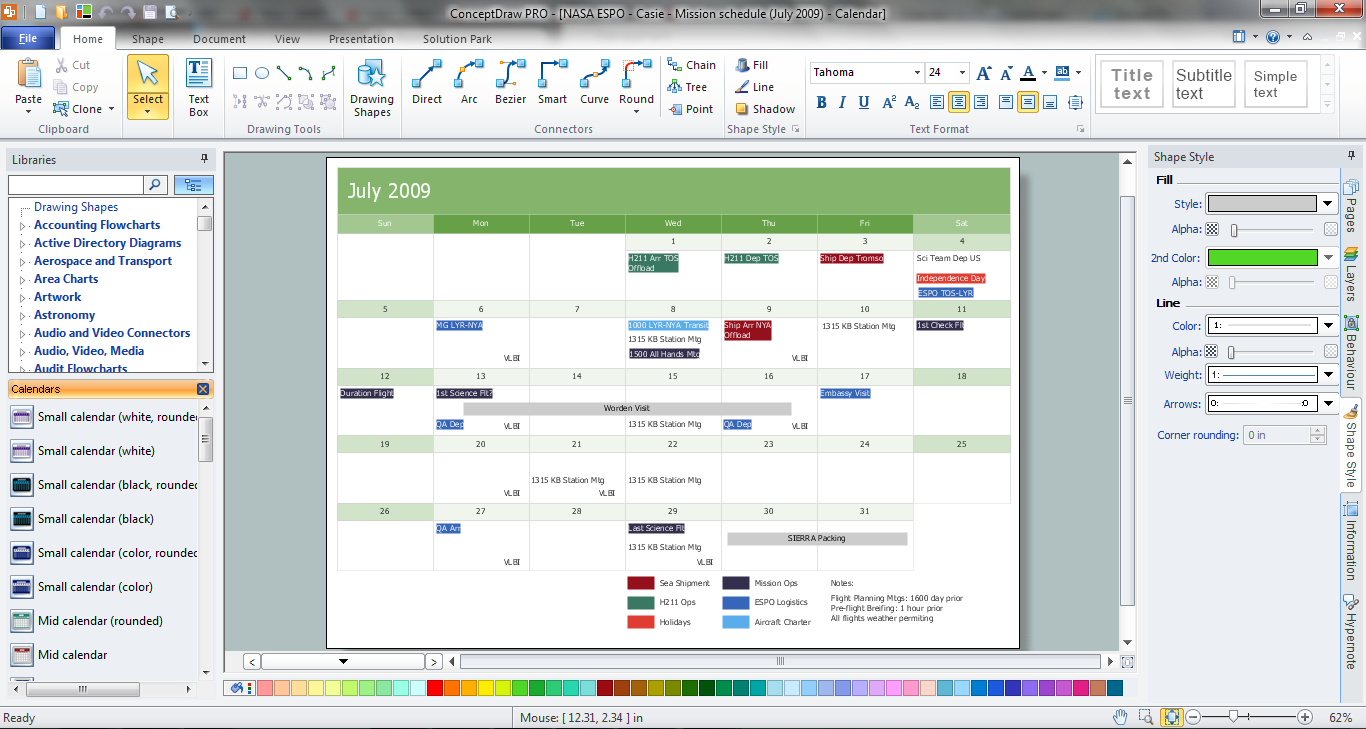
Picture: Economic Calendar
Related Solution:
This action mindmap helps to respond to customer questions related to product or service usage and quality issues, to recommend helpful resources, and to promote support service. The example contains ready to use response phrases organized into a mindmap for quick composing and tweeting/posting of response messages.
Picture: Q&A Quality Issues
Related Solution:
Computer networks nowadays are spread all across the world. The large number of parameters, such as geographic scale or communication protocols, can divide networks. One of the most common types of networks is called local area network (LAN). It convenient to represent network examples by means of diagrams.
This local area network (LAN) diagram provides an easy way to see the way the devices in a local network are interacted. The diagram uses a library containing specific symbols to represent network equipment , media and the end-user devices such as computers (PC, mac, laptop) , network printer, hubs, server and finally a modem. There are two types of network topologies: physical and logical. The current diagram represents precisely a physical type of LAN topology because it refers to the physical layout of a local network equipment.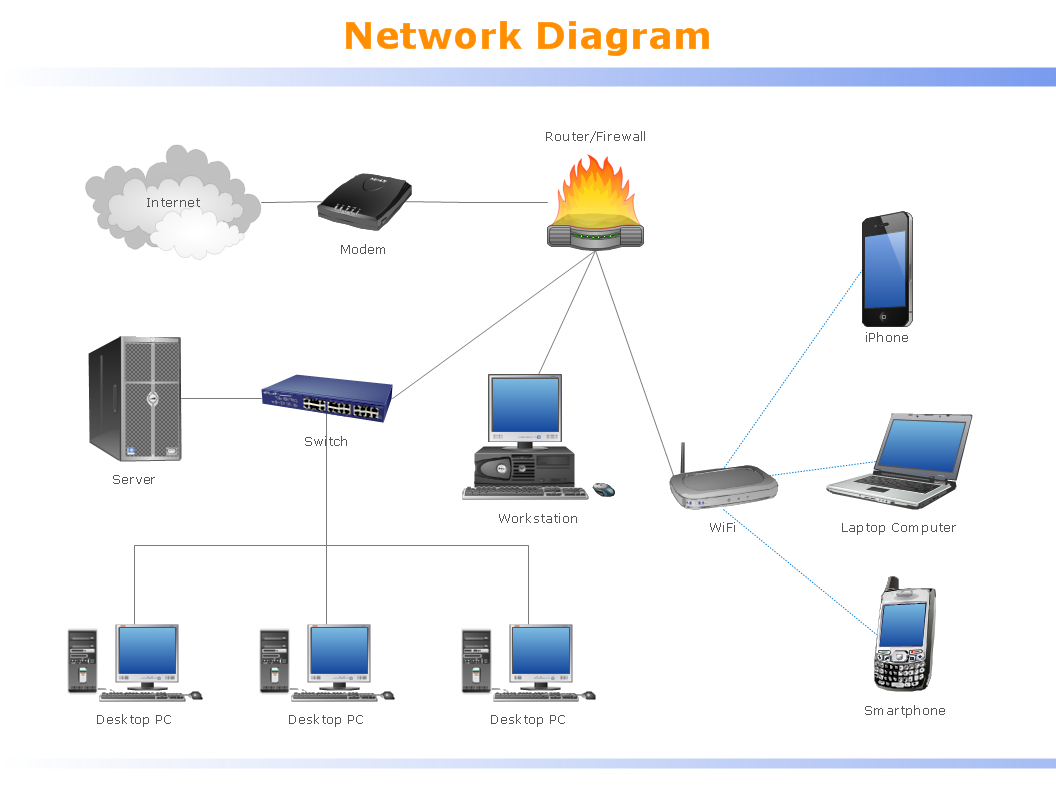
Picture:
What is a Local Area Network?
Examples of LAN Diagrams
Related Solution:
ConceptDraw DIAGRAM diagramming and vector drawing software provides the Telecommunication Network Diagrams Solution from the Computer and Networks Area for quick and easy drawing the Telecommunications Networks.
Picture: Telecommunications Networks
Related Solution: