Pyramid Diagram
Inverted Pyramid
This inverted pyramid diagram of global liquidity shows world GDP and liquidity for 4 levels:
- Derivatives,
- Securitised debt,
- Broad money,
- Power money.
This triangular chart example is included in the Pyramid Diagrams solution from Marketing area of ConceptDraw Solution Park.

Example 1. Pyramid Diagram. Global liquidity inverted pyramid
This inverted triangle diagram was redesigned using ConceptDraw DIAGRAM diagramming and vector drawing software from Wikimedia Commons file The inverted pyramid of global liquidity.gif.
[commons.wikimedia.org/wiki/File:The_inverted_pyramid_of_global_liquidity.gif]
This file is licensed under the Creative Commons Attribution-Share Alike 3.0 Unported license. [creativecommons.org/licenses/by-sa/3.0/deed.en]
See more Pyramid Diagram:
- Zooko Triangle Diagram
- Time, Quality, Money Triangle Diagram
- Project Triangle Diagram
- Purchase Funnel Diagram
- Project Triangle Chart
- Priority Pyramid Diagram
- Organization Triangle Diagram
- Knowledge Triangle Diagram
- Triangular Graphic
- Inverted Pyramid
- Fundraising Pyramid
- 3D Triangle Diagram
- DIKW Pyramid
- Five level pyramid model
- Four level pyramid model
- Three level pyramid model
TEN RELATED HOW TO's:
Any hierarchical structure of any company can be represented as a triangle or a pyramid. You can create a pyramid diagram and pyramid chart of any complexity using special libraries included in ConceptDraw DIAGRAM. Actually, any knowledge or chain of facts can also be depicted as a pyramid.
A wide range of graph and chart are utilized in marketing to maintain documentation and various visual issues, that deal with marketing information and data. The marketing value pyramid can be created to illustrate how the value of company, or product is based on its competitiveness. To design this diagram we used ConceptDraw DIAGRAM drawing tools in conjunction with Pyramid solution for Solution Park.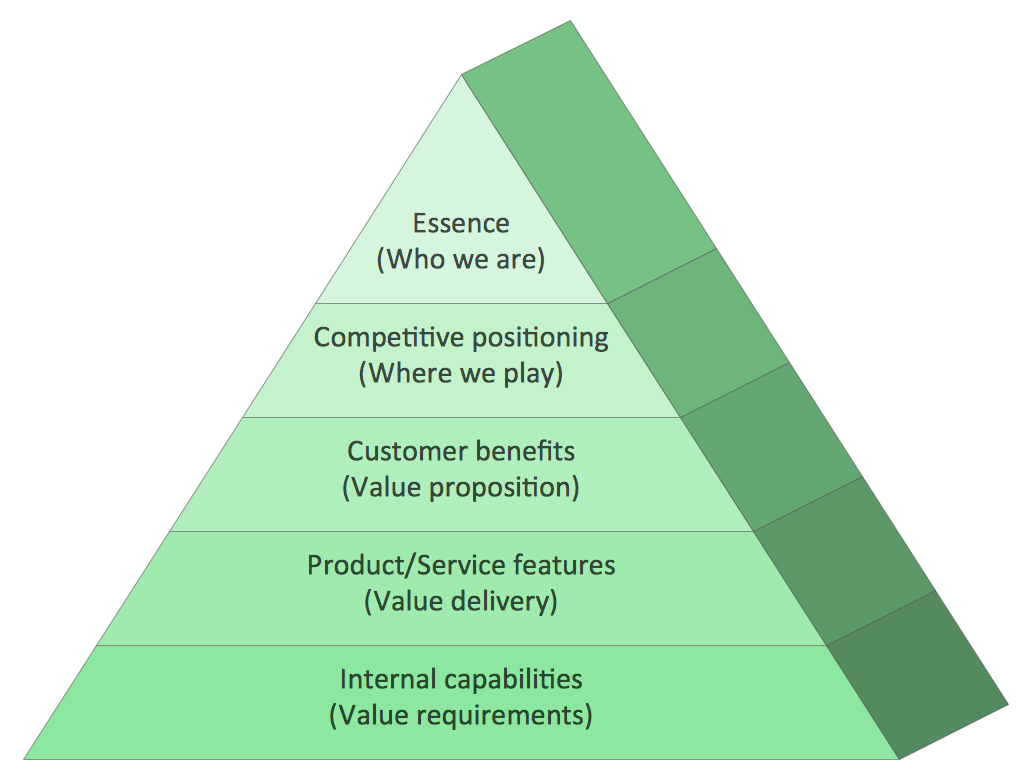
Picture: Pyramid Diagram and Pyramid Chart
Related Solutions:
Collaborative Project Management via Skype is an ideal tool for project teams who need to master a growing project complexity.
Picture: How To Implement Collaborative Project Management
Related Solution:
Business calendar is a special type of calendar, it must be functional, convenient for scheduling the affairs and meetings, and also must have strict, official and unobtrusive interface. So you must pay special attention to the business calendar design. Now you don't need to be an artist to design business calendar thanks to the unique drawing tools of Calendars Solution for ConceptDraw DIAGRAM diagramming and vector drawing software.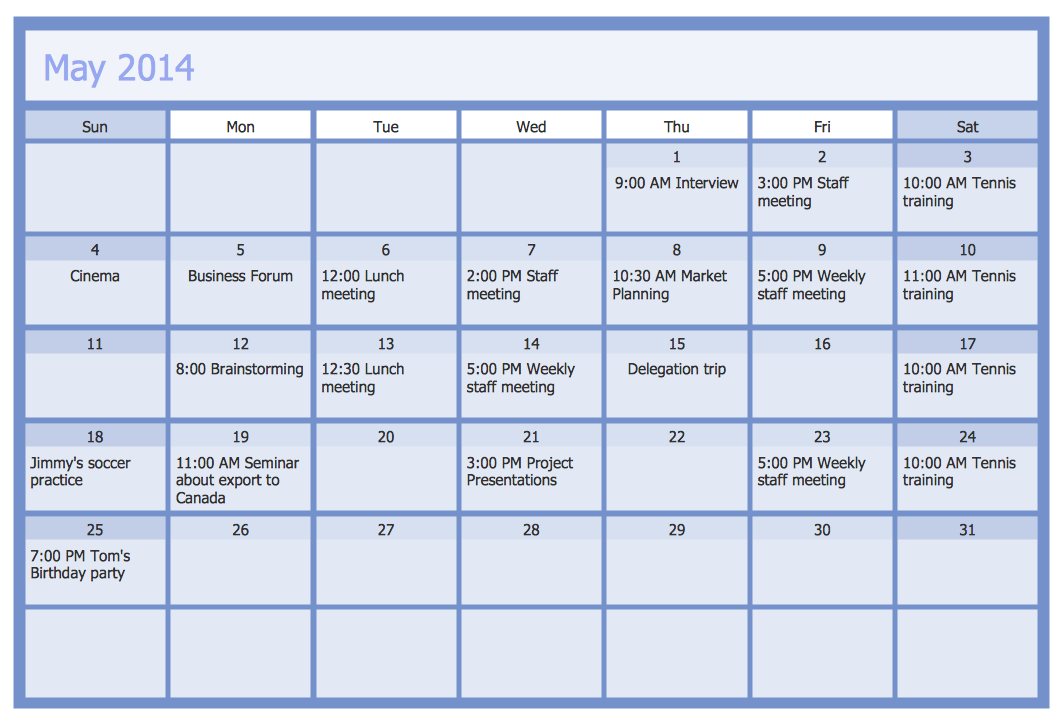
Picture: Business Calendar
Related Solution:
Zooko's triangle is known to be a trilemma which is a concept in international economics which states that it is impossible to have a fixed foreign exchange rate, a free capital movement and an independent monetary policy at the same time.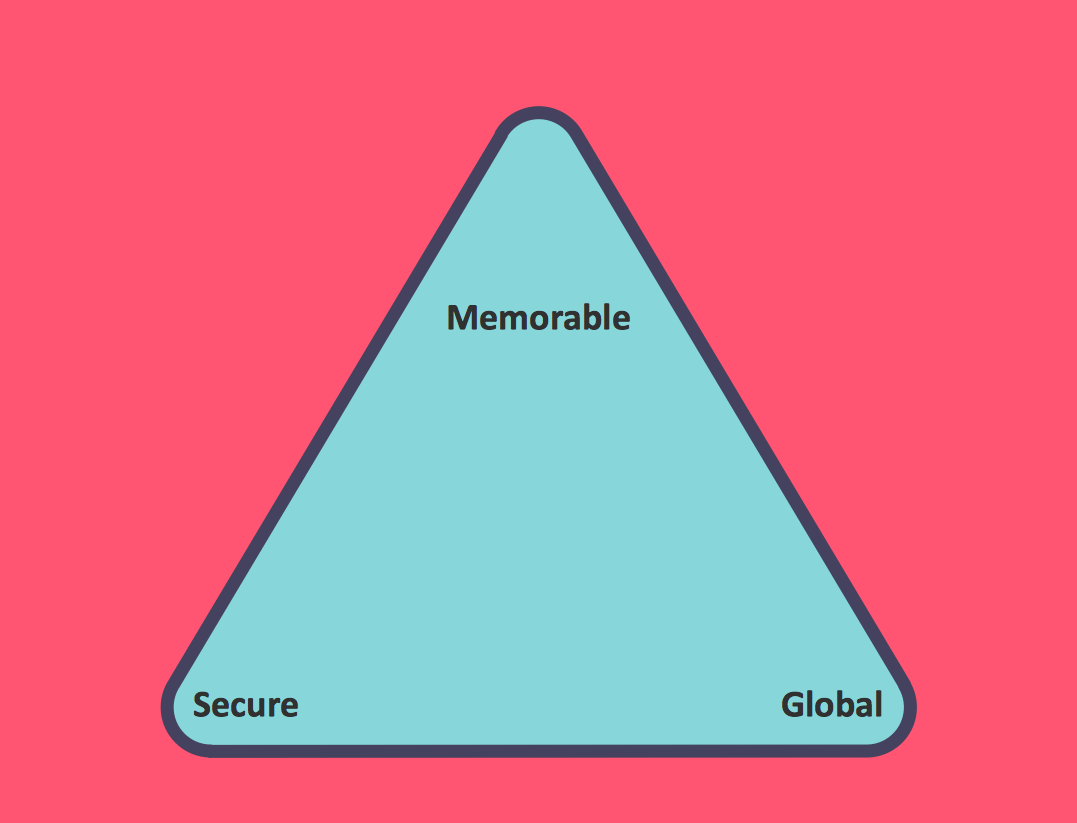
Picture: Pyramid Diagram
Related Solution:
Matrix organizational structure is one of the main forms of structures which is actively used by organizations to carry forth the functions of a company visually and effectively.
Now we have ConceptDraw DIAGRAM diagramming and vector drawing software extended with 25 Typical Orgcharts solution from the Management area of ConceptDraw Solution Park which will help easy represent matrix organizational structure of any degree of complexity.
Picture: Matrix Organization Structure
Related Solution:
Helps to create professionally looking and detailed Sales Flowcharts with all sales steps visually represented on them.
Use the Sales Flowcharts Solution for ConceptDraw DIAGRAM software to create your own Sales Flowcharts of any complexity quickly, easily and effectively to use them successfully in your work activity.
ConceptDraw DIAGRAM diagramming and vector drawing software supplied with unique Sales Flowcharts solution from the Marketing area of ConceptDraw Solution Park allows fast and easy visualize all sales steps of the sales process on a sales process Map or sales process flowchart, and then realize them easily.
Picture: Sales Steps
Related Solution:
This mind map illustrates modern social media approaches to business marketing that can be presented to others using ConceptDraw MINDMAP and the eLearning for Skype solution.
Picture: 125 Ways to Integrate Social Media to Increase Your Business
Related Solution:
When trying to figure out the nature of the problems occurring within a project, there are many ways to develop such understanding. One of the most common ways to document processes for further improvement is to draw a process flowchart, which depicts the activities of the process arranged in sequential order — this is business process management. ConceptDraw DIAGRAM is business process mapping software with impressive range of productivity features for business process management and classic project management. This business process management software is helpful for many purposes from different payment processes, or manufacturing processes to chemical processes. Business process mapping flowcharts helps clarify the actual workflow of different people engaged in the same process. This samples were made with ConceptDraw DIAGRAM — business process mapping software for flowcharting and used as classic visio alternative because its briefly named "visio for mac" and for windows, this sort of software named the business process management tools.
This flowchart diagram shows a process flow of project management. The diagram that is presented here depicts the project life cycle that is basic for the most of project management methods. Breaking a project into phases allows to track it in the proper manner. Through separation on phases, the total workflow of a project is divided into some foreseeable components, thus making it easier to follow the project status. A project life cycle commonly includes: initiation, definition, design, development and implementation phases. Distinguished method to show parallel and interdependent processes, as well as project life cycle relationships. A flowchart diagram is often used as visual guide to project. For instance, it used by marketing project management software for visualizing stages of marketing activities or as project management workflow tools. Created with ConceptDraw DIAGRAM — business process mapping software which is flowcharting visio alternative or shortly its visio for mac, this sort of software platform often named the business process management tools.
Picture: Process Flowchart
Related Solution:
A waterfall model describes software development process as a sequence of phases that flow downwards. SSADM is one of the implementations of waterfall method. It’s easier to learn about structured systems analysis and design method (SSADM) with ConceptDraw DIAGRAM because this software has appropriate tools for creating data flow diagrams. You can use all the three main techniques of SSADM method with special tools and predesigned templates.
This data flow diagram illustrates the Structured Systems Analysis and Design Method. This method method considers analysis, projecting and documenting of information systems. Data flow models are the most important elements of SSADM and data flow diagrams are usually used for their description. It includes the analysis and description of a system as well as visualization of possible issues.
Picture: Structured Systems Analysis and Design Method. SSADM with ConceptDraw DIAGRAM
Related Solution:
ConceptDraw
DIAGRAM 18