Ishikawa Diagram
In almost every sphere of life and work the people time to time are faced with the fact that on their way there are certain obstacles and problems. But it is not always possible to identify the true cause of particular problem. To understand the basic causes of problems and eliminate them, it is convenient to use the chart of Kaoru Ishikawa - the technique specially designed for this.
ConceptDraw DIAGRAM diagramming and vector drawing software extended with Fishbone Diagrams solution from the Management area can help you with construction the Fishbone Diagram also known as Ishikawa Diagram.
Ishikawa Diagram shows factors of
- Equipment,
- Process,
- People,
- Materials,
- Environment
- Management,
all affecting the overall problem in one drawing for the further analysis. It is a well effective way to analyze the business problems you must identify and solve.
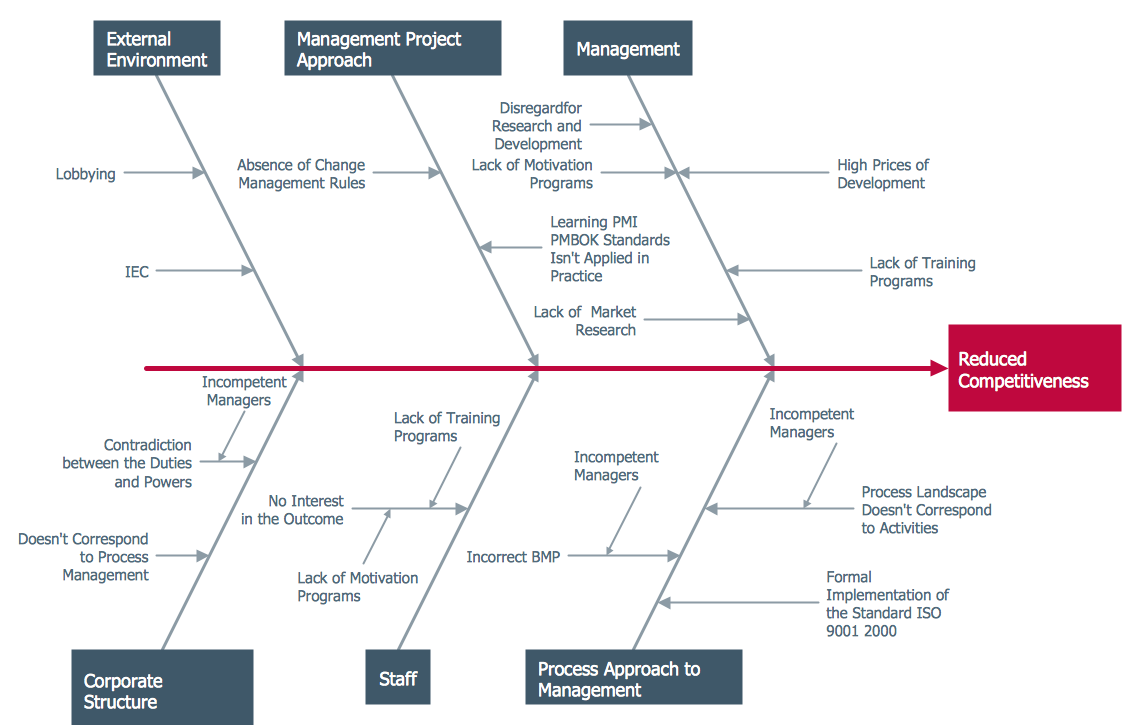
Example 1. Ishikawa Diagram - Factors Reducing Competitiveness
Fishbone Diagrams Solution from ConceptDraw Solution Park contains the Ishikawa Diagram examples, samples and templates which provide quick start to use this graphic method for analysis of problem causes. All they are available from ConceptDraw STORE.

Example 2. Fishbone Diagrams Solution in ConceptDraw STORE
Fishbone Diagrams Solution contains also the Fishbone Diagrams library with variety of predesigned vector symbols. They can help to draw the Ishikawa Diagram of any complexity in minutes.

Example 3. Ishikawa Diagram Symbols
All these design elements are vector objects, you can resize them without loss of quality, change their color to make your Fishbone diagrams more interesting, bright and attractive.

Example 4. Ishikawa Diagram - Fishbone Variance Diagram
The Ishikawa Diagram samples you see on this page were created in ConceptDraw DIAGRAM using the Fishbone Diagrams Solution for ConceptDraw DIAGRAM Solution Park. An experienced user spent 20 minutes creating every of these samples.
Use ConceptDraw DIAGRAM enhanced with Fishbone Diagrams solution to draw your own Ishikawa Diagram for cause and effect analysis.
All source documents are vector graphic documents. They are available for reviewing, modifying, or converting to a variety of formats (PDF file, MS PowerPoint, MS Visio, and many other graphic formats) from the ConceptDraw STORE. The Fishbone Diagrams Solution is available for all ConceptDraw DIAGRAM or later users.
TEN RELATED HOW TO's:
Competitor analysis is a first and obligatory step in elaboration the proper corporate marketing strategy and creating sustainable competitive advantage. Use powerful opportunities of numerous solutions from ConceptDraw Solution Park for designing illustrative diagrams, charts, matrices which are necessary for effective competitor analysis.
Picture: Competitor Analysis
Related Solution:
VSM symbols are the best for a production process designing. The entire Value Stream Mapping method uses a graphical representation of the manufacturing process, factors' pros and cons, that all stakeholders can easily understand. Value Stream Mapping is a graphical technique that provides possibilities to improve analysis of a manufacturing process, at the stage of the transferring information or materials that required to deliver a product or service to the customer.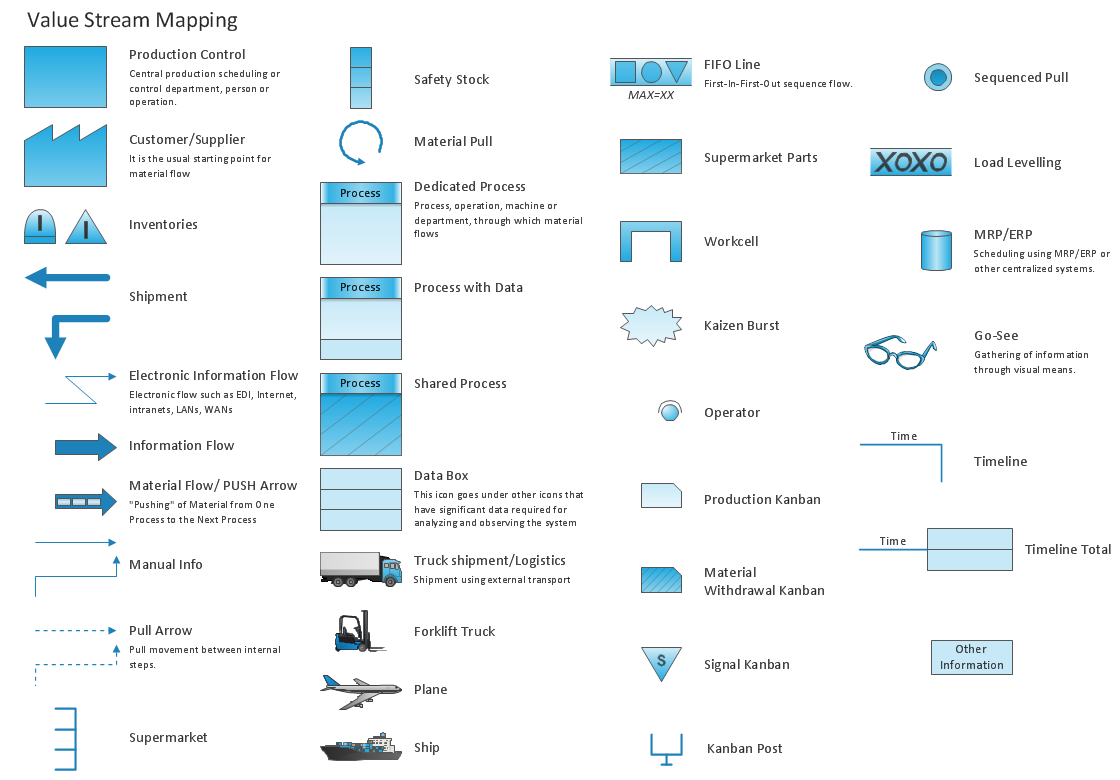
Picture: Value Stream Mapping Symbols
Related Solution:
ConceptDraw Mind maps can be used to depict a quality process.
Picture: Helpful in all stages of quality management
Related Solution:
ConceptDraw DIAGRAM diagramming and vector drawing software enhanced with powerful HR Flowcharts Solution perfectly suits for Human Resource Management.
Picture: Human Resource Management
Related Solution:
An abstract representation is usually the first thing you will need while developing a database. To understand the ways that databases are structured, you should look through entity-relationship diagram examples and see the notations features and attributes. With an entity-relationship model you can describe a database of any complexity.
This Entity-relationship diagram is a tool for software developers. It enables every element of database to be managed, communicated and tested before release. This ERD was created using symbols advocated by Chen's notation. Because of a linguistic origin of the Chen’s notation, the boxes representing entities could be interpreted as nouns, and the relationships between them are in verb form, shown on a diagram as a diamond.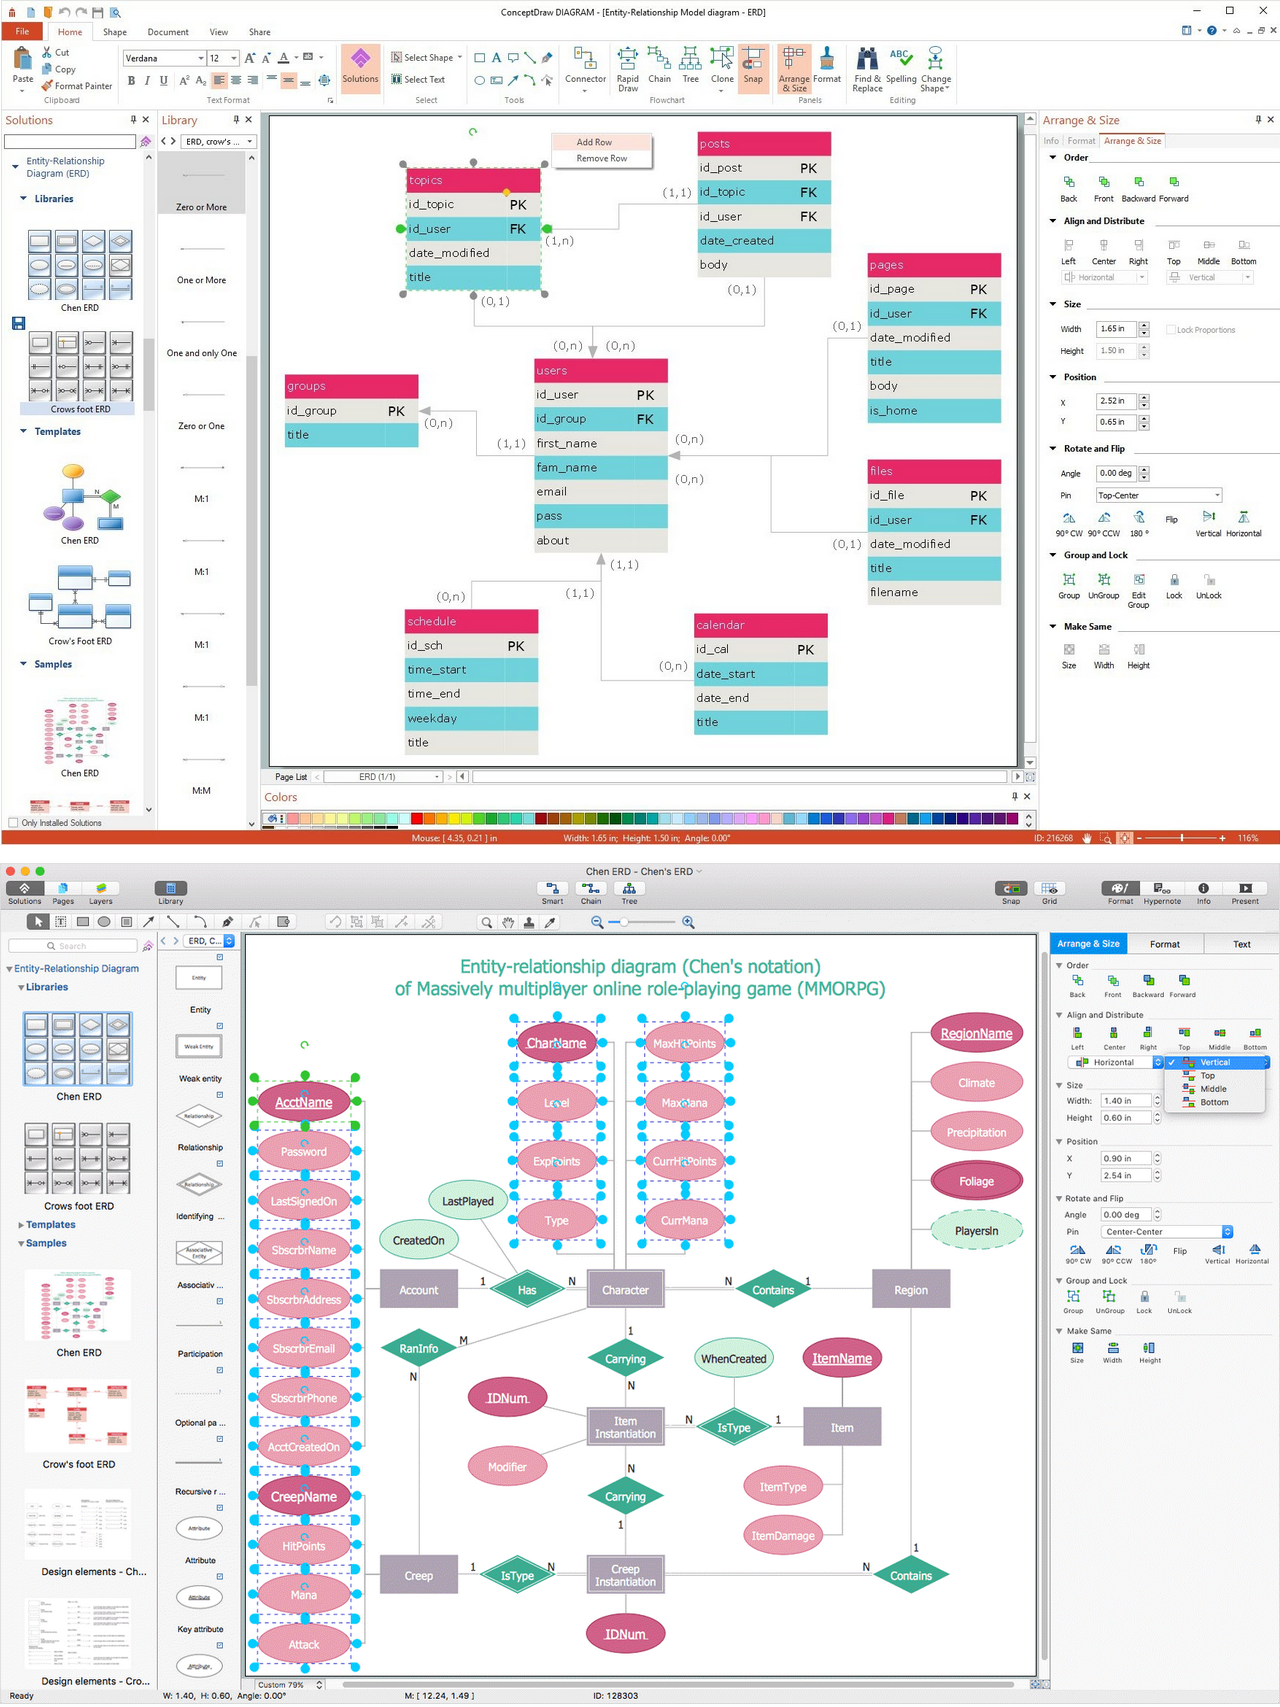
Picture: Entity Relationship Diagram Examples
Related Solution:
TOWS Matrix is an effective tool which allows to analize the external opportunities and threats by means of analyzing the internal strengths and weaknesses of a company. ConceptDraw DIAGRAM diagramming and vector drawing software extended with SWOT and TOWS Matrix Diagrams Solution from the Management Area will help design TOWS Matrix for your company without efforts.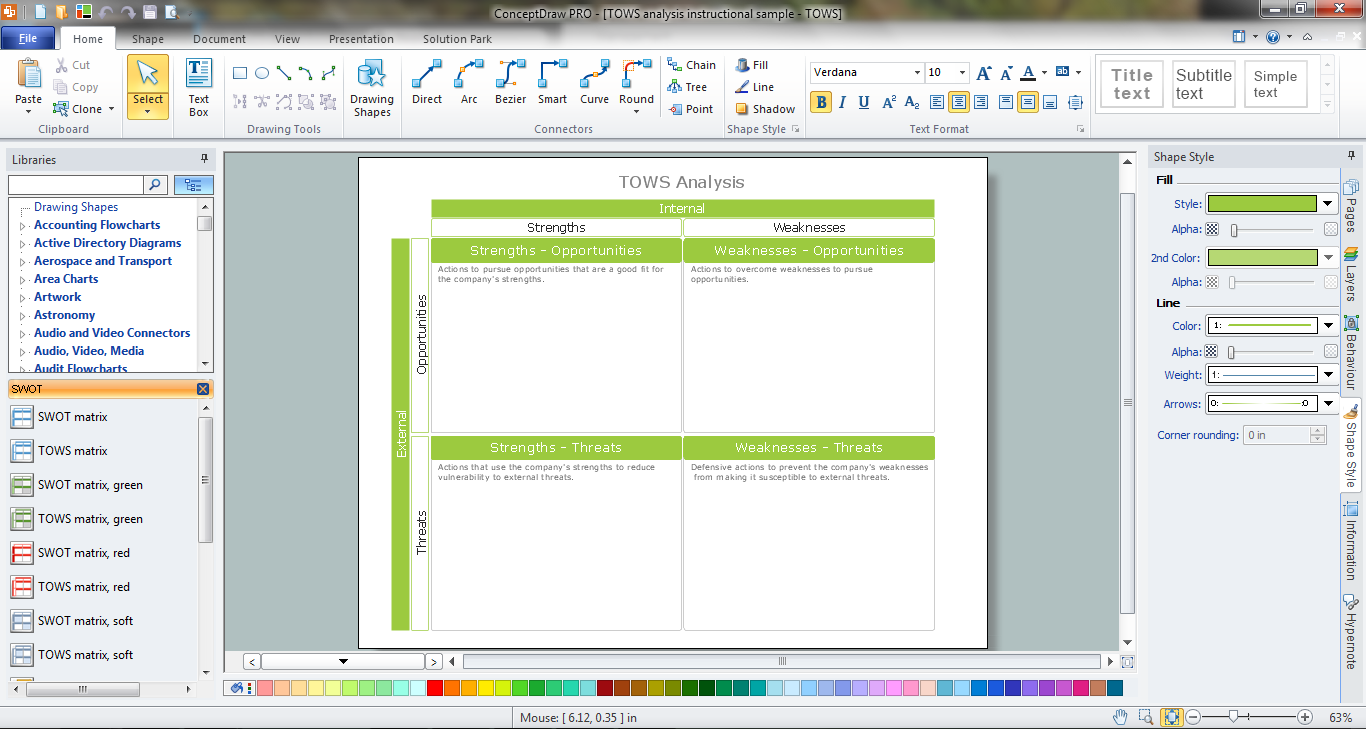
Picture: TOWS Matrix
Related Solution:
Value Stream Mapping solution extends ConceptDraw DIAGRAM software with templates, samples and vector shapes for drawing the current state value stream maps.
Picture: Learn how to create a current state value stream map
Related Solution:
The Value Stream Map is one of the key tools of lean practitioners. It helps aptly describe the manufacturing processes both complex and simple. It supports process improvement, allows identifying waste, and reducing process cycle times. Use ConceptDraw DIAGRAM extended with Value Stream Mapping solution to document processes starting with a professionally designed Value Stream Mapping template.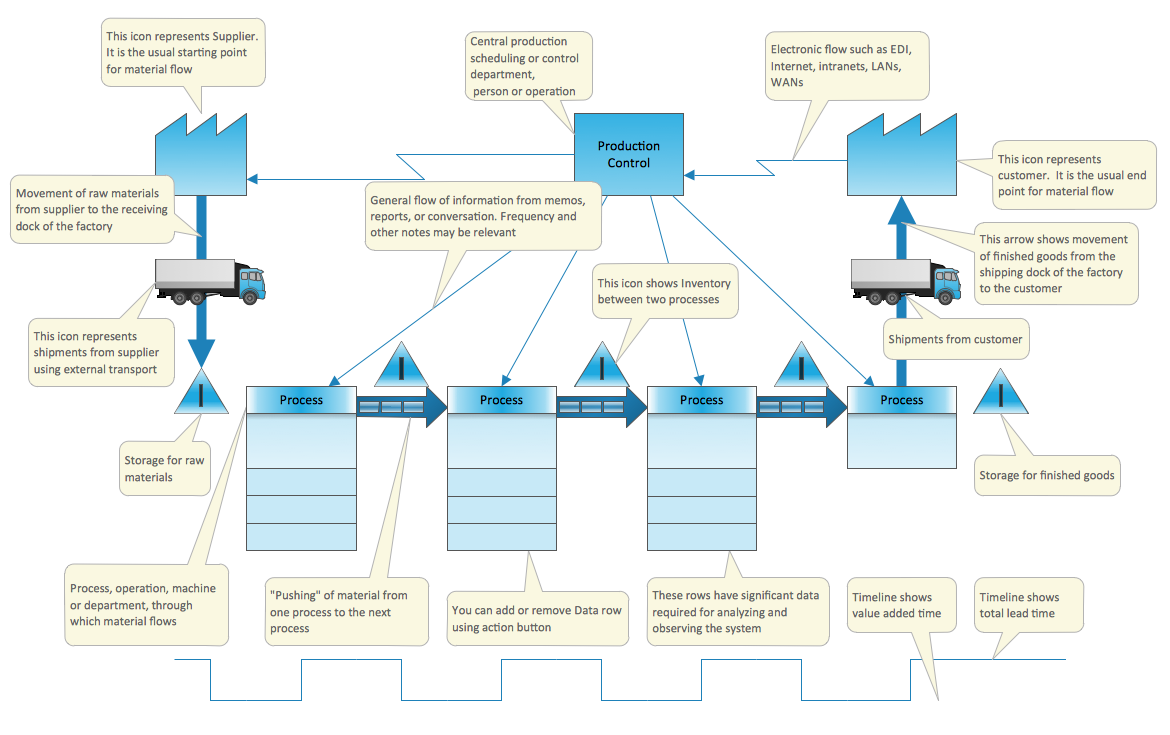
Picture: Value Stream Mapping Template
Related Solution:
The Venn diagram example below shows sustainable development at the confluence of three constituent parts.
Create your Venn diagrams for problem solving in environmental social science using the ConceptDraw DIAGRAM software.
Picture:
Venn Diagram Examples for Problem Solving
Environmental Social Science
Human Sustainability Confluence
Related Solution:
ConceptDraw DIAGRAM software extended with Workflow Diagrams solution ideally suits for effective business process optimization, for determination the opportunities for improvements and enhancements the processes, cost reduction and cost savings.
Picture: Business Process Optimization
Related Solution:


