Kaizen Process Map
Kaizen is translated from Japanese as “continuous improvement”. It is one of the approaches to improve the organization's performance and a customer-oriented improvement strategy. Kaizen philosophy was first applied in a number of Japanese companies during the post-World War II recovery period. Since then, it spread around the world.
Kaizen is a philosophy and mindset encouraging improvements every day and everywhere. It is focused on small but constant changes and improvements in current work processes in order to improve all functions of a business. These improvements involve all levels in an organization, strive to make all processes more efficient. Over time this approach delivers significant results. The main purpose of Kaizen is production without losses. In addition, Kaizen implementation requires relatively small material costs.
Kaizen philosophy assumes the following: our life as a whole should be focused on continuous improvement of working methods, business processes in production, development, management, and personal efficiency. The application of Kaizen principles contributes to the development and achievement success in both professional and personal life. The sudden great changes often frighten people and cause a negative brain reaction and this can have adverse consequences. At the same time, small changes stimulate rational and creative thinking and development.
Kaizen methodology is based on the principles of personal discipline and self-improvement, customer focus, open recognition of problems, teamwork, improved morale. The formation of supportive relationships, awareness of the significance of each employee, and transfer of a certain amount of authority to each one are also among the key principles. Kaizen is a methodology realized at the great involvement of employees and contributes to their permanent self-improvement. In fact, the involvement of employees in the project has an incredible impact on the success and progress of all business processes.
According to the goal, Kaizen's introduction is realized on different levels at the company: within a team, company-wide, or personally. The method also involves comparing the plan with the result and analyzing what is happening. It assumes detecting the causes when the problems occur and eliminating these causes. Kaizen comes from the simple fact — there is no enterprise without problems and helps to solve these problems. In fact, regardless of the current state, it is suggested the following truth: perfection is unattainable and there are always ways to improve processes more and more.
Kaizen methodology is also useful for visualization processes and documenting the business work from the top-down. Each organization is based on the business model with processes. And the better you understand these processes, their functions, and their influence on the system, the more effective your organization will develop. The visualization is one of the tools helpful in understanding the business processes of an organization, detecting problems, and improving processes.
Use the idea of Kaizen continuous improvement in your company, build and visualize the business processes effectively. Design Kaizen Process Map using the ConceptDraw DIAGRAM vector diagramming software and Classic Business Process Modeling solution fast and simply. These diagrams will be helpful to detect the waste in your company and further improve the business processes.
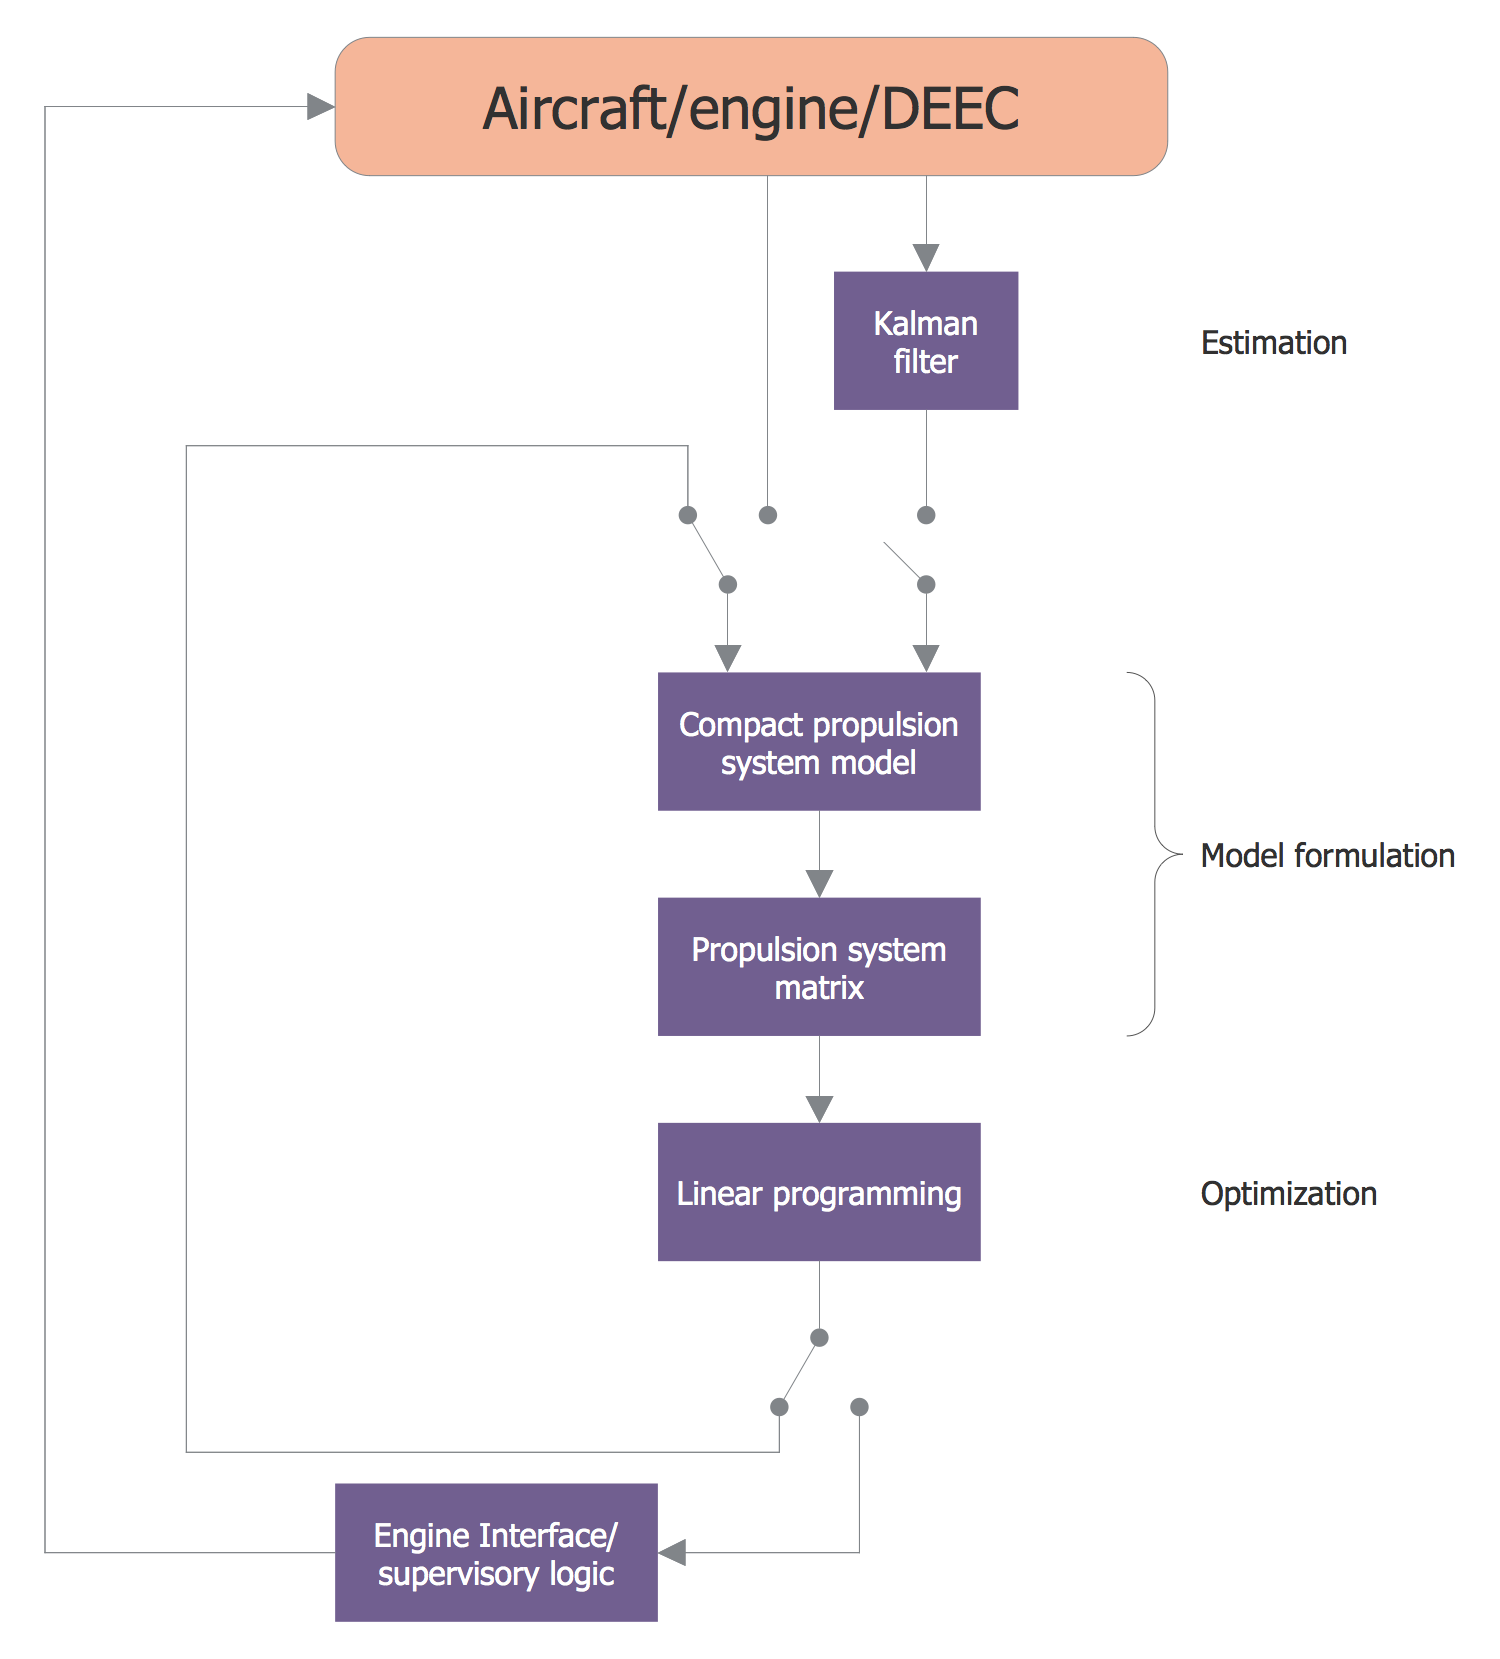
Example 1. Kaizen Process Map Design in ConceptDraw DIAGRAM
Classic Business Process Modeling solution includes a great number of ready-made vector objects and samples to easier the process of drawing the Business Process Models. Use design elements — Data Flow Diagram, Functional Flow Block Diagram, Control Flow Diagram, Flow Chart, Swimlane Diagram to illustrate the business processes of your company. Apply Kaizen methodology in order to optimize the processes and improve your business.
The sample you see on this page was created in ConceptDraw DIAGRAM software using the tools of Classic Business Process Modeling Solution. This sample was included in the Classic Business Process Modeling Solution and is available from ConceptDraw STORE. An experienced user spent 10 minutes creating this sample.
Use the Classic Business Process Modeling Solution for ConceptDraw DIAGRAM software to design your own Kaizen Process Maps fast, simply, and effectively.
All source documents are vector graphic documents. They are available for reviewing, modifying, or converting to a variety of formats (PDF file, MS PowerPoint, MS Visio, and many graphic formats) from the ConceptDraw STORE. The Classic Business Process Modeling Solution is available for all ConceptDraw DIAGRAM users.
TEN RELATED HOW TO's:
Accounting is a cornerstone of any business, it’s basement. If you want to have a visual representation of your finance management, use audit flowchart symbols to document the money flow. Although some would say that accounting is boring, it is very a responsible duty.
The audit flowchart symbols is supplied with ConceptDraw Audit Flowcharts solution as a vector objects library. Together with Conceptdraw Drawing capabilities it forms the helpful tool for audit process planning and setting the steps of audit by designing audit flow charts. Audit Flow charts are used to organize fiscal information tracking process as well as in accounting, finance and investment management.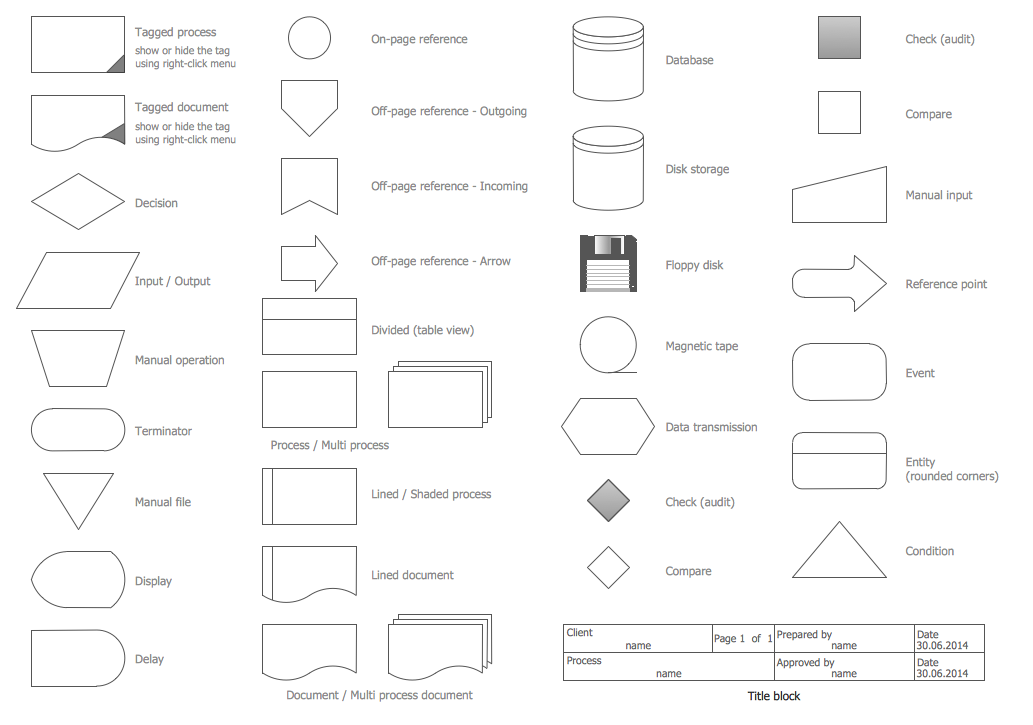
Picture: Audit Flowchart Symbols
Related Solution:
Data structure diagram (DSD) is intended for description of conceptual models of data (concepts and connections between them) in the graphic format for more obviousness. Data structure diagram includes entities description, connections between them and obligatory conditions and requirements which connect them. Create Data structure diagram with ConceptDraw DIAGRAM.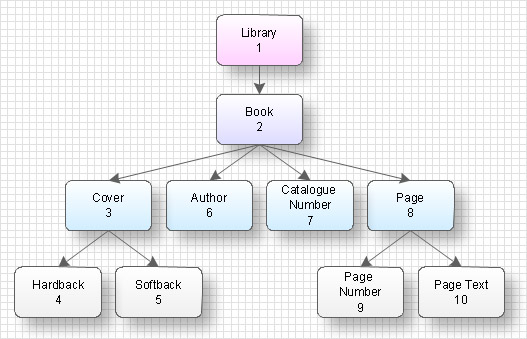
Picture: Data structure diagram with ConceptDraw DIAGRAM
Diagramming is an astonishing way to visualize business processes. The list of the most common business process flowchart symbols is quite long starting from basic flowcharts, continuing with SIPOC diagrams. Business process modeling was never easier than now, with special ConceptDraw Business Process Mapping solution.
To carry out all professional standard requirements for business processes mapping, it is necessarily to follow the special graphical notations. ConceptDraw Business Process Mapping solution offers an exhaustive suite of tools to aid business process mapping. There are three vector libraries SIPOC Diagrams, Business Process Flowcharts, and Swim Lanes that contains totally more than 50 symbols of standard BPM notations. This is all that professionals need to effectively evaluate and manage quality in business processes.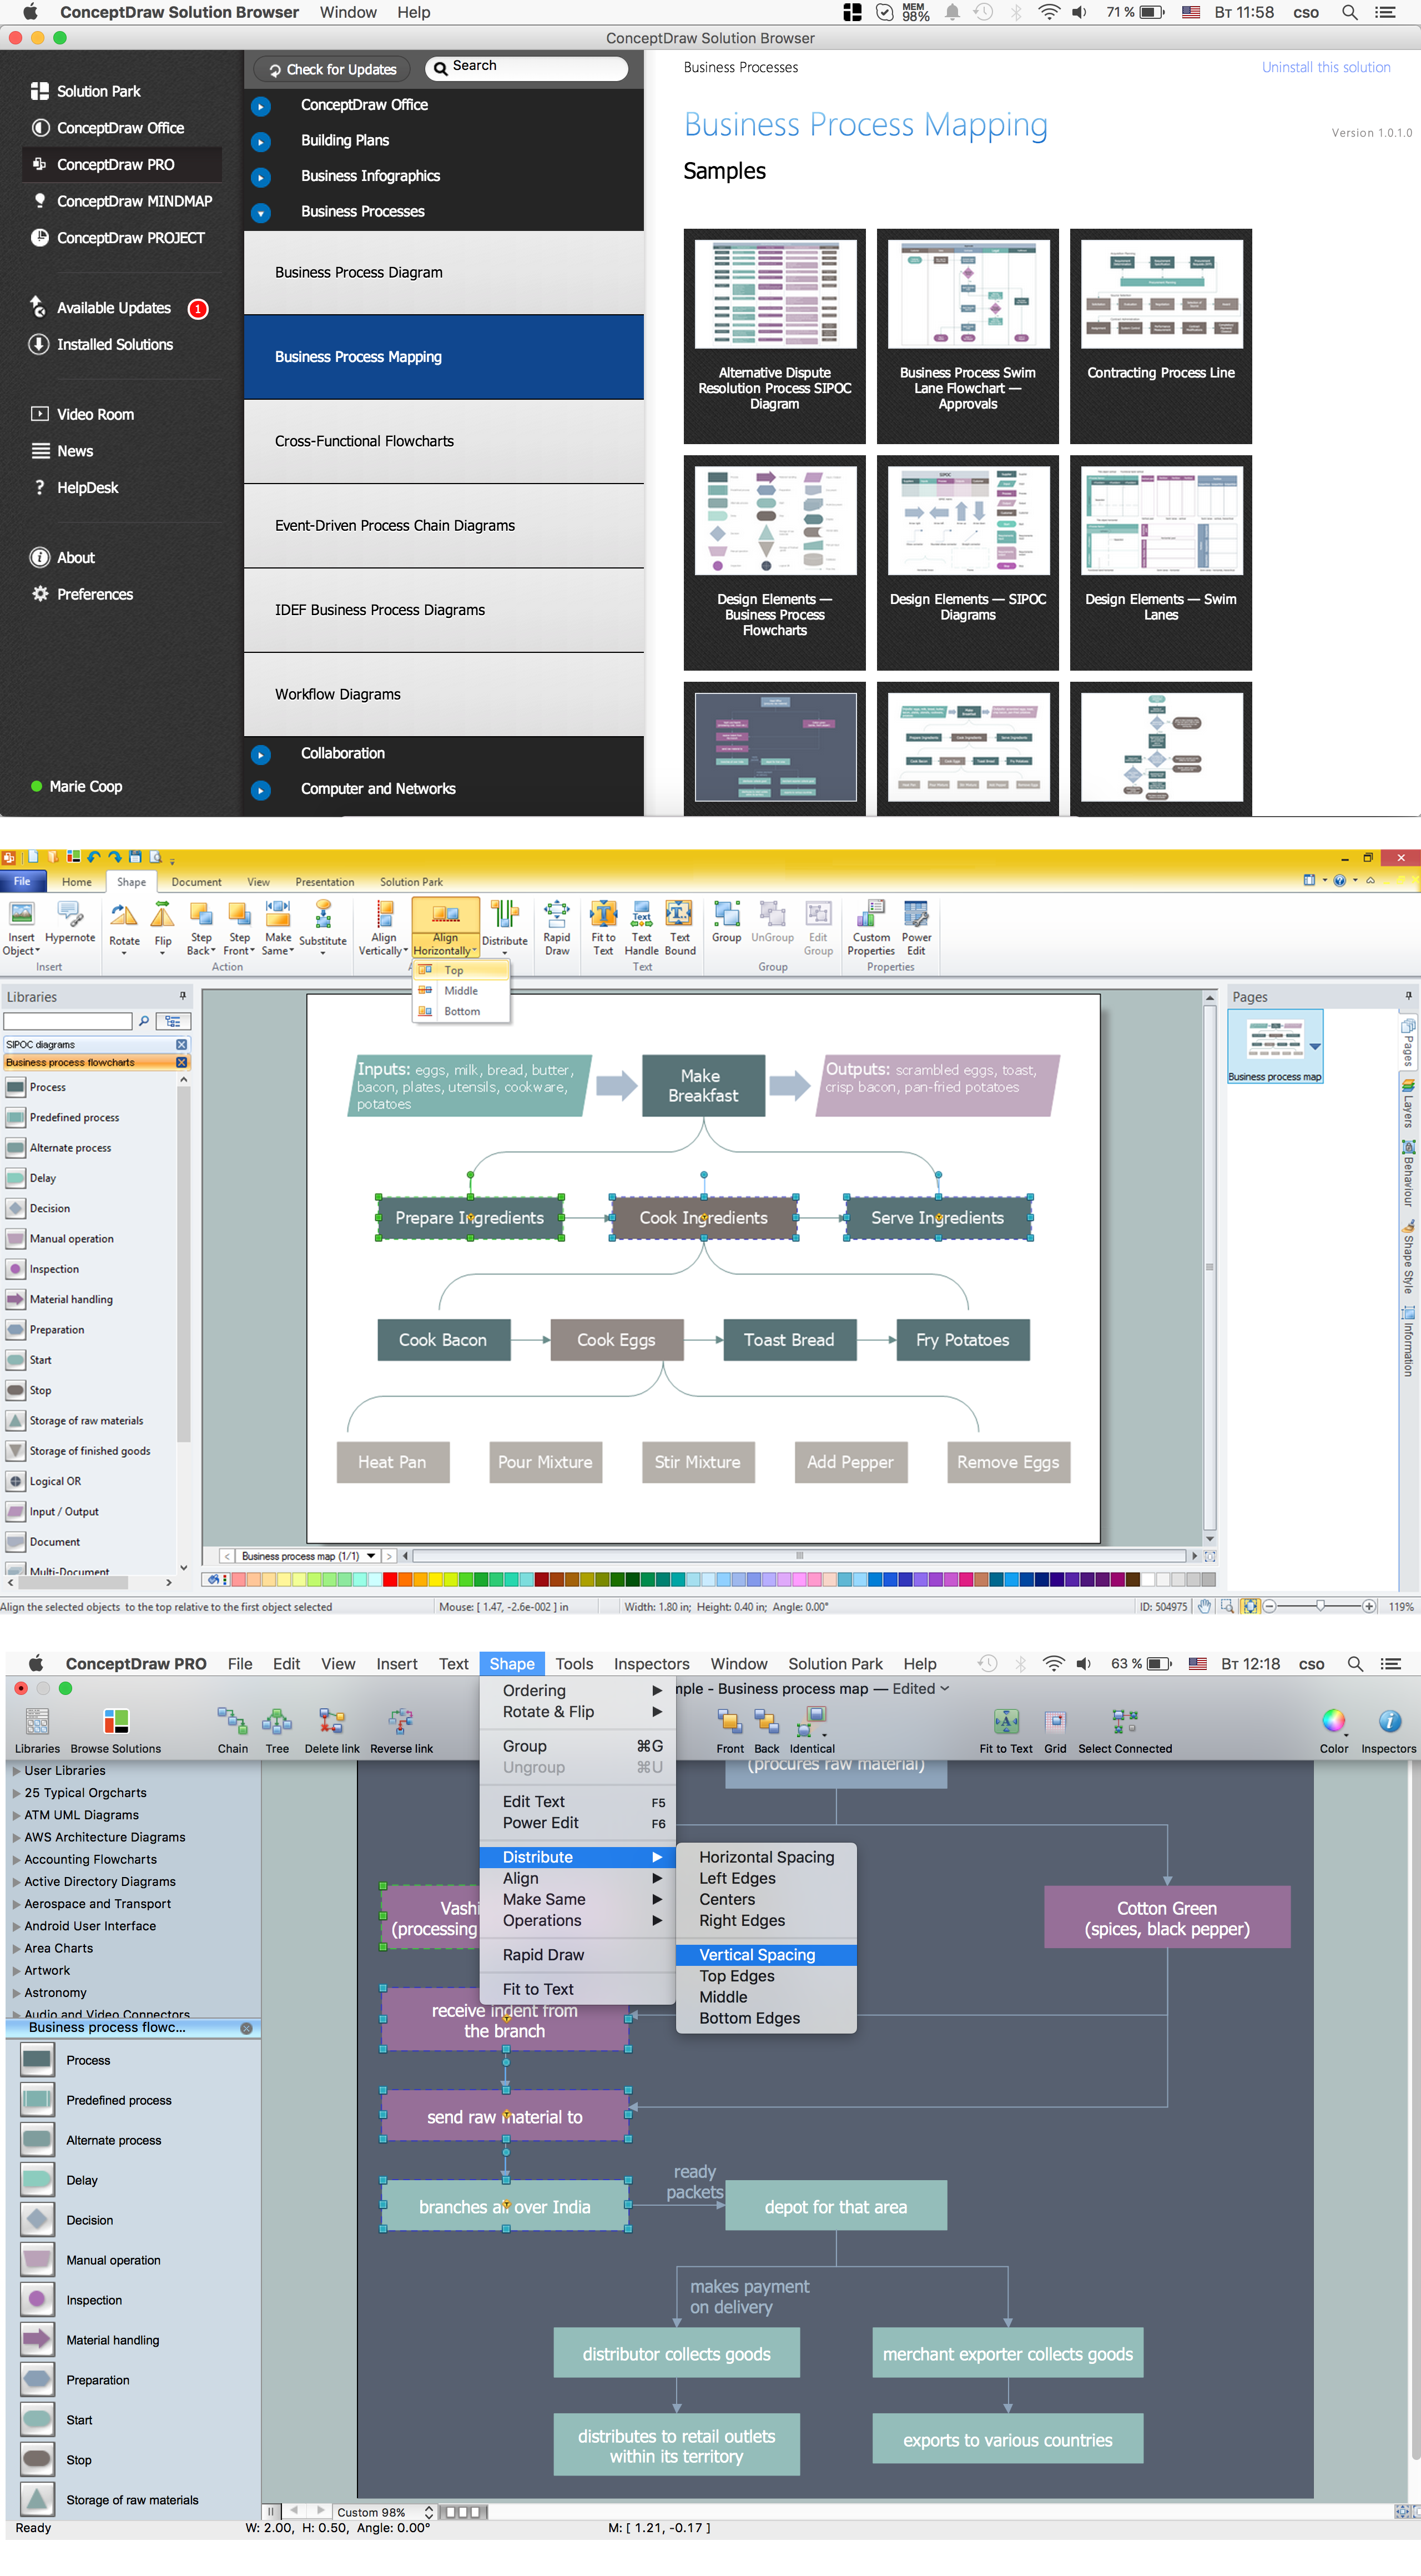
Picture: Business Process Flowchart Symbols
Related Solution:
If you need to describe some process, diagramming is a perfect tool for almost any imaginable purpose. The set of the most commonly used flow charts symbols is quite wide and includes symbols for operations, processes, data inputs and outputs. You can see the full list of all the symbols used for flowcharting in Flowcharts solution from Diagrams area in ConceptDraw Solution Park.
A flow chart is often used for visual representation of a sequential process flow. The flowchart approach to any process is to divide it into some sequential actions. What makes a flow chart so popular and clear to make out is the set of standard flowchart symbols that has the same reading independently from processes described with their applying. The current drawing represents the vector library containing the pack of standard flowchart symbols. This library is supplied with ConceptDraw Flowcharts solution.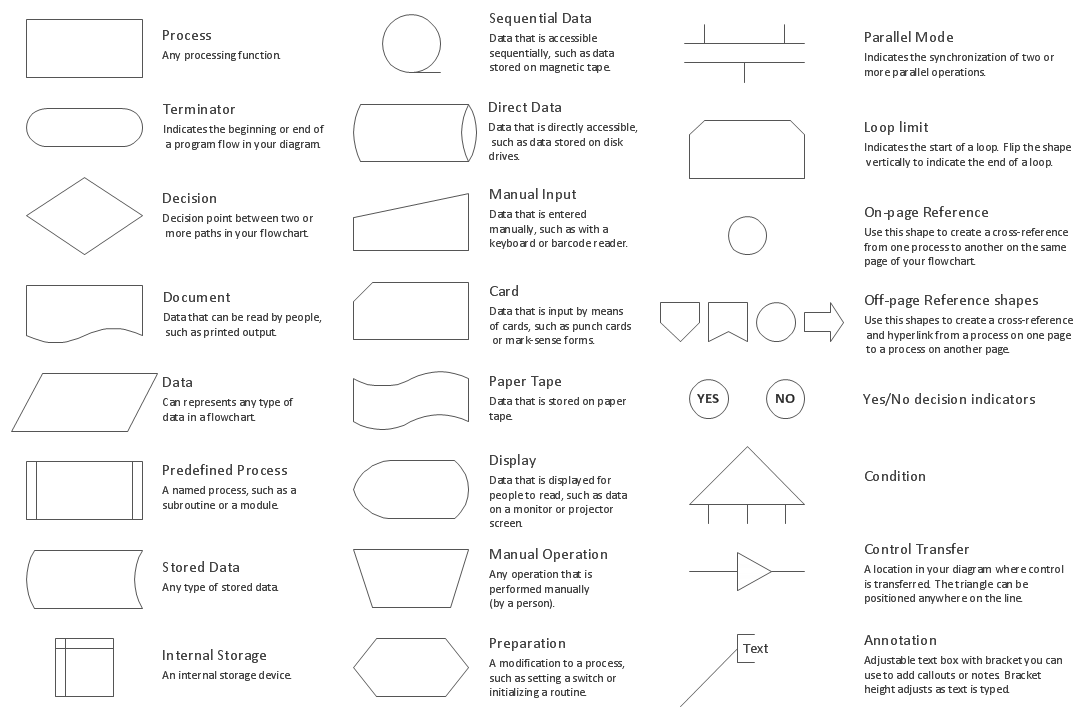
Picture: Flow Chart Symbols
Related Solution:
A flowchart is a simple but very functional tool when it comes to understanding a workflow or to removing unnecessary stages from a process. When drawing flowcharts, keep in mind that there are four common types of flowcharts, like document flowcharts and data flowcharts that show control over a data or document flow over a system. To show controls on a physical level, use system flowcharts. In addition, to show controls in a program, you can draw a program flowchart.
This flowchart diagram represents the piece of an article editing process, that involves the author and editor. It was created using the Basic Flowchart notation that consists from the basic flowchart symbols. The start and the end of the process are indicated with "Terminator" symbols. The "Process" symbols show the action steps consisting from making edits and searching for a compromise, when the author does not agree with the suggestions of the editor. The "Process" symbol is the general symbol in process flowcharts. The "Decision" symbol indicates a branching in the process flow. There are two branches indicated by a Decision shape in the current flowchart (Yes/No, Disagree/Agree). This basic flowchart can be used as a repeating unit in the workflow diagram describing the working process of some editorial office.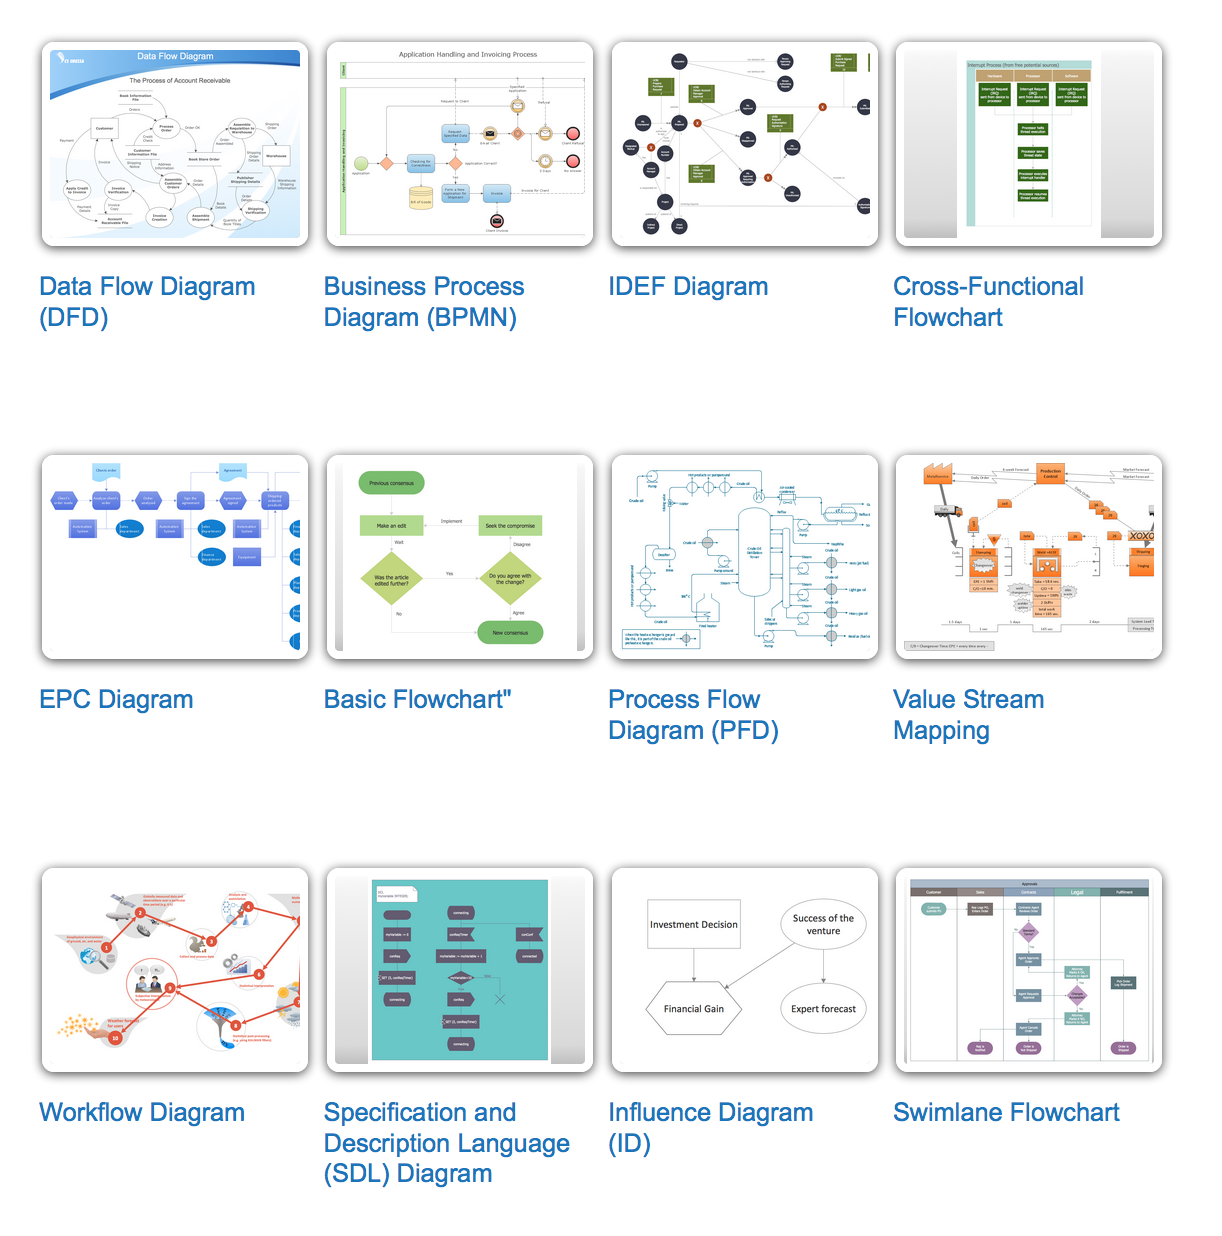
Picture: Types of Flowcharts
Related Solution:
Use ConceptDraw DIAGRAM diagramming and business graphics software to draw your own flowcharts of computer algorithms.
Picture: Process Flow app for macOS
Related Solution:
The ConceptDraw Flowchart component includes a set of samples and templates. This geathered as flowchart maker toolbox which focused on drawing flowcharts of any industry standards.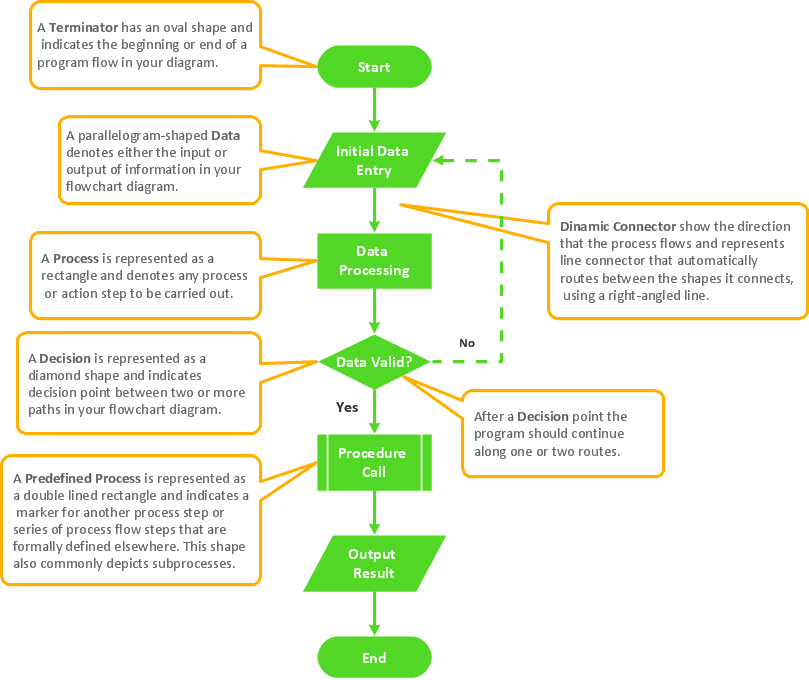
Picture: Flowchart Components
Related Solution:
Data flow diagrams are the graphical tool, used in the visualization of data flow of some data processing systems. It is the valuable process modeling tool. Also designing DFD is the important component of the initial part of any information system development project. The standard symbols are used to represent the interaction of a system components and how various kinds of components influence on data flow. The ConceptDraw Data Flow Diagrams solution is design to assist professional software engineers in making DFDs according to Gane and Sarson, and Yourdon and Coad notations.
Do you imagine yourself as a successful IT specialist? To your mind, they all use data flow diagram examples to learn and to get inspired. Aren’t you still with us?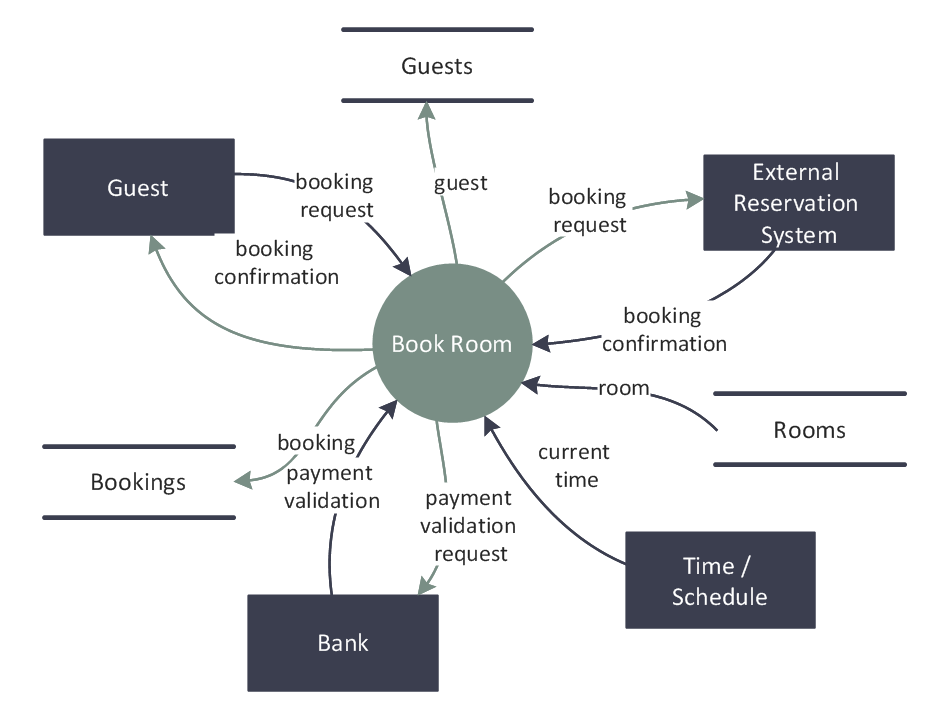
Picture: Data Flow Diagram Examples
Related Solution:
ConceptDraw DIAGRAM is a world-class diagramming platform that lets you display, communicate, and present dynamically. It′s powerful enough to draw everything from basic flowcharts to complex engineering schematics.
Video tutorials on ConceptDraw products. Try it today!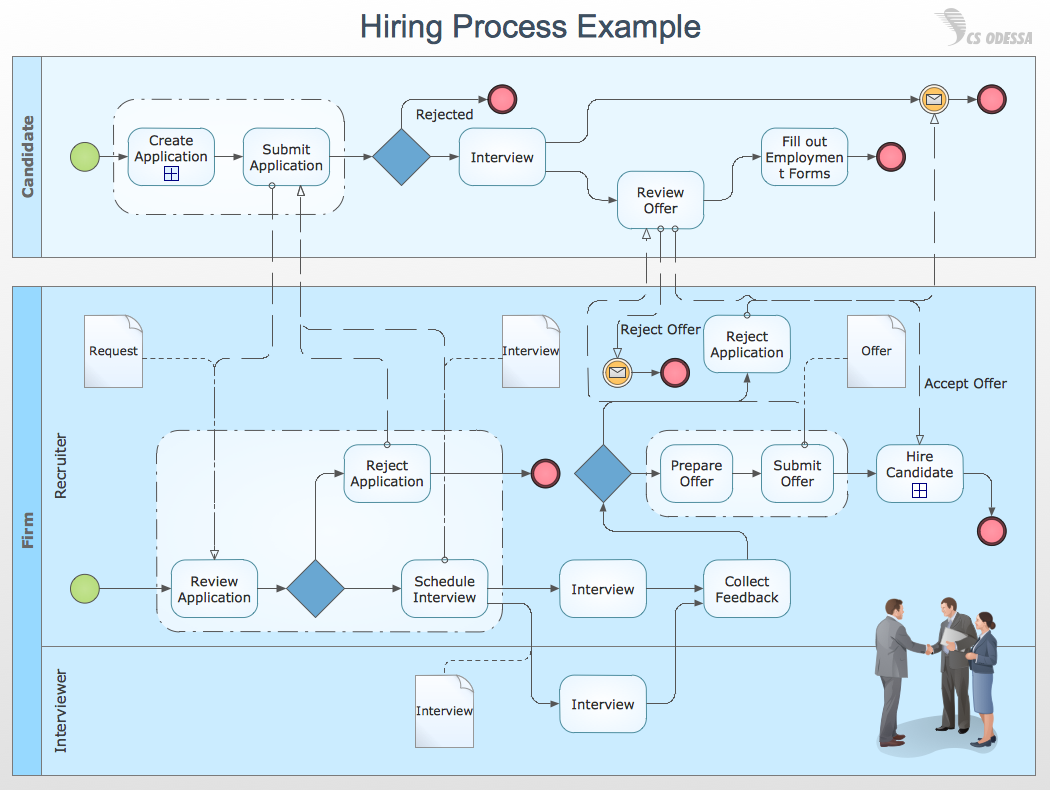
Picture: Business Process Mapping — How to Map a Work Process
Related Solutions:
Event-Driven Process Chain Diagrams for improvement throughout an organisation.
ConceptDraw DIAGRAM - software that reduces the time needed to create a business process model.
Picture: Graphical Symbols to use in EPC diagrams
Related Solution:


