Lean Manufacturing
Lean manufacturing or lean production is a concept of organization's management which is based on the constant effort to eliminate all kinds of losses. Lean manufacturing requires involvement of each employee in the process of business optimization and maximum customer orientation.
The main principles of the lean manufacturing concept are evaluation of the value of product for the final consumer at each stage of its creation, and also creation of a continuous process of eliminating waste - the elimination of any actions that consume resources but create no value for the end user. As a synonym for the concept of loss sometimes is used the term from the Toyota's production system — "muda" which meaning all sorts of costs, losses, waste, garbage.
According to the lean manufacturing concept, all company activities are divided on the operations and processes that add value for the consumer, and the operations and processes that don't add value for the consumer. The objective of lean manufacturing is the systematic reduction of the processes and operations which don't add value.
ConceptDraw DIAGRAM diagramming and vector drawing software enhanced with Value Stream Mapping solution from the Quality area of ConceptDraw Solution Park is perfect for the lean manufacturing.
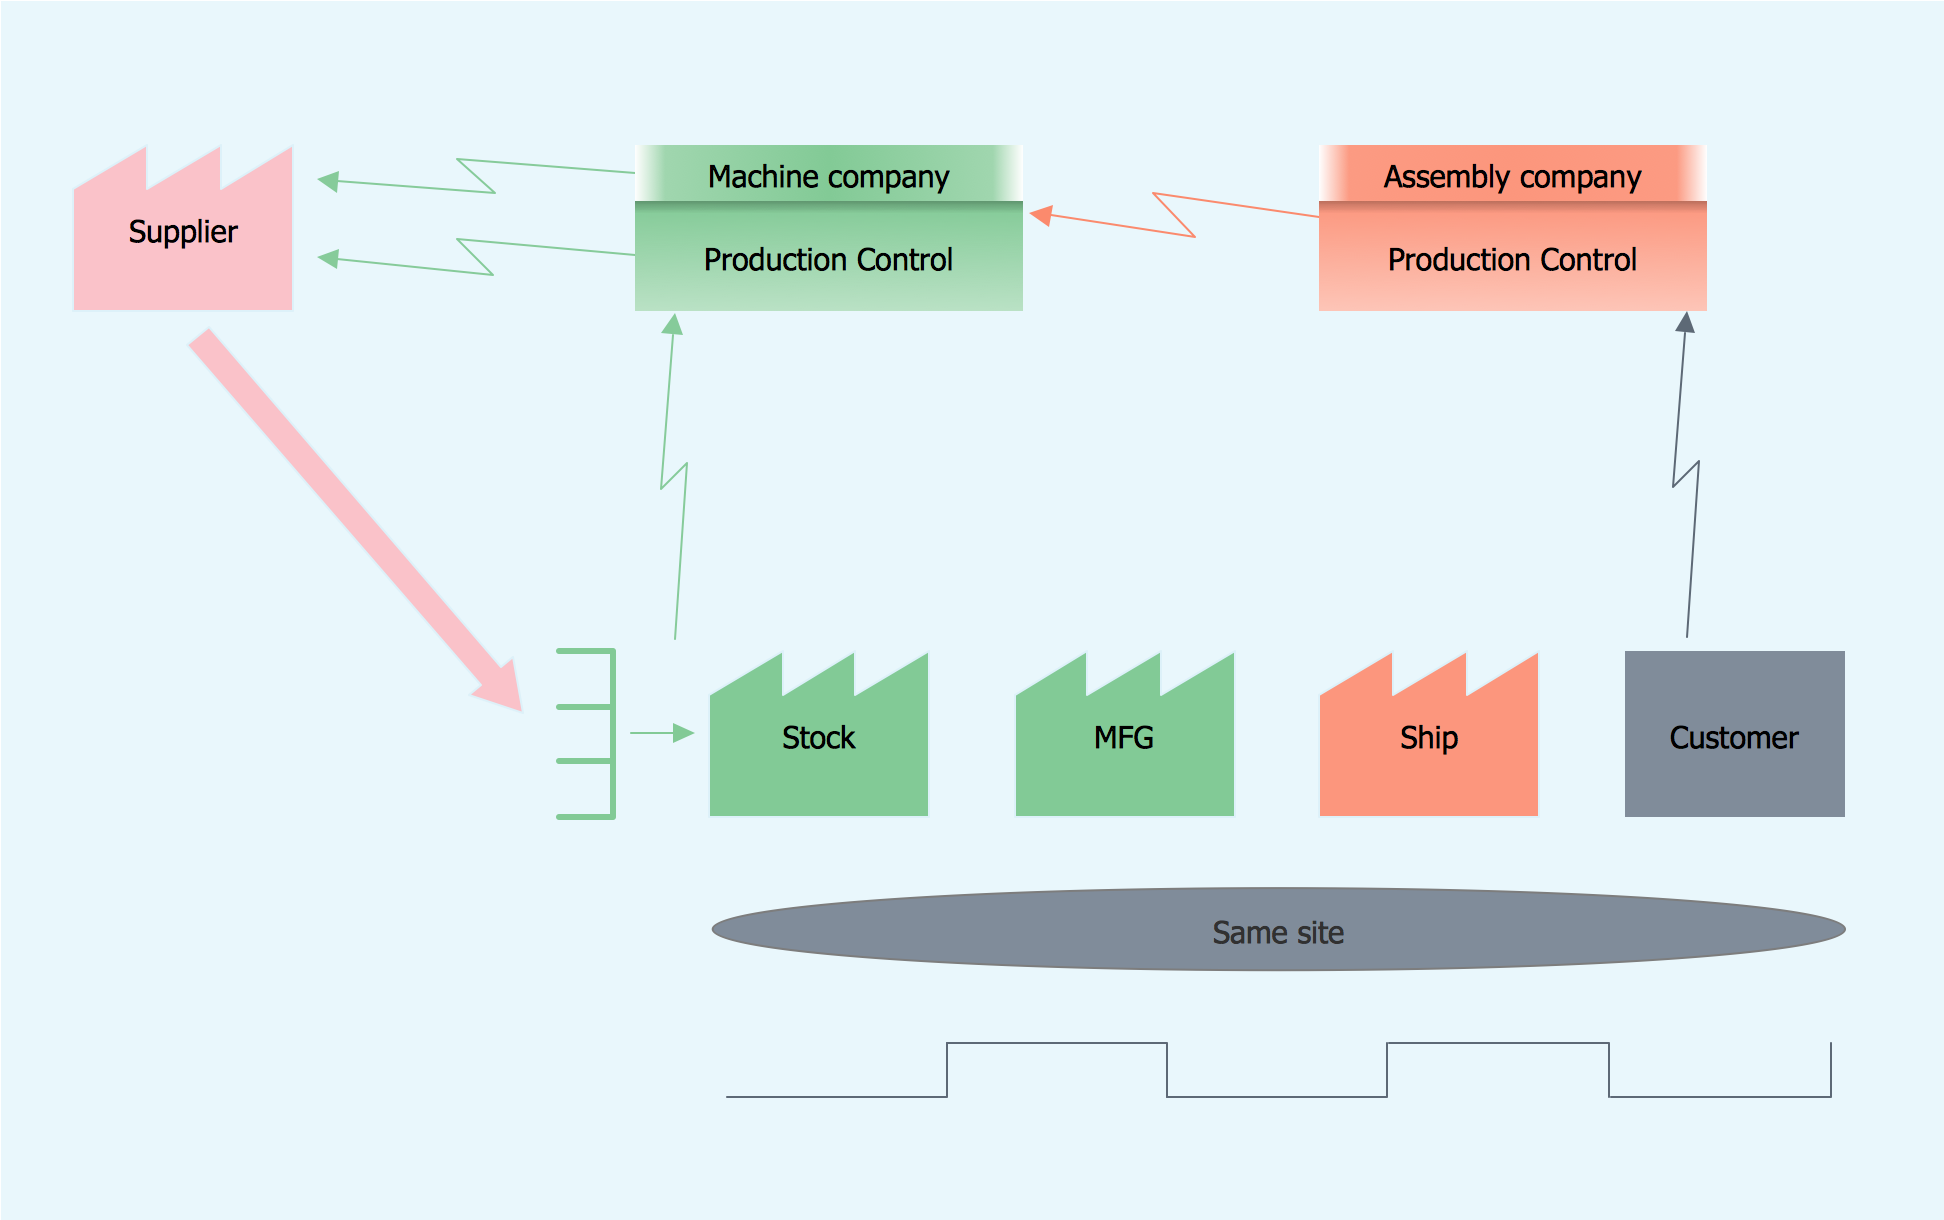
Example 1. Lean Manufacturing
Value Stream Mapping Solution offers the extensive drawing tools for the lean manufacturing process. The great value has the availability of predesigned vector objects in Value Stream Mapping library of the Value Stream Mapping Solution. These ready-to-use objects let you the possibility to draw without efforts - all that you need is simply drag ready objects from the library to the document, arrange and connect them and make style changes.

Example 2. Value Stream Mapping Library Design Elements
The lean manufacturing sample you see on this page was created in ConceptDraw DIAGRAM software using the Value Stream Mapping Solution for ConceptDraw Solution Park. An experienced user spent 10 minutes creating this sample in ConceptDraw DIAGRAM
Use the Value Stream Mapping Solution for ConceptDraw DIAGRAM to realize effectively the lean manufacturing process and easily draw professional looking diagrams.
All source documents are vector graphic documents. They are available for reviewing, modifying, or converting to a variety of formats (PDF file, MS PowerPoint, MS Visio, and many other graphic formats) from the ConceptDraw STORE. The Value Stream Mapping Solution is available for all ConceptDraw DIAGRAM
THREE RELATED HOW TO's:
Lean manufacturing or lean production is a concept of organization's management which is based on the constant effort to eliminate all kinds of losses. Lean manufacturing requires involvement of each employee in the process of business optimization and maximum customer orientation.
ConceptDraw DIAGRAM diagramming and vector drawing software enhanced with Value Stream Mapping solution from the Quality area of ConceptDraw Solution Park is perfect for the lean manufacturing.Picture: Lean Manufacturing
Related Solution:
To your mind, deliberation about the profits of creating organizational charts takes more time than actually creating itself. If lack of software is the only thing that stops you, you should know that organizational charts with ConceptDraw DIAGRAM are created within a few minutes. Owing to the great number of ready-to-use templates, you’ll get your chart easily.
Chart is a very handy format for visually depicting official relations of an organization. Usually, an Orgchart (organizational chart) consists from simple geometrical shapes, containing an information on a position, personal data, and the lines that means responsibilities and accountabilities associated with position. ConceptDraw solution designed for making organizational charts enables one to create various org charts effortlessly using special templates and vector libraries.
Picture: Organizational Charts with ConceptDraw DIAGRAM
Related Solution:
A flowchart is a powerful tool for examining processes. It helps improving processes a lot, as it becomes much easier to communicate between involved people, to identify potential problems and to optimize workflow. There are flowcharts of different shapes, sizes and types of flowchart vary from quite basic process flowcharts to complex program flowcharts. Nevertheless, all these diagrams use the same set of special symbols like arrows to connect blocks, parallelogram to show data receiving or rectangles for showing process steps.
Basic flowcharts are used to represent a simple process algorithm. A basic flowchart notation consists of rectangles (business processes), arrows (the flow of information, documents, etc.). The same notation is used in items such as the "decision", which allow you to do the branching. To indicate the start of the entire business process and its termination can be used the "Terminator" element. The advantages of Basic Flowchart are simplicity and clarity. With it you can quickly describe the business process steps. Creating of Basic Flowchart does not require any special knowledge, as easily understand by employees with different levels of education and IQ.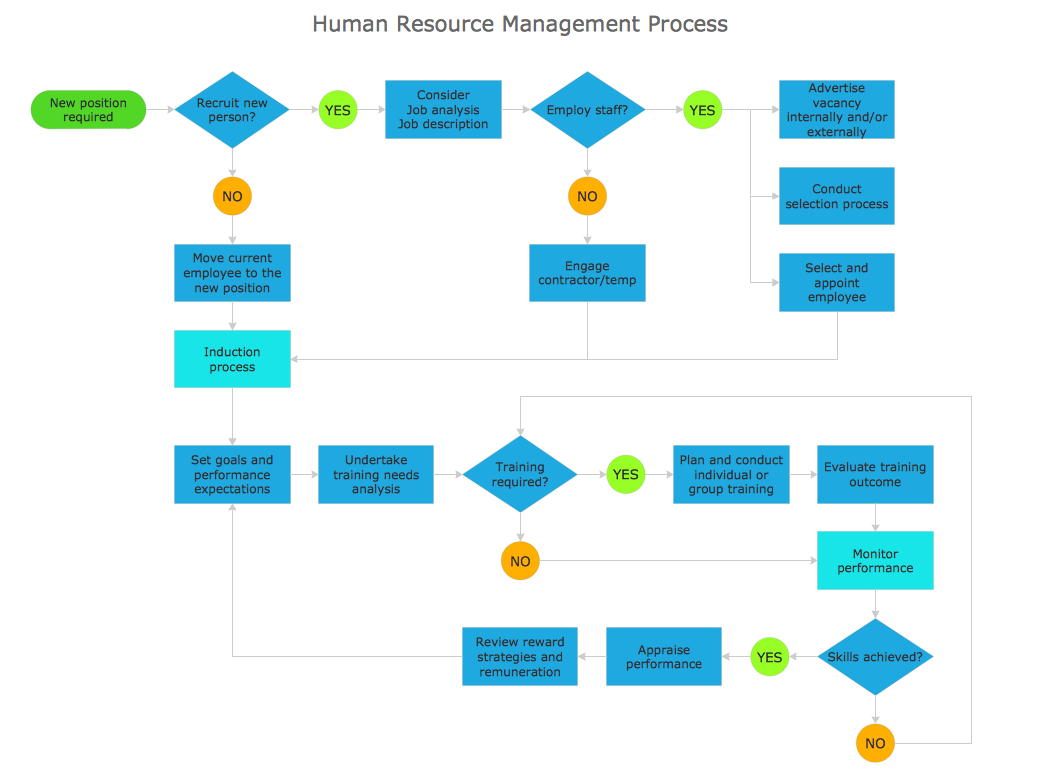
Picture: Types of Flowchart: Comprehensive Overview
Related Solution:
