Learn how to create a current
state value stream map
Value Stream Mapping is a Lean Manufacturing tool that through the flow diagram can provide documenting every step of a manufacturing process. For the start simply put timeline objects from library and continue to create diagram. After that put it to specific place object that illustrate processes of the production. Many lean practitioners use Value Stream Mapping as a fundamental tool to identify waste, cut process cycle times, and implement process improvement.

Pic.1 Value stream mapping (VSM) diagram vector design elements.
Value Stream Mapping solution extends ConceptDraw DIAGRAM software with templates, samples and vector shapes for drawing the current state value stream maps.
See also Samples:
TEN RELATED HOW TO's:
Interactive Training via presentations is used widely in education. This is a frequently used tool on training, especially for remote training via Skype.
Picture: Interactive Training Tool
Related Solution:
Create flowcharts, org charts, shipping flowcharts, floor plans, business diagrams and more with ConceptDraw. Includes 1000s of professional-looking business templates that you can modify and make your own.
Picture: Basic Diagramming
Related Solution:
The Saarland is one of the sixteen federal states (or Bundesländer) of Germany. The capital city is Saarbrücken.
Despite the fact that the maps surround us everywhere in our life, usually the process of their drawing is sufficienly complex and labor-intensive. But now, thanks to the ConceptDraw DIAGRAM diagramming and vector drawing software extended with Germany Map Solution from the Maps Area of ConceptDraw Solution Park, we have the possibility to make easier this process. Design fast and easy your own pictorial maps of Germany, map of Germany with cities, and thematic Germany maps in ConceptDraw DIAGRAM!
Picture: Map of Germany — Saarland State
Related Solution:
The Value Stream Mapping solution continues to extend the range of ConceptDraw DIAGRAM into a business graphics tool that can be used to document processes of Lean Manufacturing.
Picture: Lean Manufacturing Diagrams
Related Solution:
The knowledge and ability to apply various strategies for dealing with problems and difficult situations is very useful in many areas. The Fishbone strategy is one of the most progressive. This graphical technique helps to identify possible causes of problems, to set the goals, and also show internal connections between the different parts of problem. After reviewing all causes and facts, you can easily find right solution.
ConceptDraw DIAGRAM diagramming and vector drawing software extended with Fishbone Diagrams Solution from the Management Area of ConceptDraw Solution Park is a powerful Fishbone Problem Solving tool.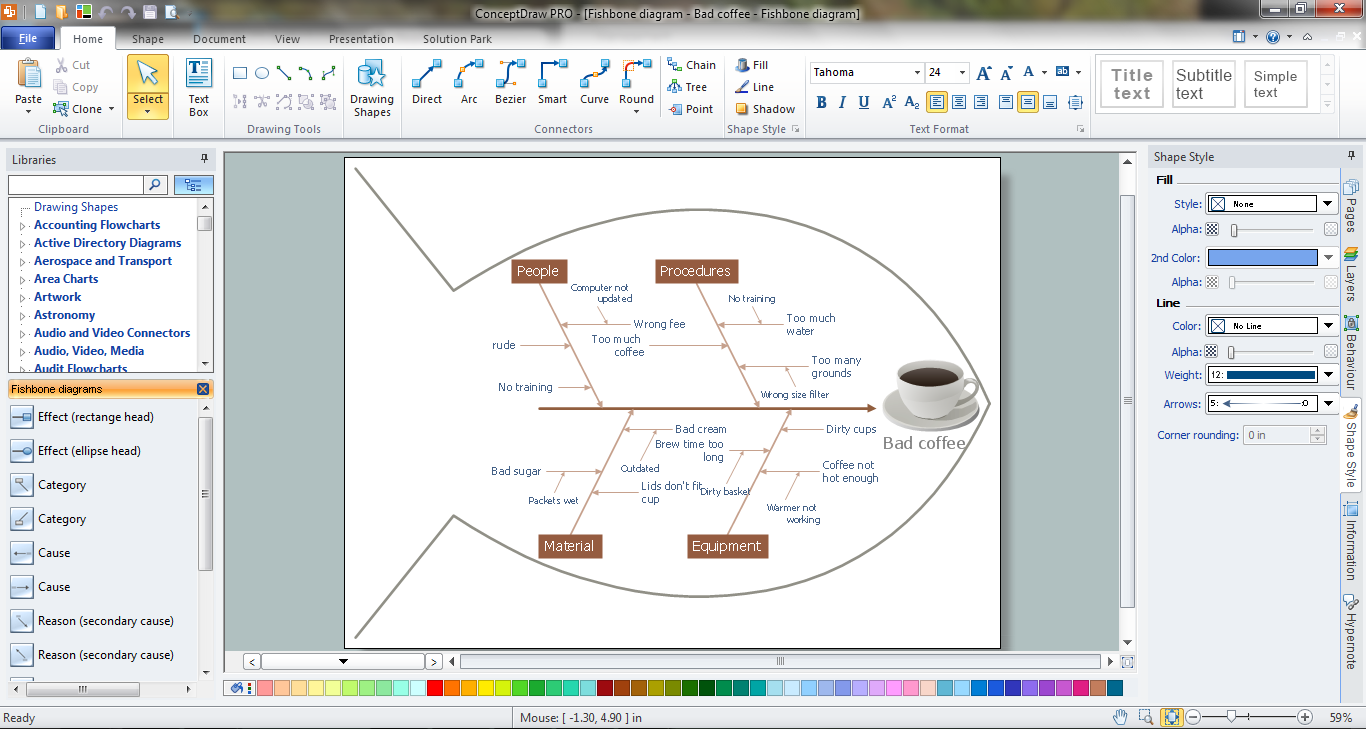
Picture: Fishbone Problem Solving
Related Solution:
If you want to find a way to understand complex things in minutes, you should try to visualize data. One of the most useful tool for this is creating a flowchart, which is a diagram representing stages of some process in sequential order. There are so many possible uses of flowcharts and you can find tons of flow charts examples and predesigned templates on the Internet. Warehouse flowchart is often used for describing workflow and business process mapping. Using your imagination, you can simplify your job or daily routine with flowcharts.
Warehouse flowcharts are used to document product and information flow between sources of supply and consumers. The flowchart provides the staged guidance on how to manage each aspect of warehousing and describes such aspects as receiving of supplies; control of quality; shipment and storage and corresponding document flow. Warehouse flowchart, being actual is a good source of information. It indicates the stepwise way to complete the warehouse and inventory management process flow. Also it can be very useful for an inventory and audit procedures.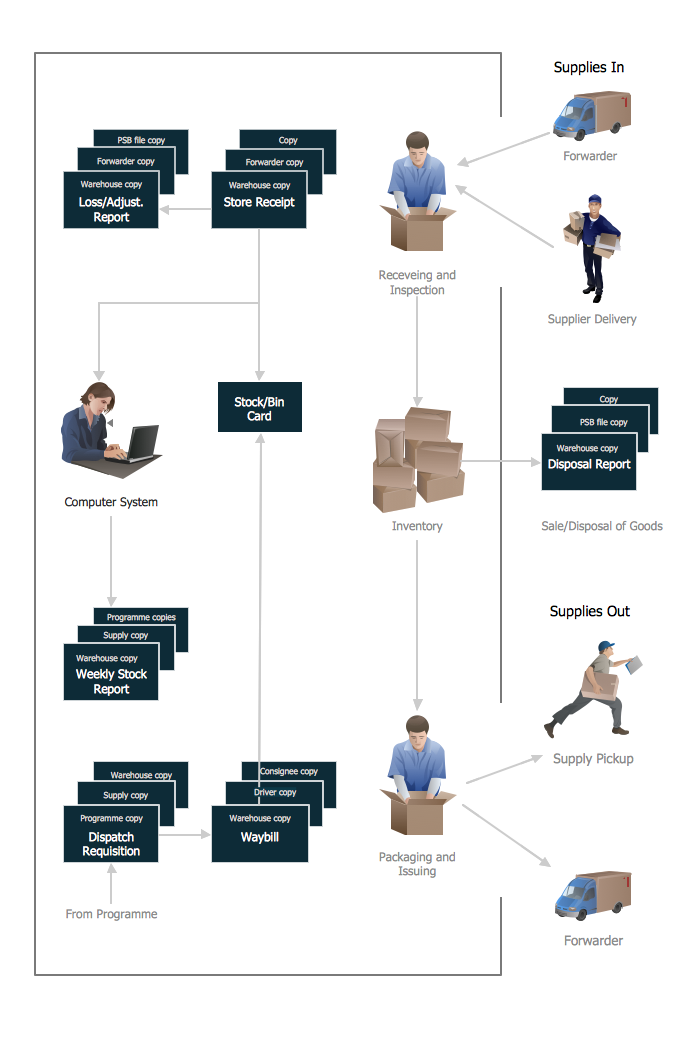
Picture: Flow Chart Example: Warehouse Flowchart
Related Solution:
Value Stream Mapping solution extends ConceptDraw DIAGRAM software with templates, samples and vector shapes for drawing the current state value stream maps.
Picture: Learn how to create a current state value stream map
Related Solution:
The Value Stream Map is one of the key tools of lean practitioners. It helps aptly describe the manufacturing processes both complex and simple. It supports process improvement, allows identifying waste, and reducing process cycle times. Use ConceptDraw DIAGRAM extended with Value Stream Mapping solution to document processes starting with a professionally designed Value Stream Mapping template.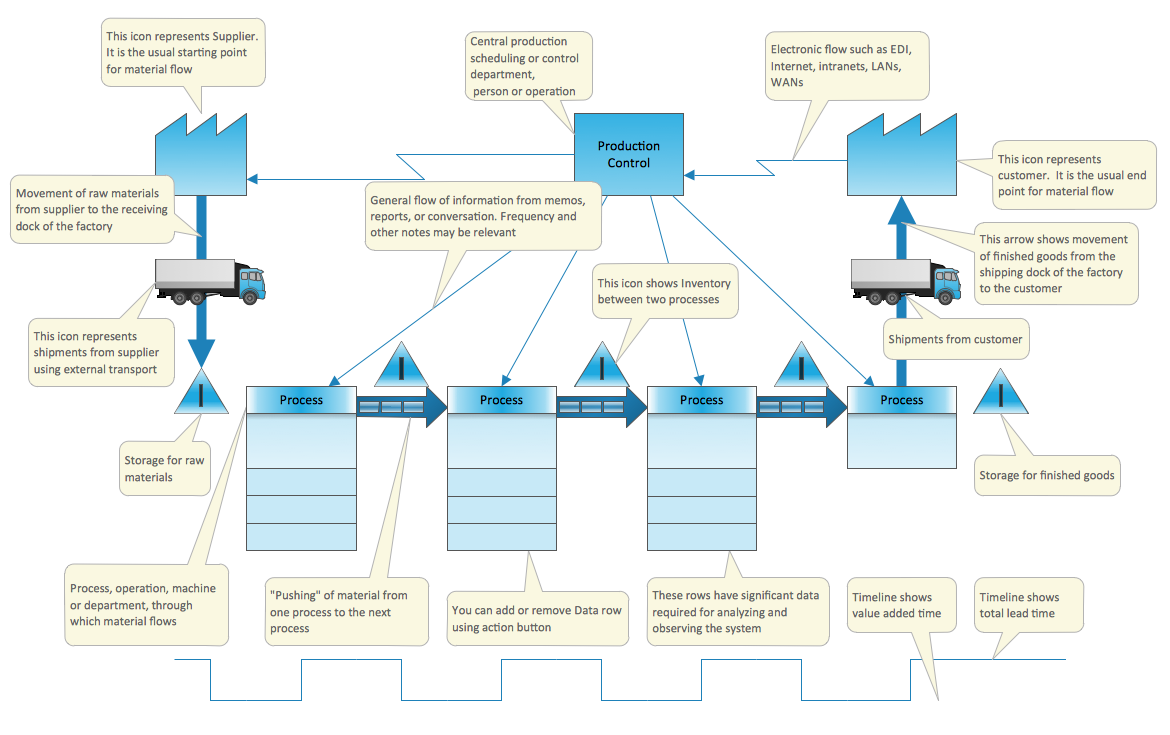
Picture: Value Stream Mapping Template
Related Solution:
Any business process consists from a number of tasks carrying out the certain business goal. It is useful to diagram business processes to ensure that they are as foolproof, logical and sequential as possible. This business process diagram describes a typical booking process flow by the example of a cab booking process. It can be used as a roadmap for any booking system implementation. Diagramming a business process allows you to look at the entire project and take into account all types of possible scenarios. Business process diagram helps you investigate and clarify the process thoroughly so that you can find out how it can be improved. Business process diagram supports team communications by ensuring that each process element is clear and everyone in the team is on the same page.
Sometimes your company brings you less profit than you expect it to be, and it’s difficult to reveal the causes. Maybe it’s time to learn new technologies, because business diagram are easily developed by means of special software, so you won’t make any extra effort. In return, you will increase your productivity and get more done in a less time.
Picture: Business Diagram Software
Related Solutions:
Maine is a state in the New England region of the northeastern United States, bordered by the Atlantic Ocean to the east and south; New Hampshire to the west; the Canadian provinces of Quebec to the northwest; and New Brunswick to the northeast.
The vector stencils library Maine contains contours for ConceptDraw DIAGRAM diagramming and vector drawing software. This library is contained in the Continent Maps solution from Maps area of ConceptDraw Solution Park.
Picture: Geo Map — USA — Maine
Related Solution:
ConceptDraw
MINDMAP 16