Line Chart Template for Word
|
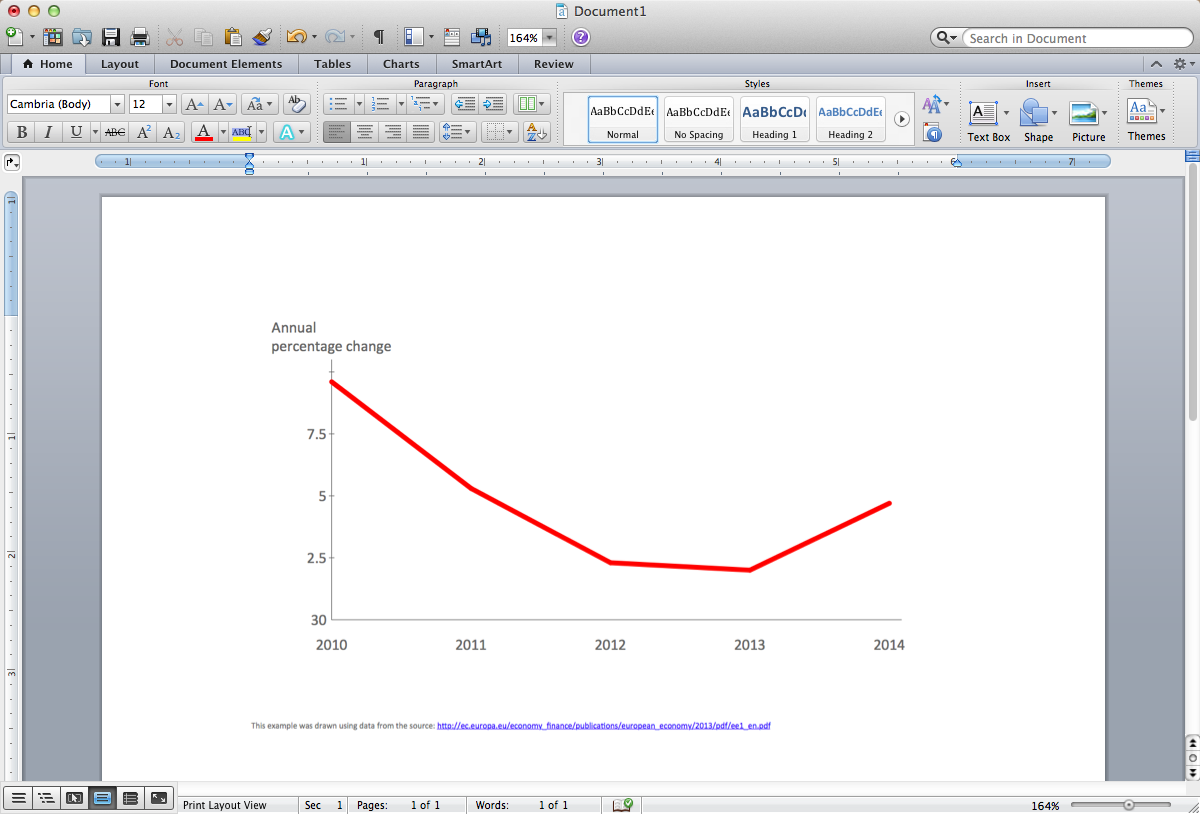
This sample was created in ConceptDraw DIAGRAM diagramming and vector drawing software using the Line Graphs Solution from Graphs and Charts area of ConceptDraw Solution Park. This sample shows the Line Chart of annual percentage change. The Line Chart allows you to clearly see the changes of data over the time. This sample can be used for effective displaying the data in statistics, analytics, forecasting, business, mass media, at the creating the annual reports and presentations. Pic. 1. Line Chart Template Using the ready-to-use objects from the Line Graphs Solution for ConceptDraw DIAGRAM you can create your own professional looking Line Chart Diagrams quick and easy. Free Download Line Chart Software and View All Examples and Templates |

Pic 1. Line Chart Template for Word
This picture shows the Line Chart in the MS Word.
See also Samples:
- Business Charts — Pie and Donut
- Business Charts — Bar and Histogram
- Business Charts — Area, Line and Scatter
- Marketing — Charts & Diagrams
- Flowcharts
- Orgcharts
- Quality and Manufacturing Charts
- Business Process Diagrams — Flow Charts
- Marketing — Flowcharts & Process Diagrams
- Business Diagrams — Concept Maps
- Business processes — Flow charts
- Marketing — Flowcharts and Process Diagrams
- Finance and Accounting
- Marketing — Social Media
- Business Diagrams
- Business Charts — Bar and Histogram


