Mac Tools - SWOT Analysis
The ConceptDraw DIAGRAM provides Mac Tools for drawing SWOT Analysis diagrams. The SWOT Analysis solution includes the SWOT matrix samples and templates that allow users create own SWOT and TOWS diagrams. SWOT analysis is a method of the making plan for evaluate the Strengths, Weaknesses, Opportunities, and Threats involved in a project. It involves specifying the objective of the project and identifying the internal and external causes for the accomplishing project goals.
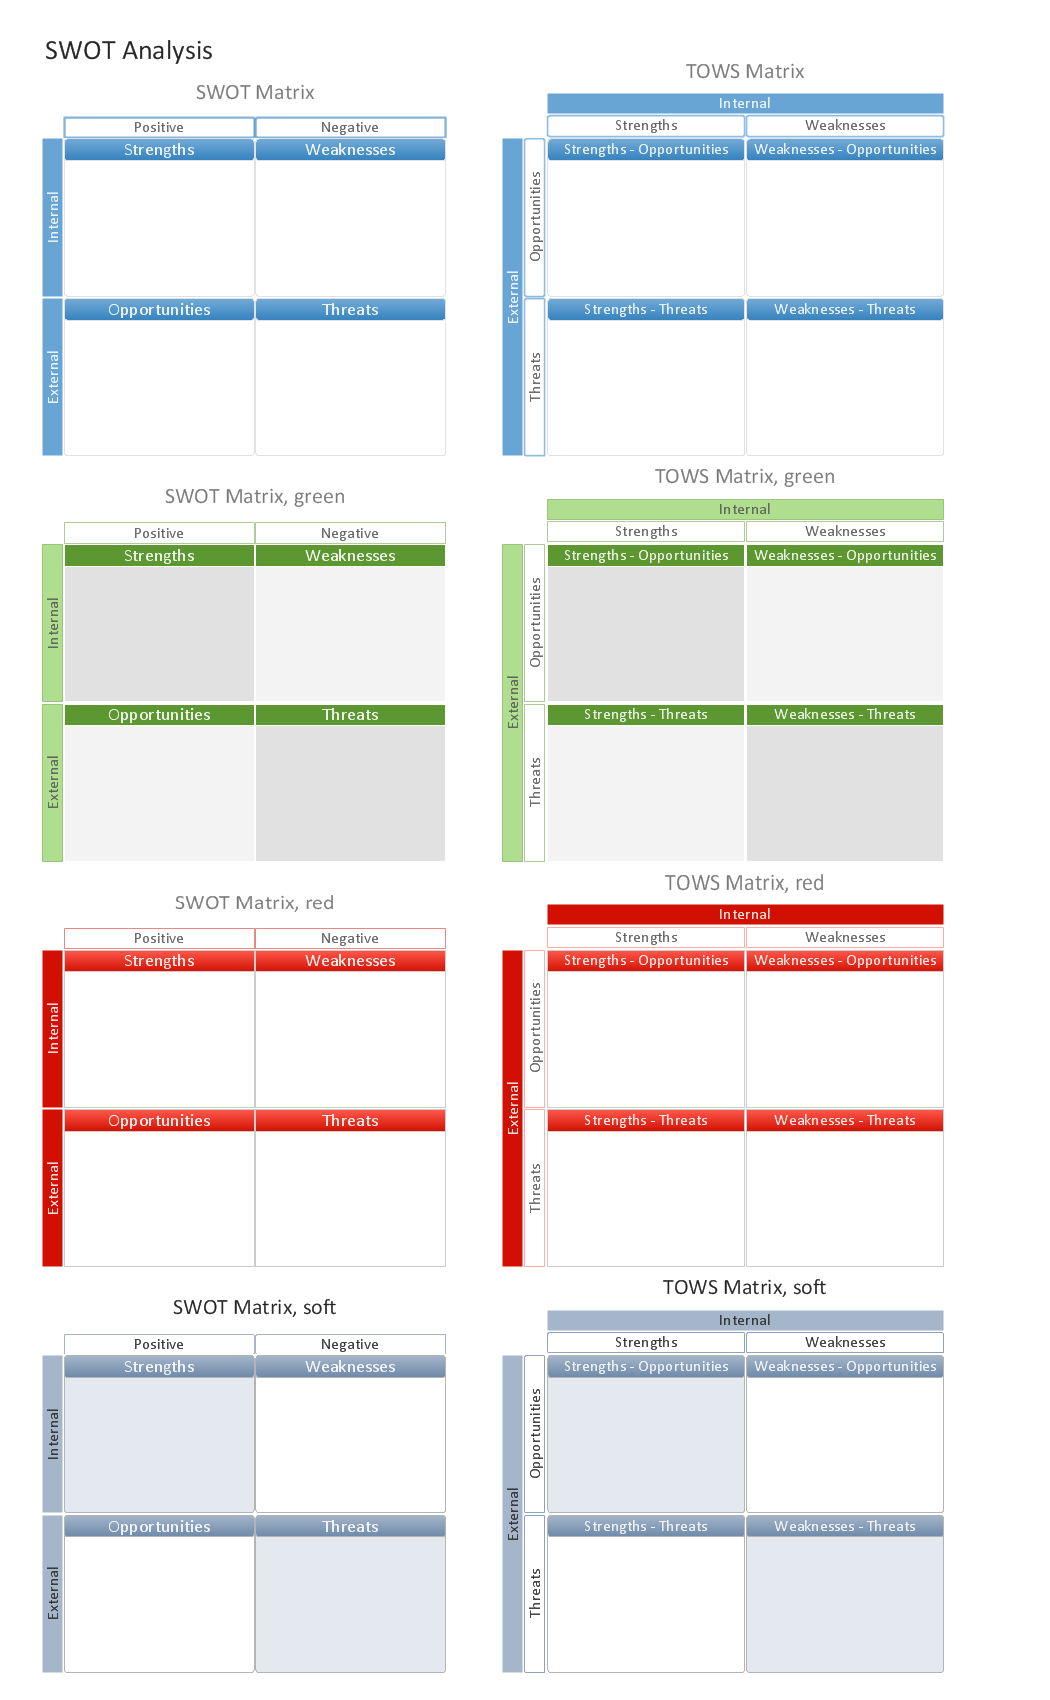
Sample 1. SWOT analysis matrix diagram - Design elements.
SWOT Analysis solution from ConceptDraw Solution Park extends ConceptDraw MINDMAP and ConceptDraw DIAGRAM software with easy-to-use SWOT Analysis tools for Mac and PC.
This solution contains SWOT and TOWS matrices and mind map templates to be filled in, that help identify Strengths, Weaknesses, Opportunities, and Threats.
See also:
Marketing — Matrices
- Marketing positioning matrix - Product positioning map
- Product-market matrix - Ansoff matrix
- BCG matrix - Boston growth-share matrix
- Feature comparison chart - Digital scouting cameras
- Marketing matrix diagram - Competitive strategies
- Marketing matrix diagram - Porters value chain
Marketing — Mind Maps
- Marketing mindmap - Marketing research project
- Marketing mind map - Strategic accomplishment mapping
- Twitter Compaign for New Software Product
- Marketing mind map - Sales Call
NINE RELATED HOW TO's:
To build Strategies - powerful feature of ConceptDraw MINDMAP allows to combine the power of MINDMAP with the accessibility of the world’s favorite human memory platform, Evernote.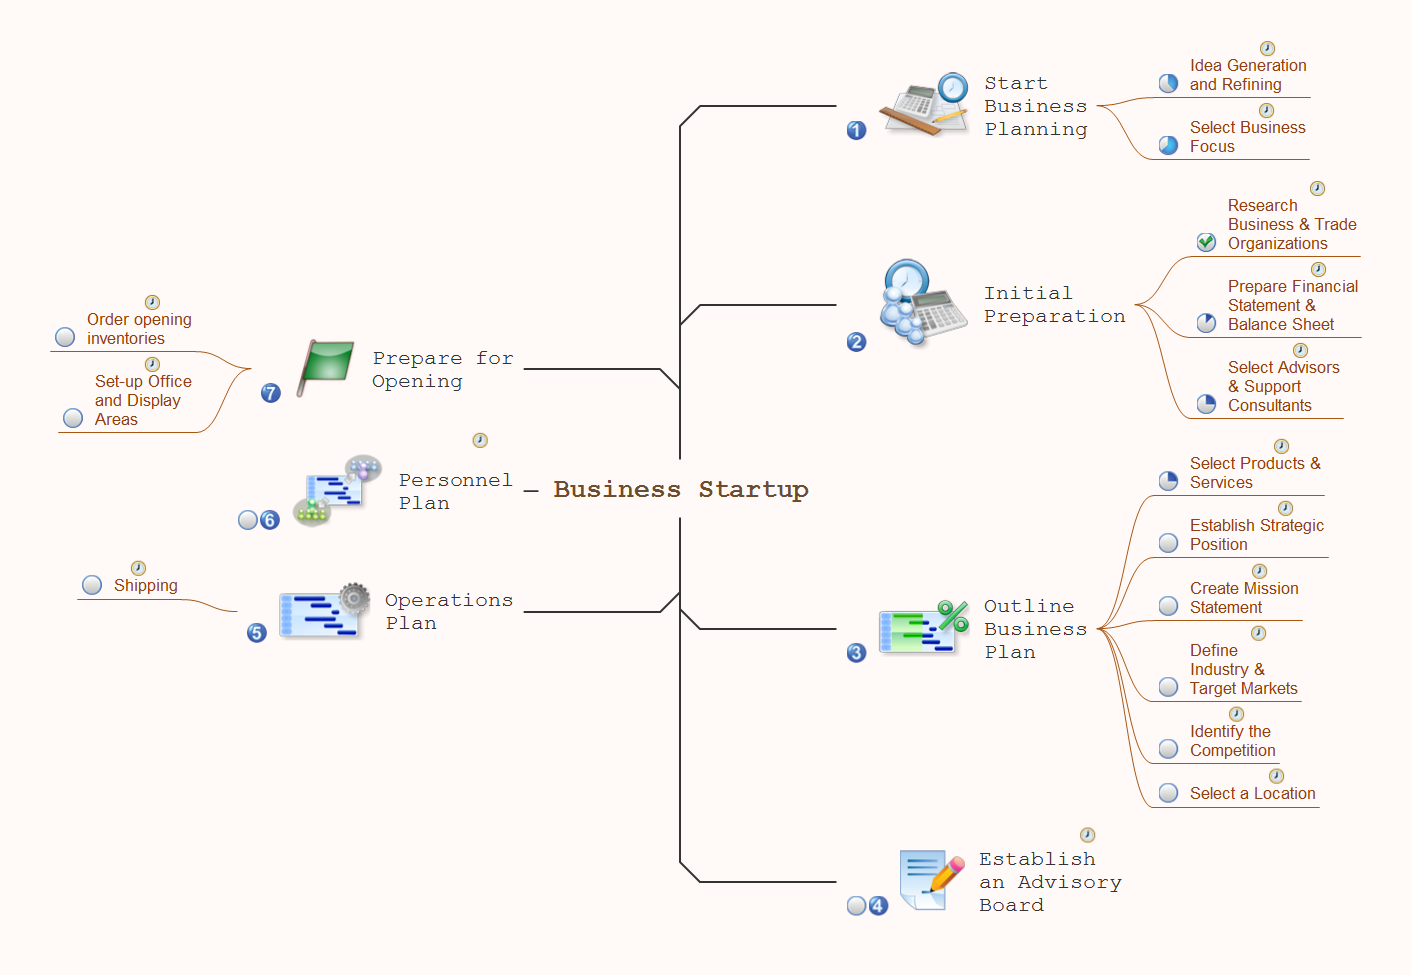
Picture: Build Strategies Exchanging Mind Maps with Evernote
Related Solution:
What Is a Line Chart? A line chart is a basic type of chart represented by a series of data points connected with a straight line. Explaining the meaning of “What is a line chart?” is convenient to use illustrations with professional looking line charts designed in ConceptDraw DIAGRAM diagramming and vector drawing software extended with Line Graphs solution from the Graphs and Charts area.
Picture: What Is a Line Chart
Related Solution:
There are many tools to manage a process or to illustrate an algorithm or a workflow. Flowcharting is one of those tools. However, it may be difficult to show complex processes that require multiple attributes or several people in a simple flowchart, so a cross-functional flowchart would be a solution for that situation. To create such flowchart, group processes and steps to labeled rows or columns, and divide those groups with horizontal or vertical parallel lines. It is worth mentioning that there are different types of cross-functional flowcharts, like opportunity or deployment flowchart.
This diagram shows a cross-functional flowchart that was made for a trading process. It contains 14 processes, distributed through 5 lines depicting the participants who interact with the process. Also there are connectors that show the data flow of information between processes. The cross-functional flowchart displays a detailed model of the trading process, as well as all participants in the process and how they interact with each other. The lines in the flowchart indicates the position, department and role of the trading process participants.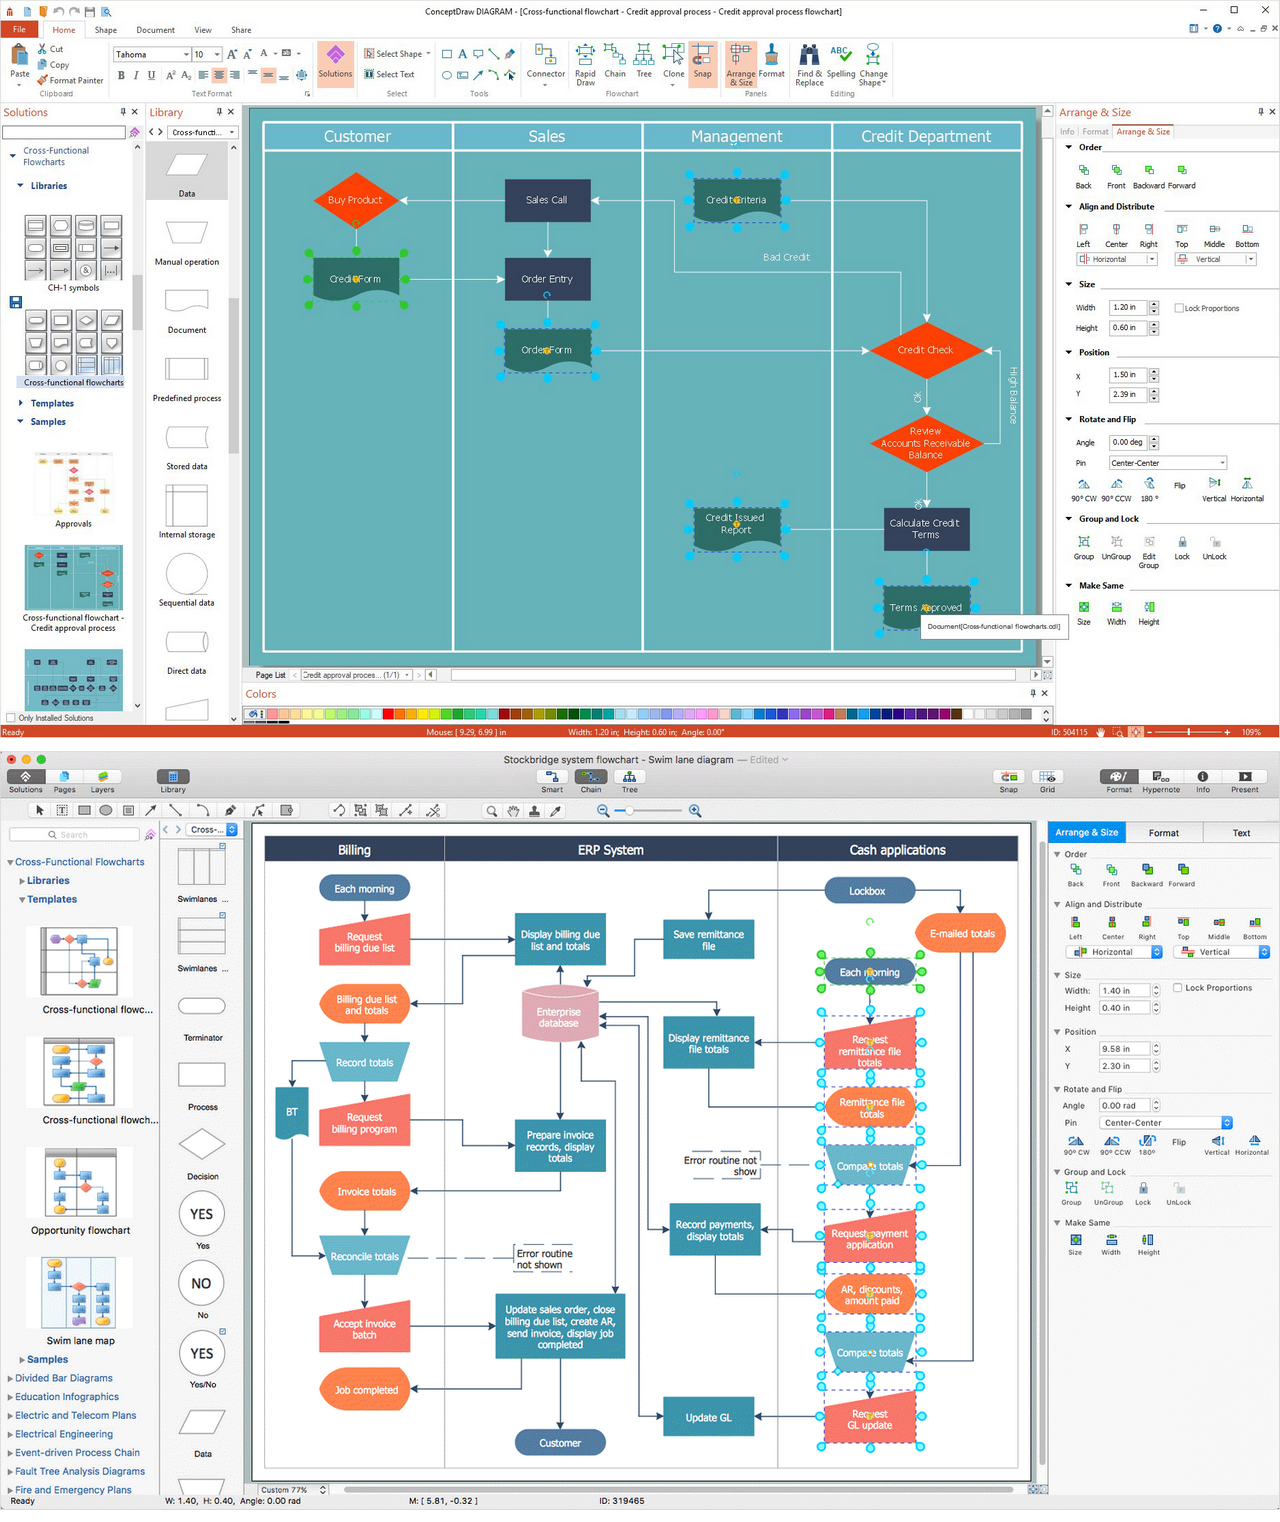
Picture: Cross-Functional Flowchart
Related Solution:
The growth–share matrix (BCG Matrix) was created by Bruce D. Henderson for the Boston Consulting Group in 1970 to help corporations to analyze their business units and to help the company allocate resources. How is it easy design the BCG Matrices in ConceptDraw DIAGRAM diagramming and vector drawing software supplied with unique Matrices Solution from the Marketing Area of ConceptDraw Solution Park.
Picture: BCG Matrix
Related Solution:
ConceptDraw DIAGRAM software extended with Matrices Solution from the Marketing Area of ConceptDraw Solution Park offers you the possibility to develop the Ansoff Matrix of any complexity.
Picture: Ansoff Matrix
Related Solution:
Starting producing workflow diagram from template you save time and avoid the blank page syndrome. At first, the workflow template is set of rules for a workflow. The workflow symbols used in the specific case are part of workflow template. This is the subset of large standard collections of workflow symbols. The first part of workflow template is identification of symbols allowed in use in your specific case. The best way would be to collect them in your customized drawing collection of workflow symbols which used in your specific cases of workflow diagrams. Another way to create business process documents is using business process flow diagram which have similar purposes and have different visual notation.
ConceptDraw DIAGRAM is professional workflow diagram software with the rich extentions from ConceptDraw Solution Park. The basic solution for workflow diagramming is Workflow Diagrams Solution. It delivers a rich set of workflow diagram templates and samples help you draw diagrams e
Picture: Workflow Diagram Template
Related Solution:
Biology is incredibly interesting and useful natural science which studies all living things on the earth (people, animals, plants), structure, functions, interactions, evolution of living organisms. Biologists of the whole world use actively illustrations and drawings in your science and education activity. To facilitate their task of biology drawing, ConceptDraw DIAGRAM diagramming and vector drawing software was extended with Biology solution from the Science and Education area. Now, ConceptDraw DIAGRAM is a powerful biology drawing software.
Picture: Biology Drawing Software
Related Solution:
If you are just a beginner in drawing flowcharts, it may seem that a sheet of paper and a pen are just enough. However, at the time you would want to share your results, diagramming applications would suite you better. it’s very easy to create diagrams that way and to discover new kinds of flowcharts.
The huge collection of sample ConceptDraw diagrams, charts, illustrations and other types of business drawings includes a wide range of business themes. A huge number of graphic images of ConceptDraw documents is divides on business application areas according to business-oriented solutions for which they were made.Here is a short visual list of samples of flowcharts, process diagrams, UML models, management charts, computer network diagrams, maps, infographics, illustrations, etc. In short, each ConceptDraw solution is accompanied with at least ten samples representing some particular examples of the application of the given chart.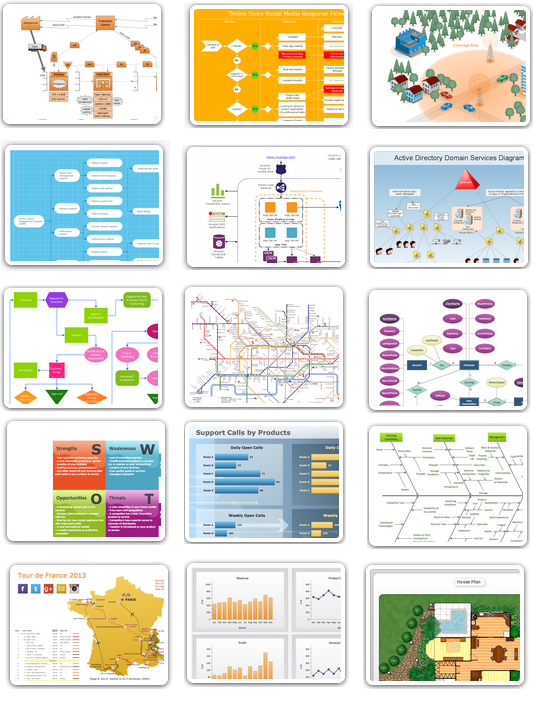
Picture: Applications
Mind map template of a strategy map that can help you display a variety of performance measures that can have an impact on your organization.
Picture: SWOT Analysis
Related Solution: