
Example 1. Make an Infographic - International Education Infogram
ConceptDraw DIAGRAM lets the possibility to make an infographics in new blank document or use the predesigned template or sample as the base.
If you choose the first variant, you need create the new document and fill it - type the text, set the colorful background and add the ready clipart objects from the Education Infographics Solution libraries:
- Education Backgrounds
- Education Callout
- Education Charts
- Education Connectors
- Education Diagram
- Education Indicators
- Education List Blocks
- Education Maps
- Education Pictograms
- Education Title Blocks
- Education Titled Callouts
If you want to use the predesigned template or sample, choose it from the offered set in ConceptDraw STORE. You are able to use it as is or change for your needs.

Example 2. Education Pictograms Library Design Elements
All predesigned objects from the Education Infographics Solution libraries are bright, colorful and attractive, and are able to decorate and to make professional looking and successful any educational materials.

Example 3. Make an Infographic - An Affordable College Education is a Cornerstone of Middle Class Security
Use Education Infographics Solution for ConceptDraw DIAGRAM diagramming and vector drawing software to make an infographic for any thematic without efforts. Make them quick and easy, and then successfully use in the learning process.
All source documents are vector graphic documents. They are available for reviewing, modifying, or converting to a variety of formats (PDF file, MS PowerPoint, MS Visio, and many other graphic formats) from the ConceptDraw STORE. The Education Infographics Solution is available for ConceptDraw DIAGRAM or later users.
SEVEN RELATED HOW TO's:
ConceptDraw DIAGRAM is a powerful diagramming and vector drawing software. Extended with Chemical and Process Engineering Solution from the Industrial Engineering Area of ConceptDraw Solution Park, it became the best Chemical Engineering software.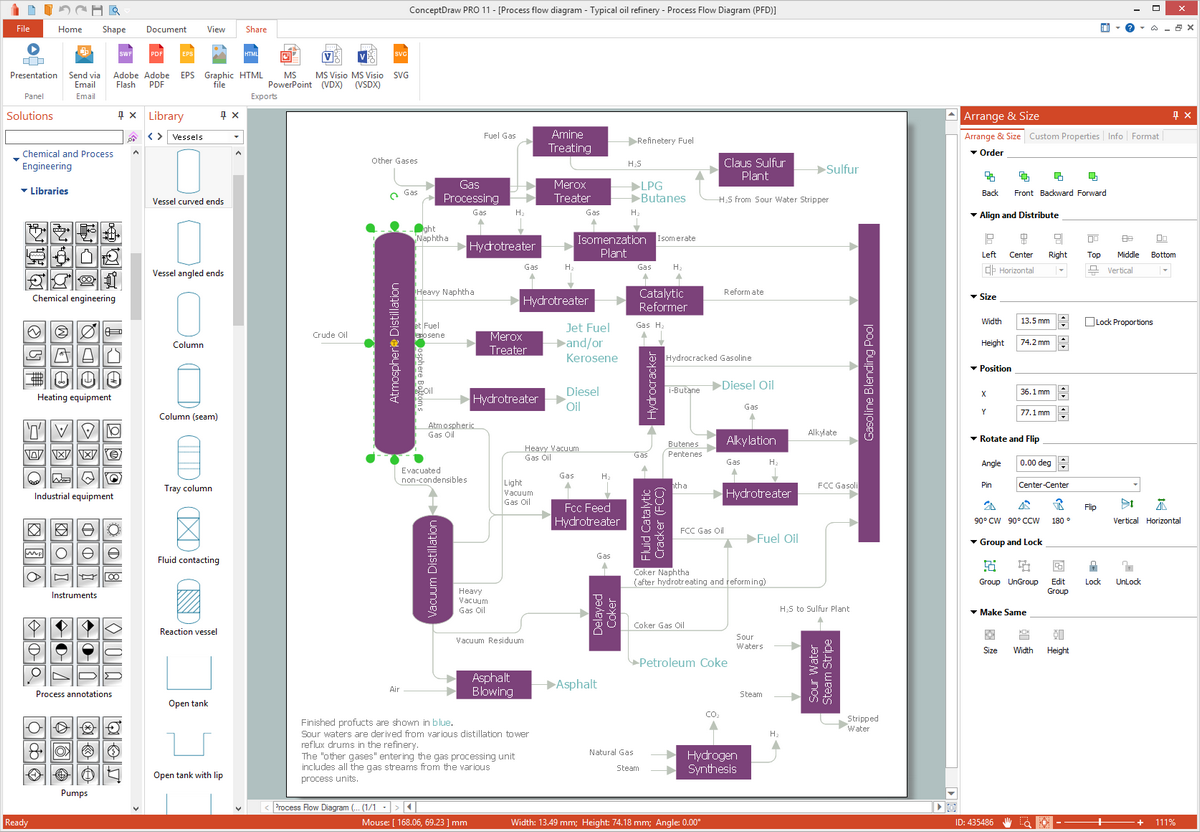
Picture: Chemical Engineering
Related Solution:
If we divide computer networks by scale, we get several main categories. The smallest network is PAN, as it connects personal devices themselves, and as the number of users grows, a local area network can be recognized, and campus area networks (CAN) connects several local networks located within some area like a university or a corporation. Computers connected to CAN share public educational materials and list of CAN network examples includes such prestigious universities like Stanford and Carnegie Mellon.
This is an example of a computer network diagram created for a campus area network. It was created using using ConceptDraw solution for the Computer and Network diagramming. The specific of this sample campus network is its distribution. It is rather broad to embrace a big campus territory. This diagram can be applied as a template for designing custom area network topology diagram for a particular educational institution.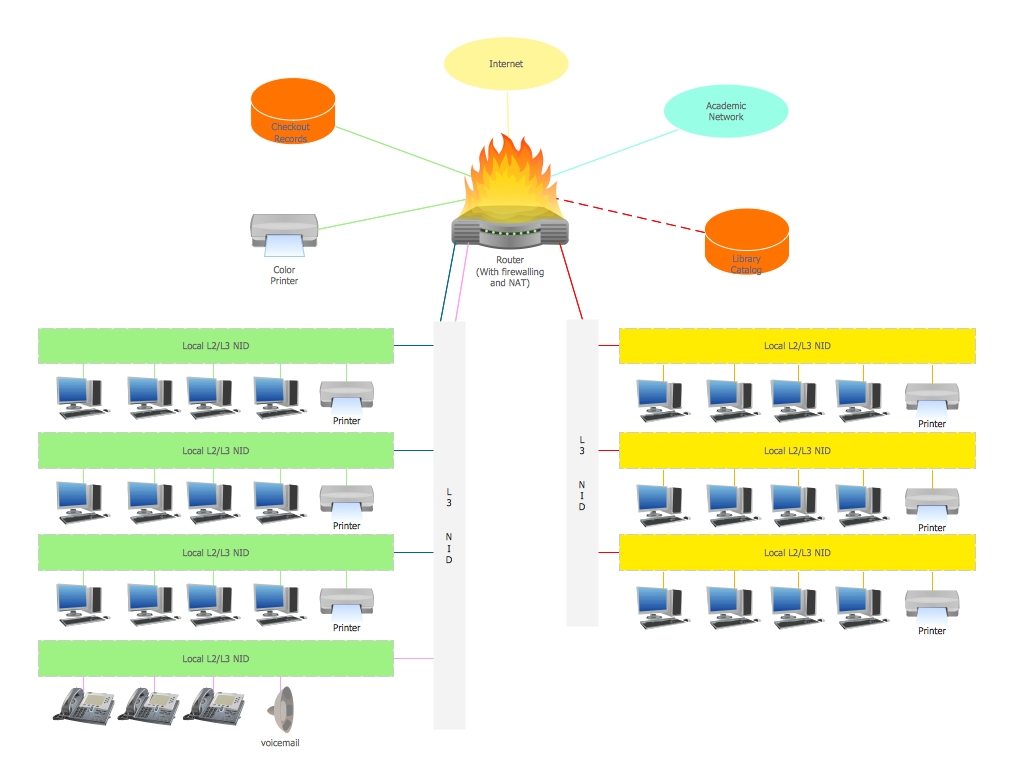
Picture: Campus Area Networks (CAN). Computer and Network Examples
Related Solution:
Infographics can be created with the help of ConceptDraw DIAGRAM diagramming and drawing software same way any other scheme or flowchart can be made: by using the appropriate solution taken from the ConceptDraw STORE application which consists of the needed tools such as the stencil libraries with the design elements that all can be used by the ConceptDraw DIAGRAM users.
Picture: Information Graphics
Related Solution:
The ConceptDraw Flowchart component includes a set of samples and templates. This geathered as flowchart maker toolbox which focused on drawing flowcharts of any industry standards.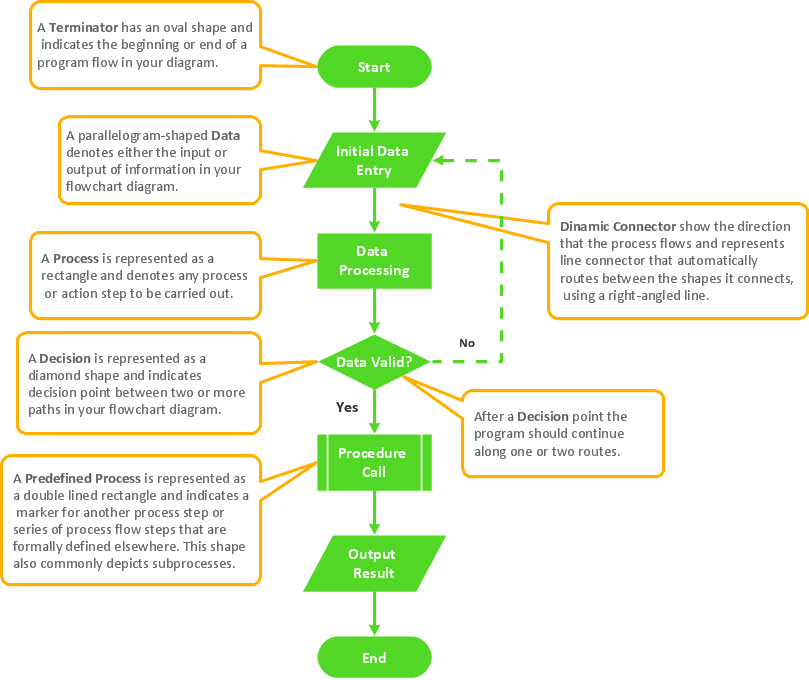
Picture: Flowchart Components
Related Solution:
3D Network Diagrams are very popular diagrams in the field of network technologies. They have more visual, clear, attractive and understandable look than 2D. ConceptDraw DIAGRAM gives the opportunity to draw the professional looking 3D Network Diagrams easy, quick and effective.
This example shows the 3D Network Diagram. It was created in ConceptDraw DIAGRAM using the 3D network elements from the Computer and Networks solution from the Computer and Networks area of ConceptDraw Solution Park.
Picture: 3D Network Diagrams. Computer and Network Examples
Related Solution:
While creating flowcharts and process flow diagrams, you should use special objects to define different statements, so anyone aware of flowcharts can get your scheme right. There is a short and an extended list of basic flowchart symbols and their meaning. Basic flowchart symbols include terminator objects, rectangles for describing steps of a process, diamonds representing appearing conditions and questions and parallelograms to show incoming data.
This diagram gives a general review of the standard symbols that are used when creating flowcharts and process flow diagrams. The practice of using a set of standard flowchart symbols was admitted in order to make flowcharts and other process flow diagrams created by any person properly understandable by other people. The flowchart symbols depict different kinds of actions and phases in a process. The sequence of the actions, and the relationships between them are shown by special lines and arrows. There are a large number of flowchart symbols. Which of them can be used in the particular diagram depends on its type. For instance, some symbols used in data flow diagrams usually are not used in the process flowcharts. Business process system use exactly these flowchart symbols.
Picture: Flowchart Symbols: Meaning and Examples
Related Solution:
The Ishikawa diagram, Cause and Effect diagram, Fishbone diagram — all they are the names of one and the same visual method for working with causal connections. Originally invented by Kaoru Ishikawa to control the process quality, the Ishikawa diagram is well proven in other fields of management and personal scheduling, events planning, time management. It is a chart in the form of a fish, whose head is a problem, the fins are variants for its causes.
To design easily the Fishbone diagram, you can use a special ConceptDraw DIAGRAM vector graphic and diagramming software which contains the powerful tools for Fishbone diagram problem solving offered by Fishbone Diagrams solution for the Management area of ConceptDraw Solution Park.
Picture: Fishbone Diagram Problem Solving
Related Solution:

