Made with
ConceptDraw
DIAGRAM 18

Make Family Tree

A family tree, also called a pedigree chart or a genealogy, is a chart tracing a person’s lineage and representing family members including ancestors through several generations, and their relationships in a tree structure. A family tree helps to discover your past, feel connected to your heritage, and keep saving your family history in a convenient visual form for future generations. The special kind of family tree called a genogram helps to identify genetic traits and medical conditions that run in a specific family. Most often family trees are created with the oldest generations at the top and the younger ones at the bottom.

There are created ancestry charts and descendant charts. An ancestry chart shows the ancestors of an individual and resembles a tree in shape, being wider at the top than at the bottom. The individual is presented as the ‘root’ and his ancestors including parents, grandparents, and others make up the ‘leaves’. Less often it is created with an individual on the left and his ancestors on the right. At the same time, a descendant chart shows the descendants of an individual and is created conversely narrow at the top. Each family member is usually represented by a box or a circle with a photo inside, the name and date of birth under it. You can also add any other information you consider important. The lines connect family members and portray their relationships. At your desire, the family tree can include only part of relatives, for example, the members of a particular surname, the representatives of one lineage (male or female), holders of a particular office (ancestry of kings or nobles), etc.

The first family trees were created mainly in families of famous personalities, public figures, and royal families. Currently, it is for everyone and there are many reasons to make your own family tree. Creating a family tree is a convenient way for everyone who is interested in his ancestry, who wants to explore who he is and where his ancestors came from, and who wants to record his own family history. The family tree gives you a connection to your heritage and is also a way to discover how your family story relates to historical periods and historical events. The special form of the family tree is a genogram, which offers a way to trace genetics and family health. Finally, creating a family tree is interesting and is a good way to pique your children’s and grandchildren's interest in learning about ancestors and preserving family stories for many centuries in the future.

Start creating a family tree with research, collecting, and preparing information and data. Check the documents and official records, talk to your relatives about your ancestry. Make research according to the degree of detailing you want your family tree to be. Decide on how many generations and how much data and information you want to include in your diagram, only the most important data (dates of birth, death, marriage) or also additional ones (maiden name, profession, role in the family, etc.). Fill in the gaps by asking family members, visiting libraries, surfing online genealogy sources, census records, etc. Unfortunately, the availability of records is usually limited by several centuries ago. It is really hard to find accurate older records because there was no census at that time, only church records. In addition, many records have been destroyed in wars, fires, natural disasters like floods, earthquakes, and other emergencies, and simple negligence. This limits your research by around three to five generations back.

Make Family Tree in ConceptDraw DIAGRAM Software

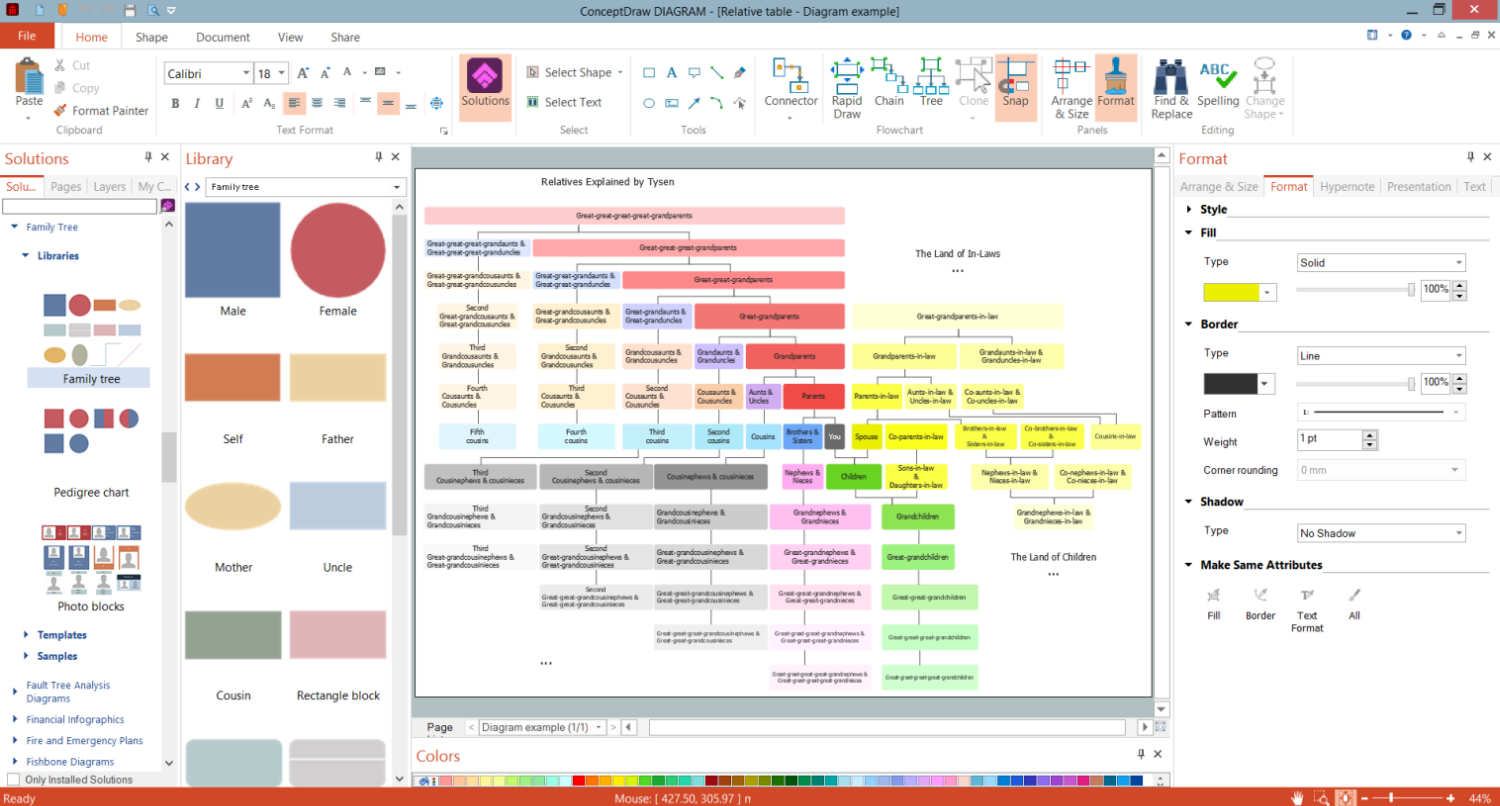
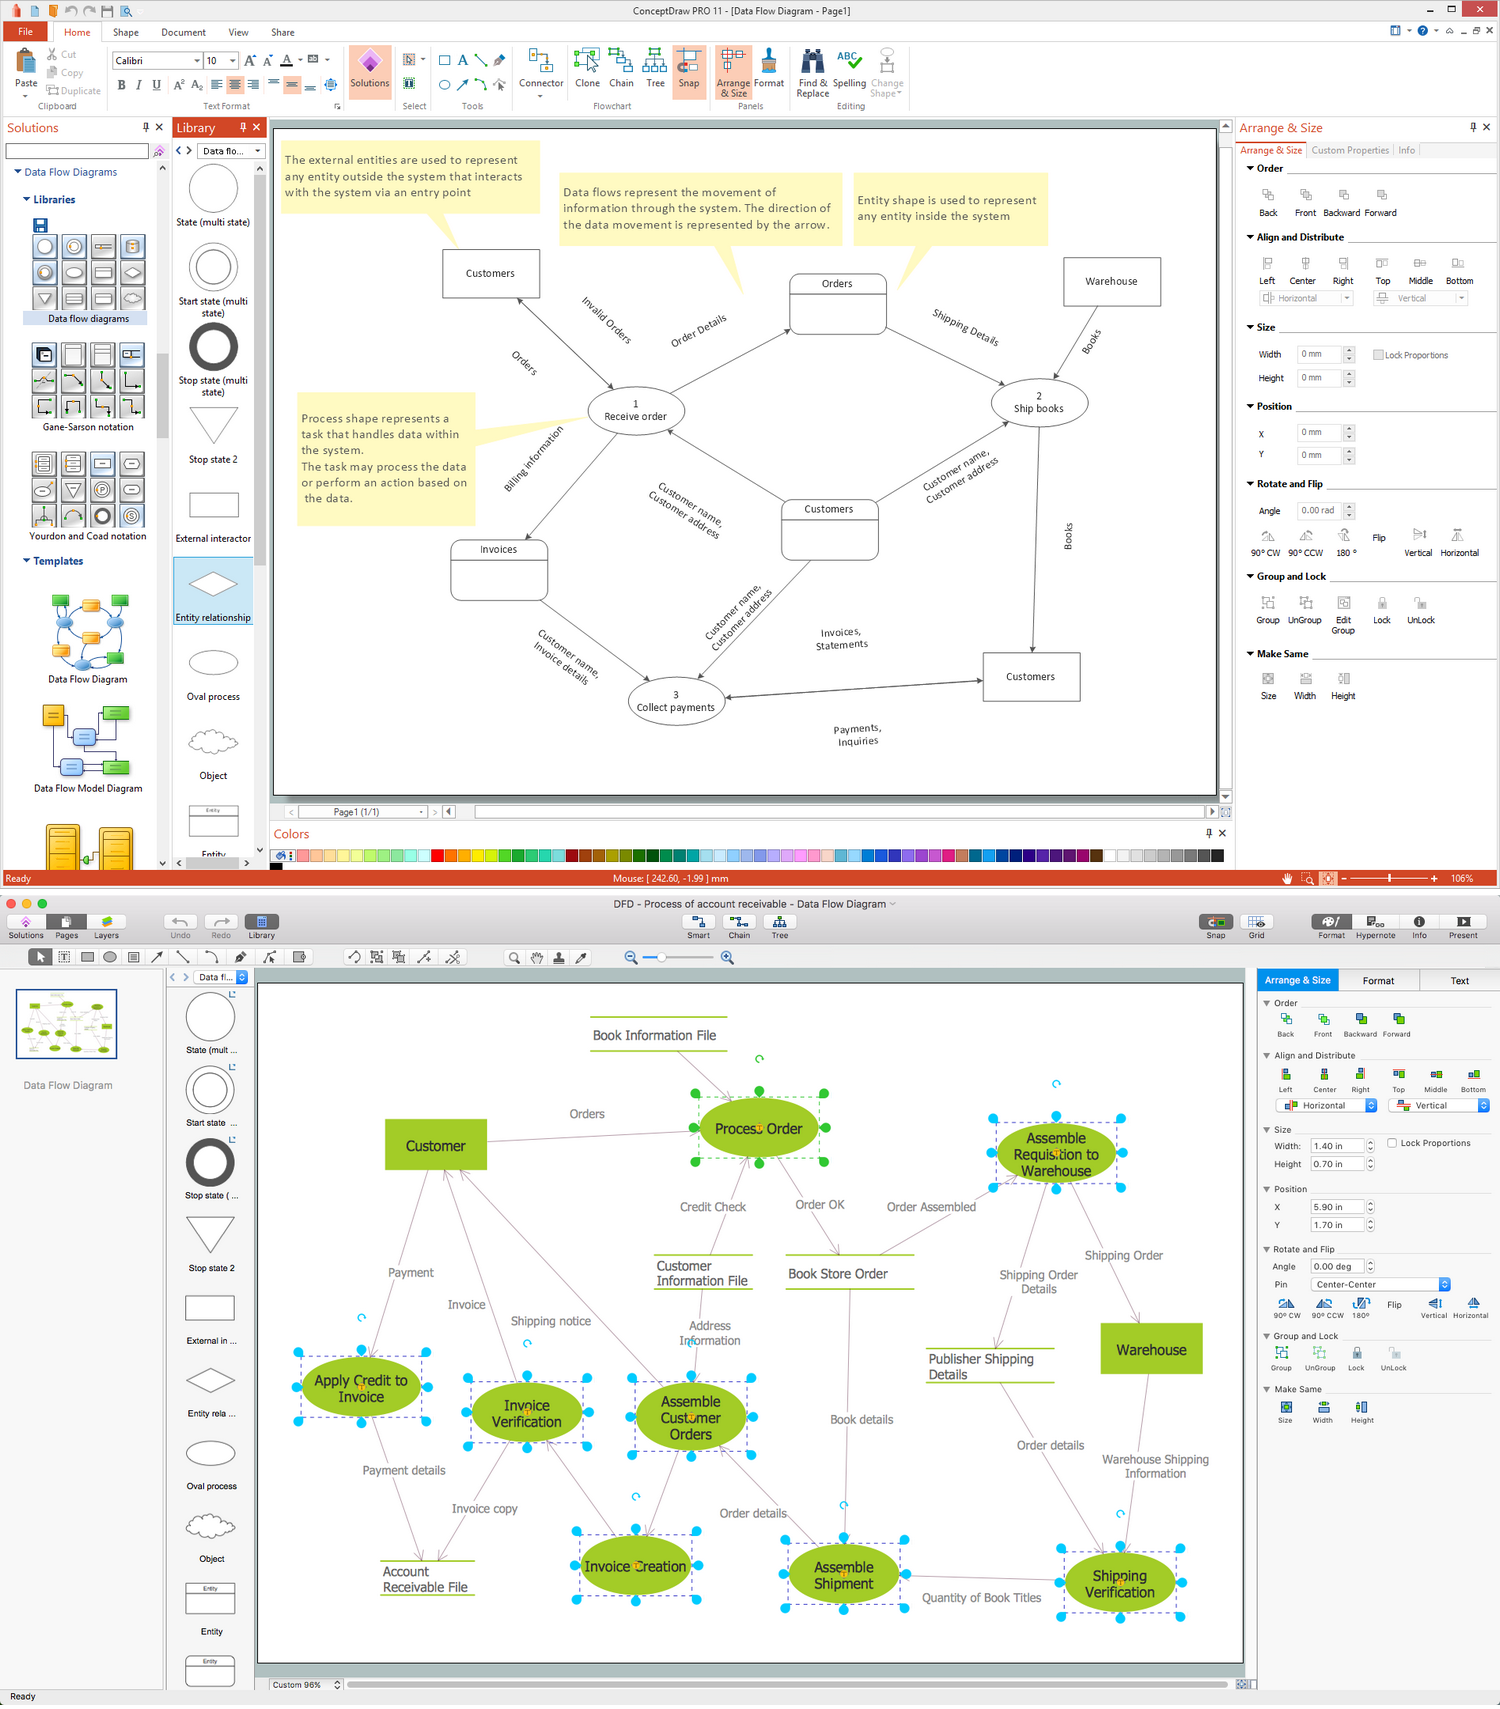
Example 1. Make Family Tree in ConceptDraw DIAGRAM Software

Trace your ancestors' genealogy as far back as you can or want. Ask your relatives, maybe somebody in your family already has some information that you can use as a starting point. Try to find photos of all included ancestors, they make your tree more informative and attractive. It is also important to consider which way to draw the tree and which direction: vertically from the top down or the bottom up, or horizontally. Now you can start drawing a tree. Traditionally, the family trees were drawn by hand on paper but currently, we have a more convenient way — the special vector drawing software ConceptDraw DIAGRAM with tools for creating family trees in the Family Tree solution.

The Family Tree solution offers a collection of family tree samples and templates. You can select one of the templates you desire and simply modify it, or start with a blank sheet. Start drawing your family tree with a box representing yourself or the ancestor you want to begin with, often it is the oldest ancestor you know about. Add information to the "leaves" representing family members. Usually, these are boxes, rectangles, or ovals connected by lines to represent relationships. You can also use any shape that you want or even differ your generations with shapes. Place a single generation at each level. Add names, dates of important events, pictures, photos, and any other information you want to include. Try to make your tree simple and clear to make the information easily perceived and relationships easily traced. In this way, your family tree will be useful to all members of your family.

Family Tree Libraries Design Elements

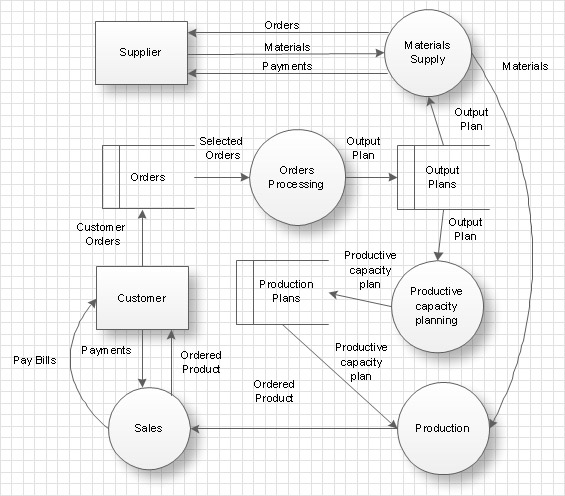
Example 2. Family Tree Libraries Design Elements

Visualize your family tree easily by drag-and-droping the ready-made vector objects from the solution libraries. Connect shapes, make style changes to the background and shapes, change their color, fill, add images (most often these are family photos), clipart, icons, labels, informative callouts, and other design elements in a few seconds to make family tree more attractive and engaging. Change colors of shapes, lines, and background, if necessary. Trace how your family tree is growing and transforming, design autosomal dominant or autosomal recessive pedigree chart, or any other types of family trees easily. All included samples and templates are easily customized making the drawing process faster and easier.

There is no single family tree definition for design and filling. You can include all information important precisely for you. However, your family tree designed in ConceptDraw DIAGRAM software is always presentation-ready and looks exceptionally. Uncover your family’s story, find more relatives, trace their stories through time and relationships to common ancestors. Once your family tree is ready, you can share it with other family members to collaborate efficiently and work simultaneously to create a more informative diagram. You can also save your family tree to different graphical formats, PDF, or other formats for further use.

Kennedy Family Tree

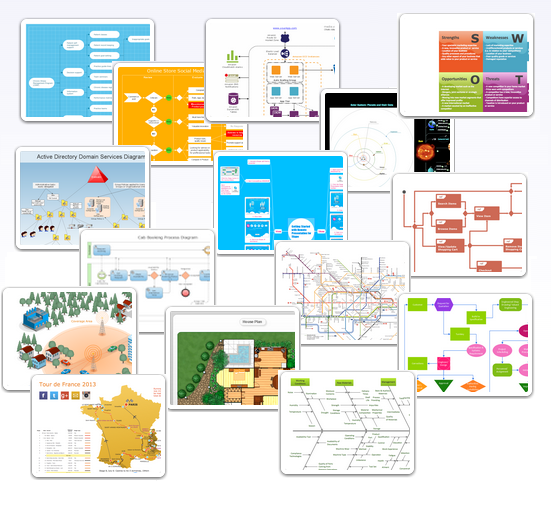
Example 3. Kennedy Family Tree

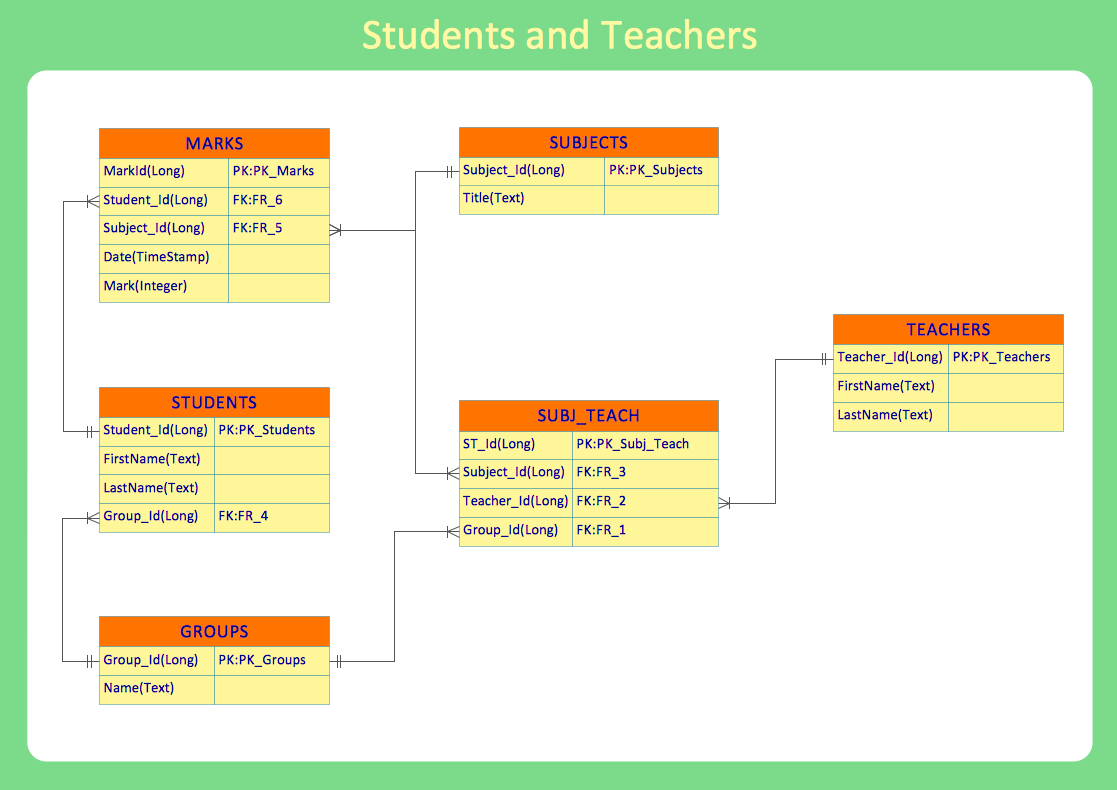
The Family Trees samples you see on this page were created in ConceptDraw DIAGRAM software using the drawing tools of the Family Tree Solution. These examples successfully demonstrate solution's capabilities and the professional results you can achieve using it. An experienced user spent 10-15 minutes creating each of these samples.

Use the powerful tools of the Family Tree solution to design your own Family Trees and Genograms quick, easily, and effectively.

All source documents are vector graphic documents. They are available for reviewing, modifying, or converting to a variety of formats (PDF file, MS PowerPoint, MS Visio, and many other graphic formats) from the ConceptDraw STORE. The Family Tree Solution is available for ConceptDraw DIAGRAM users.

TEN RELATED HOW TO's:
Agile methodology is an excellent alternative to waterfall and traditional sequential development. ConceptDraw DIAGRAM software extended with SCRUM Workflow solution is ideal for quick and easy designing various diagrams, charts, mind maps and schematics illustrating software development using Agile methodologies, and in particular Scrum methodology.Agile Methodology *
Picture: Agile Methodology
Related Solution:
Any information system receives data flows from external sources. In order to visualize them there is a list of data flow diagram symbols that describes how the system components cooperate. If you want to create a data flow diagram, ConceptDraw DIAGRAM Solution Park has DFD Library that contains both Yourdon and Gane-Sarson notations. This figure shows the content of vector libraries, delivered with ConceptDraw solution for data flow diagram (DFD). There are three libraries composed from about 50 vector objects used to make data flow diagrams. They include a complete set of objects utilized by Yourdon-Coad and Gane-Sarson notations - two primary notations that are apply for data flow diagramming. Also, one can discover additional "Data flow diagram (DFD)" library that provides a data flow diagram elements for designing level 1 and context-level data flow diagrams.Data Flow Diagram Symbols. DFD Library *
Picture: Data Flow Diagram Symbols. DFD Library
Related Solution:
There are many ways to define the flow of information within a system. Structured-systems analysis method often uses data flow diagrams to show data flow, data storages and data processing visualization. These diagrams are easy to develop and quite useful. Here is a dataflow diagram presenting an example of the manufacturing process flow. The oval process shapes represent a process that controls data within the current system. The process may produce data or make some action based on data. Data flows are represented by lines. They show the movement of information through the system. The direction of the data flow is depicted by the arrow. The external entities are shown by rectangles. They represent the external entities interacting with the system. The data store objects (unclosed rectangles) are used to show data bases participating in a process flow.Data Flow Diagram *
Picture: Data Flow Diagram
Related Solution:
There are numerous articles about the advantages of flowcharting, creating business graphics and developing different charts. Nevertheless, these articles are almost useless without the main component - the examples of flowcharts, org charts and without a fine example, it is difficult to get all the conveniences of creating diagrams. You can find tons of templates and vivid examples on Solution Park. This illustration shows a variety of business diagrams that can be created using ConceptDraw DIAGRAM. It comprises a different fields of business activities: management, marketing, networking, software and database development along with design of infographics and business illustrations. ConceptDraw DIAGRAM provides a huge set of sample drawings including business process modeling diagrams,, network diagrams, UML diagrams, orgcharts, DFD, flowcharts, ERD, geographical maps and more.Examples of Flowcharts, Org Charts and More
Picture: Examples of Flowcharts, Org Charts and More
Related Solution:
When we think about programming, we usually imagine sleepless nights spent on writing kilobytes of code. However, from another point of view, Software development with ConceptDraw DIAGRAM makes a programmer's life endlessly easier. This tool is unique to fulfill all your needs in short period of time. Over the recent years object-oriented methodology has become more and more widespread. Thanks to this methodology developers manage to deal with growing complexity of applications. More and more programs are written in such programming languages as C++, Java, Visual Basic and Object Pascal. However, the complexity of the designed systems imposes extended requirements as to design of graphic documentation. ConceptDraw possesses powerful tools for designing of technical documentation for object-oriented projects. The libraries included in the package allow to easily draw class hierarchies, object hierarchies and diagrams of data flows with the use of the most popular notations, including UML and Booch notations. And the library for projecting COM-interfaces will spare developers of ActiveX-servers a headache.Software development with ConceptDraw DIAGRAM  *
Picture: Software development with ConceptDraw DIAGRAM
IT world is extremely rational and logical. So what can be more precise than Software Diagrams to rate the results of work? Visual statistics is the best way to understand the data. This figure demonstrates the data flow diagram (DFD), which was created to describe the electronic system of custom purchase. This is the process of buying using electronic bar code scanning system. Such systems are used in large stores. The cashier scans the bar code, the system outputs the data on the price of the goods and carries out a purchase process. This DFD utilizes the Gane/Sarson notation. To create it The ConceptDraw DFD solution has been applied.Software Diagrams
Picture: Software Diagrams
Meeting ice hockey rules one should learn ice hockey rink terms, lines, zones etc. ConceptDraw DIAGRAM is an advanced drawing software that allows you produce ice hockey rink depiction of any complexity, from simple sketch drawing to detailed one as on example below.Ice Hockey Rink Dimensions *
Picture: Ice Hockey Rink Dimensions
Related Solution:
When we start to speak about databases, we must always mention database structure visualization. One of the most common ways to do it is to create an entity relationship diagram, and to put appropriate symbols on it. It is important either for database projecting and for its' future maintenance. Entity Relationship Diagram describes data elements and their relationships within a database. There are a set of special symbols that depict each element of an entity relationship diagram. Entities - represents some stable components such as supplier, employee, invoice, client, etc. Relation symbols show how the entities interact. Attributes define characteristics of the relationships. Attributes can be one-to-one or many-to-many. Physical symbols is used in the physical models. They represent items such as fields, tables, types and keys. ERD physical symbols are the building material for the database. Notation lines are used to illustrate the relationships. The most common method is Crow’s Feet notation. You can use ConceptDraw Entity-Relationship Diagram (ERD) solution to represent a database using the Entity-Relationship model.Entity Relationship Diagram Symbols
Picture: Entity Relationship Diagram Symbols
Related Solution:
The SWOT Analysis solution contains easy-to-use mind map templates that help identify Strengths, Weaknesses, Opportunities, and Threats, as well as outputs to ConceptDraw DIAGRAM for presenting analysis results.SWOT Analysis *
Picture: SWOT Analysis
Related Solution:
The recruitment process often requires design and use of various HR flowcharts, diagrams, attractive illustrations.Recruitment
Picture: Recruitment
Related Solution:
ConceptDraw
DIAGRAM 18