Managing your Sales Dashboard
Sales Dashboard Solution
The Sales Dashboard Solution allows users to monitor the contribution of the various departments in their organization and to capture and report specific data points from each department within the organization, thus providing a "snapshot" of performance. You can see a signs at the dashboards that in the business something is wrong or something is right.
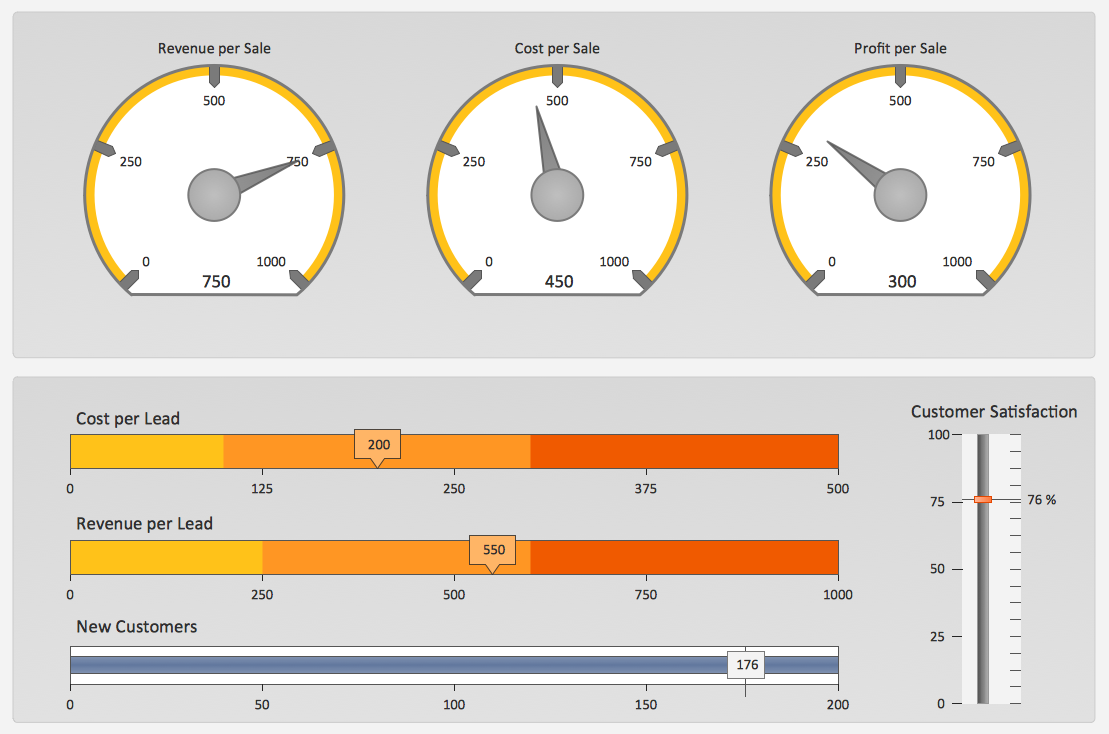
Pic. 1. Sales KPIs Dashboard
This sample was created in ConceptDraw DIAGRAM software using the Sales Dashboard Solution. This sample clearly demonstrates the Solution's capabilities and the results that you can achieve. All the charts on this page update automatically when the data source changes.
This sales dashboard visually displays company performance using different graphs. The comparison of measured and expected values are displayed on a separate graph. It's very convenient to track the purchases in the different regions using the pie chart. You can also see the graph of weekly sales, which can be easily modified to show monthly or daily sales, if needed.