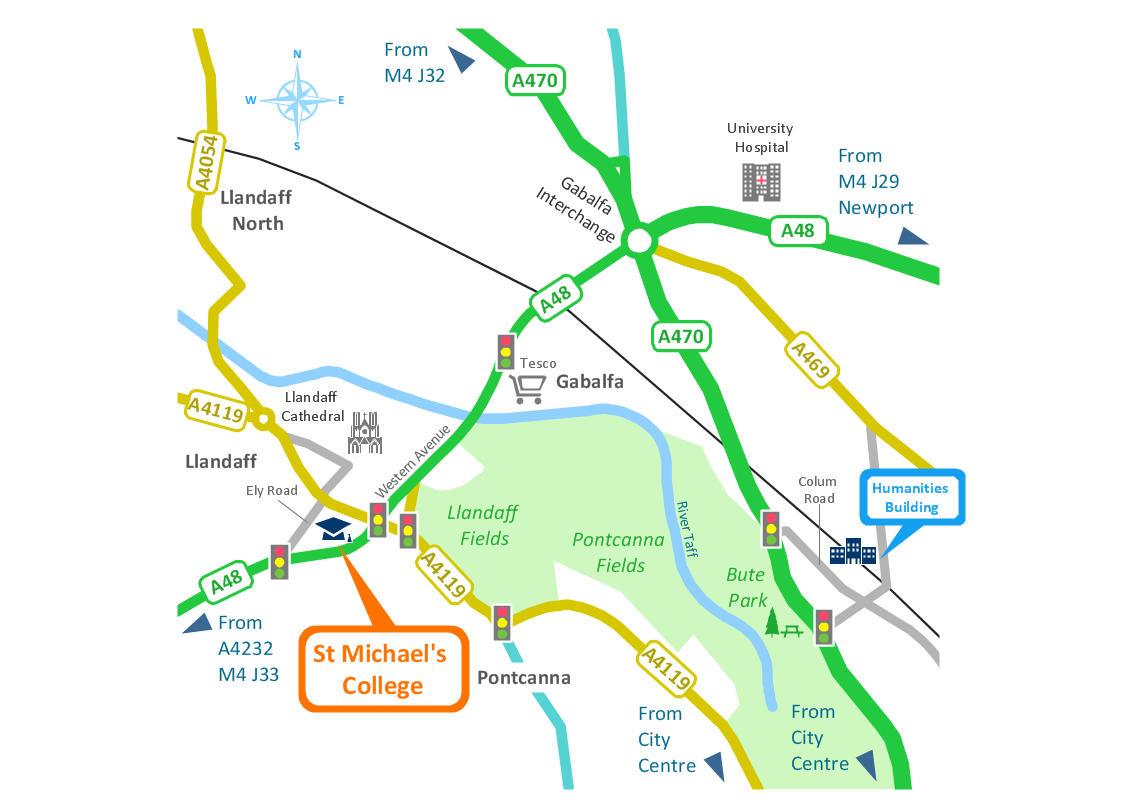
Sample 1. Conference centre location map - Spatial infographics.
Solution Spatial Infographics from ConceptDraw Solution Park extends ConceptDraw DIAGRAM ector diagramming and business graphics software with easy-to-use spatial infographics drawing tools.
This solution contains spatial infographics samples, map templates to be filled in, and libraries of vector stencils for main design elements of spatial infographics.
Use this solution to draw your own geospatial infographics documents with thematic maps, road maps, directional maps and transport maps.
SEVEN RELATED HOW TO's:
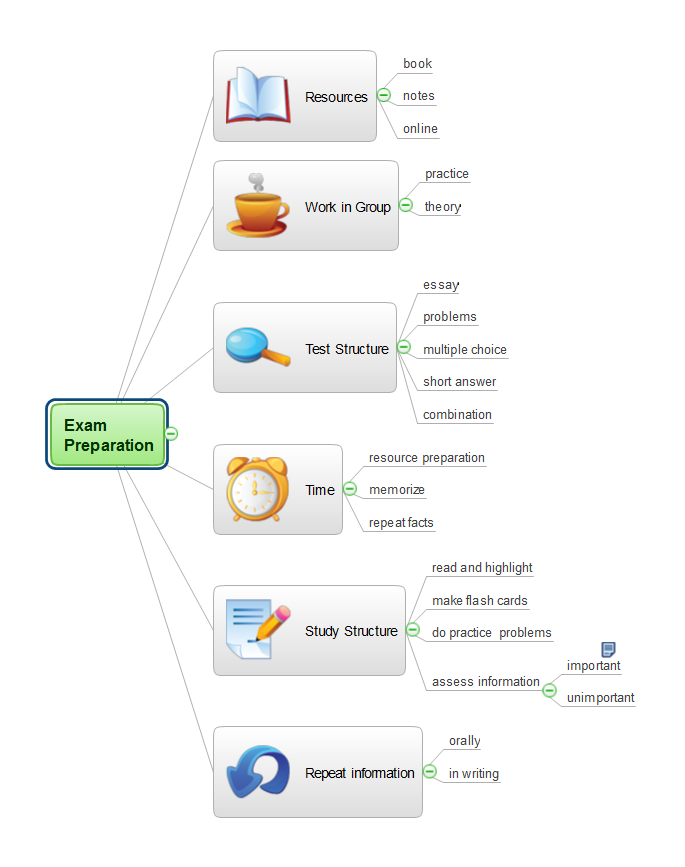
Picture: Exam Preparation Mind Map
Related Solution:
Network visualization is widely used by network and system administrators, and others computer and network-related specialists. Never before the process of network visualization wasn't so easy as now thanks to the Network Layout Floor Plans Solution from the Computer and Networks Area.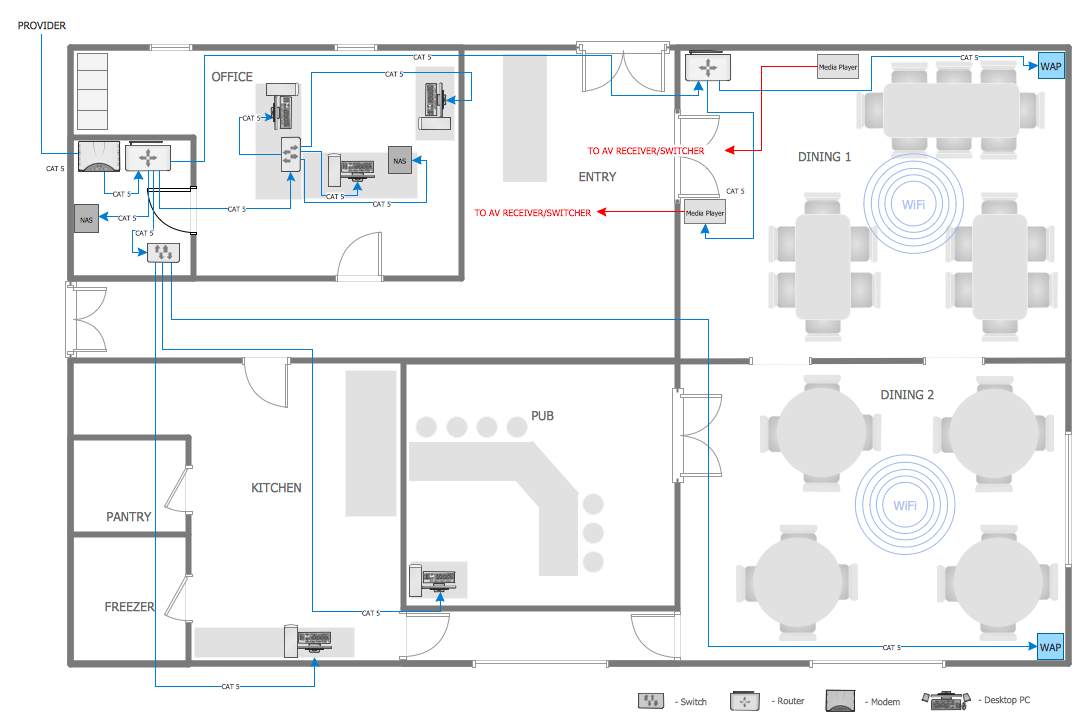
Picture: Network Visualization
Related Solution:
Data processing can be very complex sometimes. If you are interested in facilitating your work with data, it’s time to learn how to draw flowcharts with special software or using just a piece of paper. The list of flowchart basic symbols includes rectangles, diamond, ellipses etc. and is used to represent processes, actions, decisions or data processing.
A well-done flowchart bring the clearness of the sequence of a process stages. There are number of symbols that can be used in flow charts to show various sorts of steps. The basic flowchart can be created using a few of them: Process, Decision, Start/Finish. A basic element of a flowchart represents a simple action and looks like a box, that contains a description of the action. The depicting of actions sequence is made with arrows between corresponding action boxes, as you can see on the sample diagram. Also it shows the symbols for flowchart start and finish steps. ConceptDraw Flowcharts solution provides the ability to build basic flow charts as well as the ones of any size and complexity with a minimum of actions.
Picture: How to Draw a Flowchart: Step-by-Step Guide
Related Solution:
The Bubble Map is a popular tool for visualization a data set which is widely used in economics, medicine, software engineering, architecture, and many other fields. Each bubble on the Bubble Map is characterized by coordinates, color and size. ConceptDraw DIAGRAM diagramming and vector drawing software extended with Business Diagrams Solution from the Management Area is a powerful Bubble Map Maker.
Picture: Bubble Map Maker
Related Solution:
ConceptDraw DIAGRAM is a powerful sign making software thanks to the vector stencils library Recreation signs. This library is included in the Directional Maps solution from the Maps area of ConceptDraw Solution Park.
Sign making software is very useful tool for professional sign-making business. Use ConceptDraw DIAGRAM and make sure that now sign making is easier and timesaving than ever!
Picture: Sign Making Software
Related Solution:
Now anyone can build an infographics from their data using ConceptDraw.
Nice and simple, but the features it have are power-packed!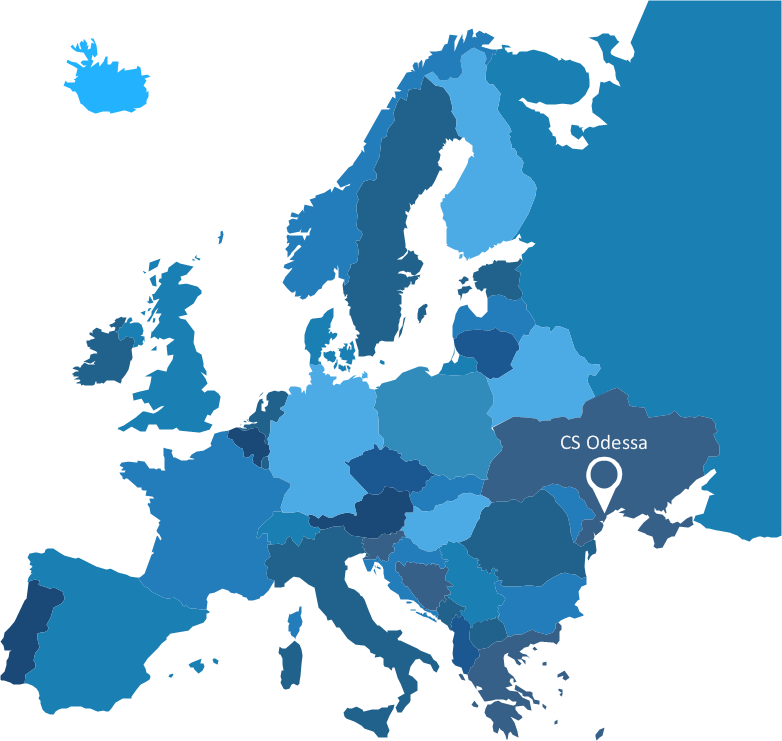
Picture: Visualization Spatial Data Using Thematic Maps Combined with Infographics
Great examples of Infographic Maps, they are needed for inspiration.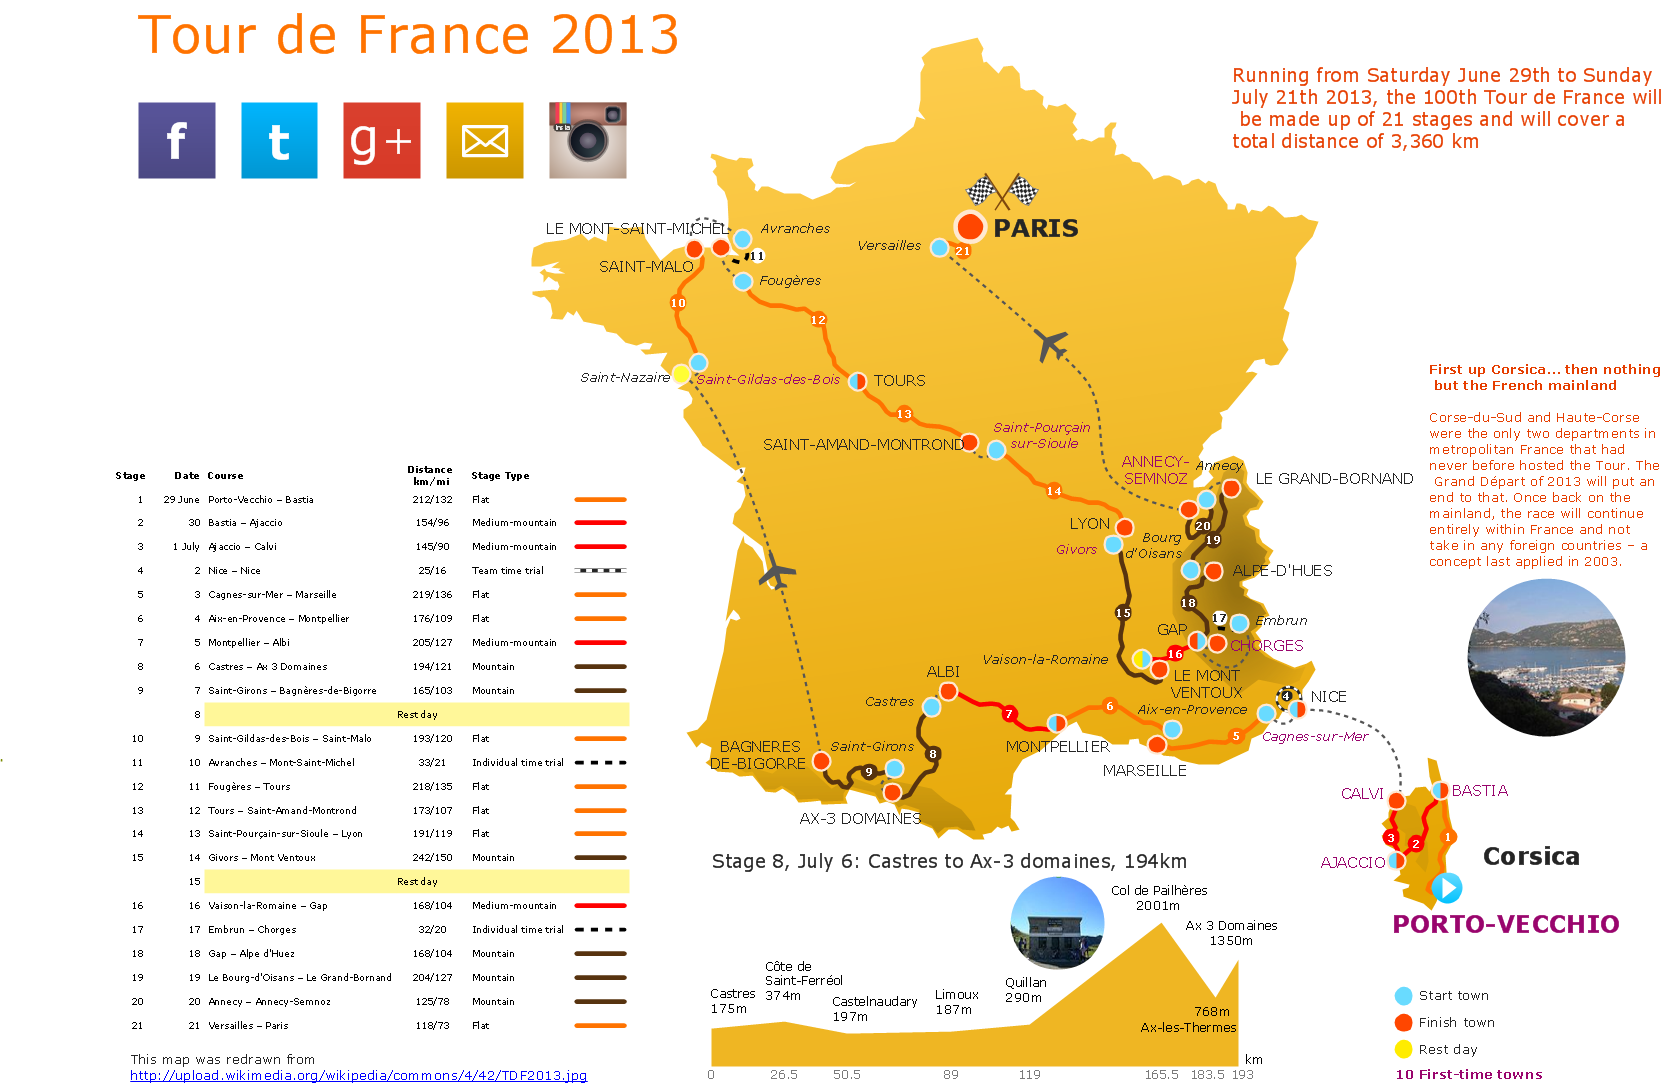
Picture: Superb Examples of Infographic Maps