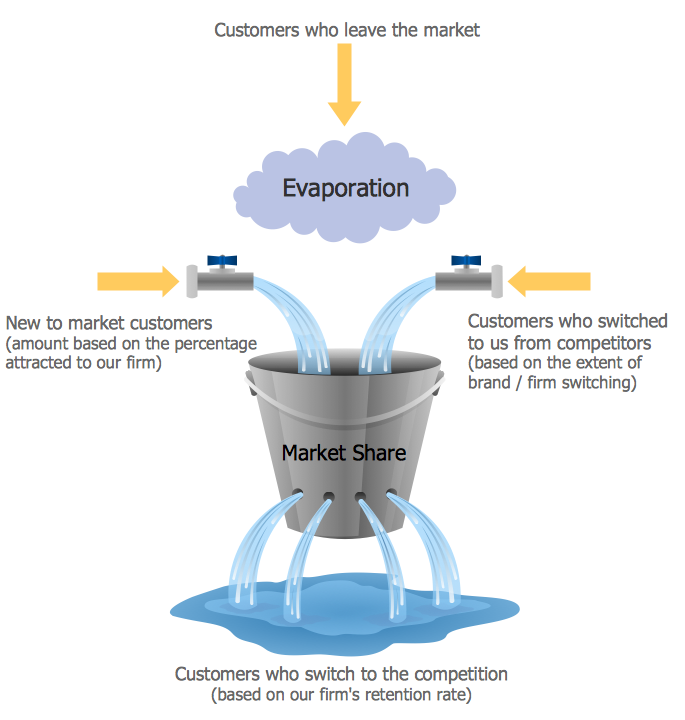
Example 1. Market Chart - Diagram Leaky Bucket
Marketing Diagrams Solution is ideal for drawing the Market Chart in minutes. You need to follow a few steps for this:
- create the new document,
- drag the required shapes from the Marketing Diagrams library included in Marketing Diagrams Solution and arrange them,
- type the text.

Example 2. Marketing Diagrams Library Design Elements
Marketing Diagrams library contains 11 ready-to-use vector objects. All they are vector objects, you can resize them without loss of quality, change their color to make your market chart more interesting, bright and attractive.

Example 3. Market Chart - Balanced Scorecard Strategy Map
The Market Chart samples you see on this page were created in ConceptDraw DIAGRAM using the tools of the Marketing Diagrams Solution for ConceptDraw DIAGRAM Solution Park. Each of these samples successfully demonstrates solution's capabilities and professional results you can achieve. An experienced user spent 5-10 minutes creating every of them.
Use the Marketing Diagrams Solution for ConceptDraw DIAGRAM software to create your own professionally designed marketing charts, marketing diagrams, market chart quick, easy and effective, and then successfully use them in work or education activity.
All source documents are vector graphic documents. They are available for reviewing, modifying, or converting to a variety of formats (PDF file, MS PowerPoint, MS Visio, and many other graphic formats) from the ConceptDraw STORE. The Marketing Diagrams Solution is available for all ConceptDraw DIAGRAM or later users.
NINE RELATED HOW TO's:
What is the ideal GUI interface? The interface of mobile device it's all that users see on it and can interact - screen, bars, icons of applications. So the interface is the first that draws the user's attention. The main goal of software engineers, GUI interface designers, and GUI developers is to make the interface first of all easy for perception and understanding, convenient and attractive for the users. The iPhone's GUI interface meets all these requirements.
Picture: GUI Interface
Related Solution:
This sample shows the Perceptual map. It was created in ConceptDraw DIAGRAM diagramming and vector drawing software using the Matrices Solution from the Marketing area of ConceptDraw Solution Park.
Perception Mapping helps organizations measure and transform all aspects of their business, people and culture. Perception Mapping allows to represent the complex relationships graphically, helps identify potential problems of the organization and make the best decisions.
Picture: Business Tools Perceptual Mapping
Related Solution:
When trying to figure out the nature of the problems occurring within a project, there are many ways to develop such understanding. One of the most common ways to document processes for further improvement is to draw a process flowchart, which depicts the activities of the process arranged in sequential order — this is business process management. ConceptDraw DIAGRAM is business process mapping software with impressive range of productivity features for business process management and classic project management. This business process management software is helpful for many purposes from different payment processes, or manufacturing processes to chemical processes. Business process mapping flowcharts helps clarify the actual workflow of different people engaged in the same process. This samples were made with ConceptDraw DIAGRAM — business process mapping software for flowcharting and used as classic visio alternative because its briefly named "visio for mac" and for windows, this sort of software named the business process management tools.
This flowchart diagram shows a process flow of project management. The diagram that is presented here depicts the project life cycle that is basic for the most of project management methods. Breaking a project into phases allows to track it in the proper manner. Through separation on phases, the total workflow of a project is divided into some foreseeable components, thus making it easier to follow the project status. A project life cycle commonly includes: initiation, definition, design, development and implementation phases. Distinguished method to show parallel and interdependent processes, as well as project life cycle relationships. A flowchart diagram is often used as visual guide to project. For instance, it used by marketing project management software for visualizing stages of marketing activities or as project management workflow tools. Created with ConceptDraw DIAGRAM — business process mapping software which is flowcharting visio alternative or shortly its visio for mac, this sort of software platform often named the business process management tools.
Picture: Process Flowchart: A Step-by-Step Comprehensive Guide
Related Solution:
The Pie Chart visualizes the data as the proportional parts of a whole and looks like a disk divided into sectors. The pie chart is type of graph, pie chart looks as circle devided into sectors. Pie Charts are widely used in the business, statistics, analytics, mass media. It’s very effective way of displaying relative sizes of parts, the proportion of the whole thing.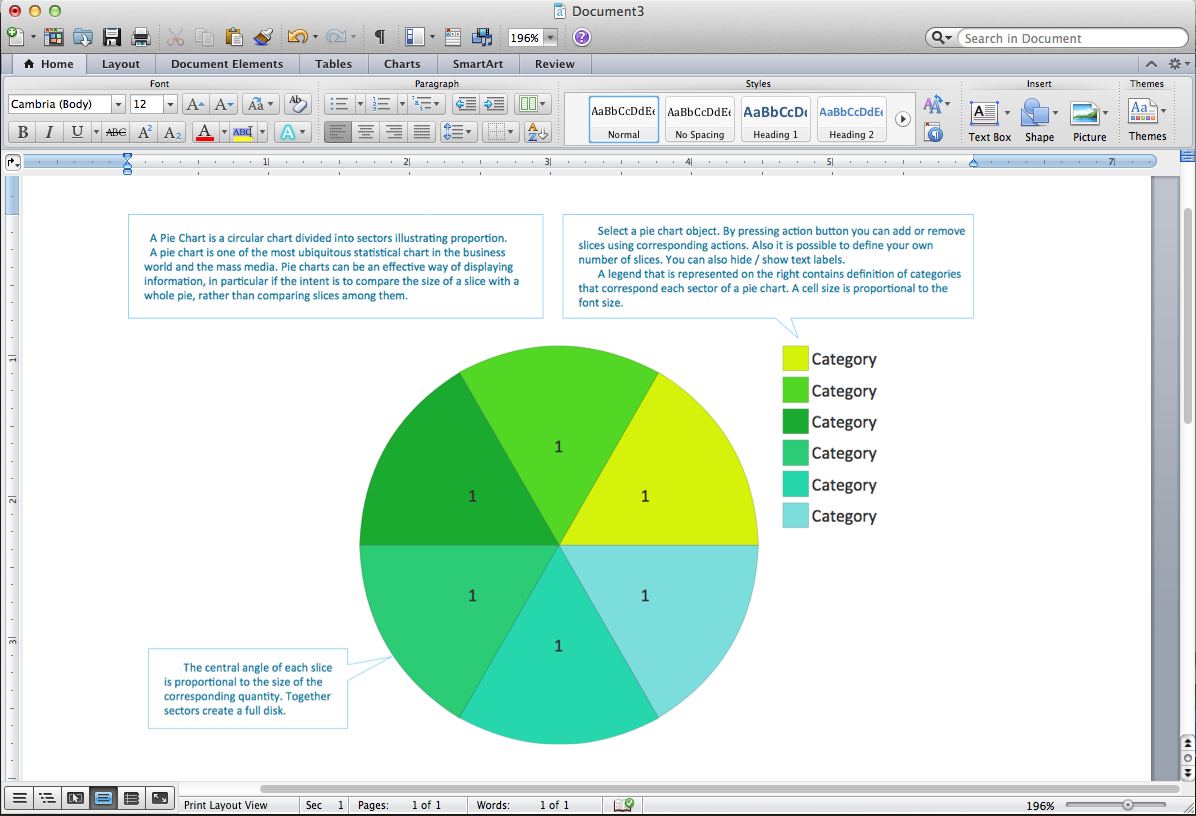
Picture: Pie Chart Word Template. Pie Chart Examples
Related Solution:
ConceptDraw DIAGRAM diagramming and vector drawing software offers the unique Business Process Mapping Solution from the Business Processes Area of ConceptDraw Solution Park. Powerful drawing tools of this solution make it effective Business Process Mapping software and help easy design professional looking business process diagrams and flowcharts.
Picture: Process Mapping
Related Solution:
Every good manager has to predict different situations that might occur in any process. If only every of them Swot Analysis Examples at that time, I could have succeeded in my career. Unfortunately I didn't have any notion about it.
This is a sample of SWOT diagram. This is also a mean of marketing strategy elaboration. Before as filling this table, marketing manager has to investigate both external and internal factors. The effective SWOT analysis helps to gain benefits from opportunities and decrease threats by conversion of strengths and weaknesses into advantage. The SWOT and TOWS Analysis solution to ConceptDraw offers a number of template matrices for SWOT, designed to support a marketing strategy development process.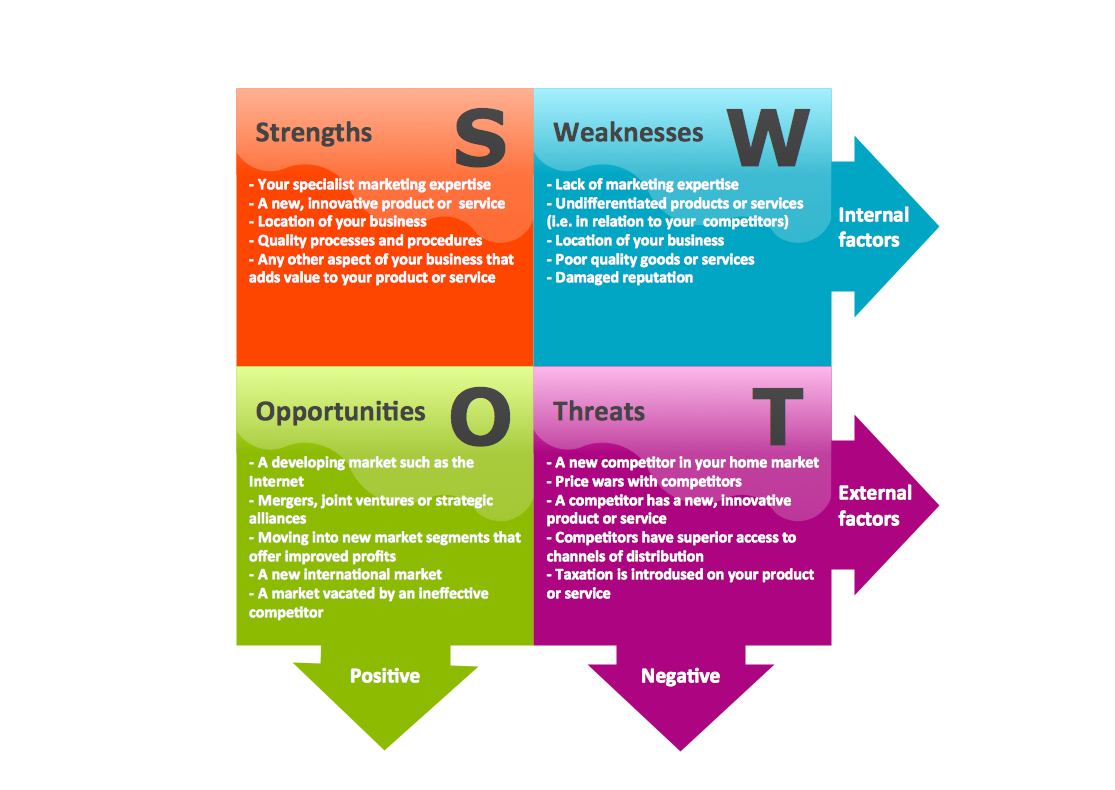
Picture: Swot Analysis Examples
Connecting objects manually in ConceptDraw DIAGRAM is a snap:
- points;
- Connecting groups of objects;
- Auto-routing;
- Connectors text;
- Snap to Guides ;
- Quick.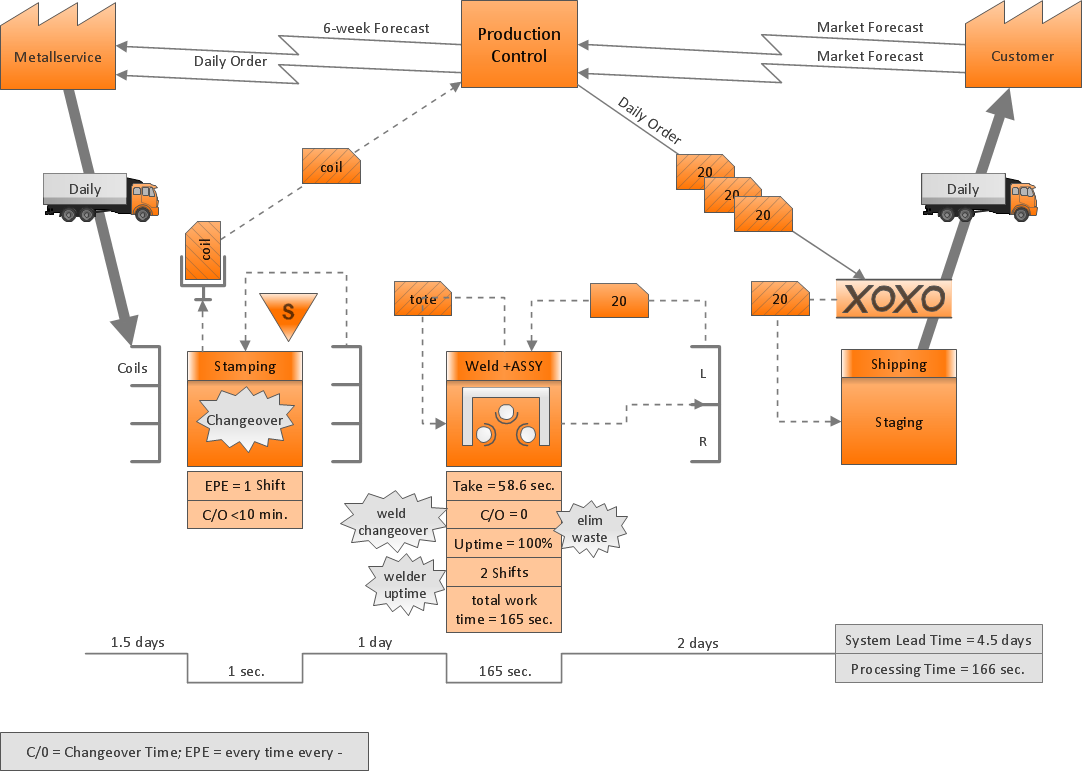
Picture: ConceptDraw Arrows10 Technology
Describing a workflow or approval process can take hours and be too complicated, especially since there are options to do it quickly and vividly. Diagrams called flowcharts replace long paragraphs of boring text and represent information in a graphic way. You can draw one on paper or you can use flowchart software to do it quickly and scalable. This kind of software is easy to use and you don’t need any special skills to start using it. In addition, there are a lot examples and predesigned templates on the Internet.
Flowcharts are a best tool for staking out a huge and complex process into some small readable parts. Surely, flowcharts can be drawn manually but the use of standard symbols that make it clear for a wide audience makes a software tool preferred for this task. The core for a successful flowchart is its simplicity. That is why often before beginning making flowchart through software, people draw the sketch on a piece of paper. Designing an effective flowchart means the combination of the data needed to be shown and the simplicity with which you depict it.
Picture: Flowchart Software: A Comprehensive Guide
Related Solution:
Many professionals have to solve problems every day. Designing of the process algorithm contribute to understand where the problem is in the process. A Flowchart is a graphical tool that most usable for breaking down processes.
Definition of flowchart - a diagram that shows step-by-step progression through a procedure or system especially using connecting lines and a set of conventional symbols.
All the icons, symbols and connectors needed for creating standardized notation flowcharts are contained within Software Flow Chart.
Picture: Software Flow Chart
Related Solution:

