Example 1. Marketing Flow Chart in ConceptDraw DIAGRAM /p>
Marketing Diagrams Solution provides the extensive drawing tools and Marketing Diagrams library with set of predesigned vector objects. These objects and also objects from other libraries of ConceptDraw Solution Park, including the Flowchart and Flowcharts
Rapid Draw libraries from the Flowcharts solution of "Diagrams" Area, will be useful for easy drawing a Marketing Flow Chart.

Example 2. Marketing Diagrams Library Design Elements
Another way of drawing a Marketing Flow Chart in ConceptDraw DIAGRAM software is to use as the base the predesigned template or sample. The whole collection of them is available from ConceptDraw STORE.

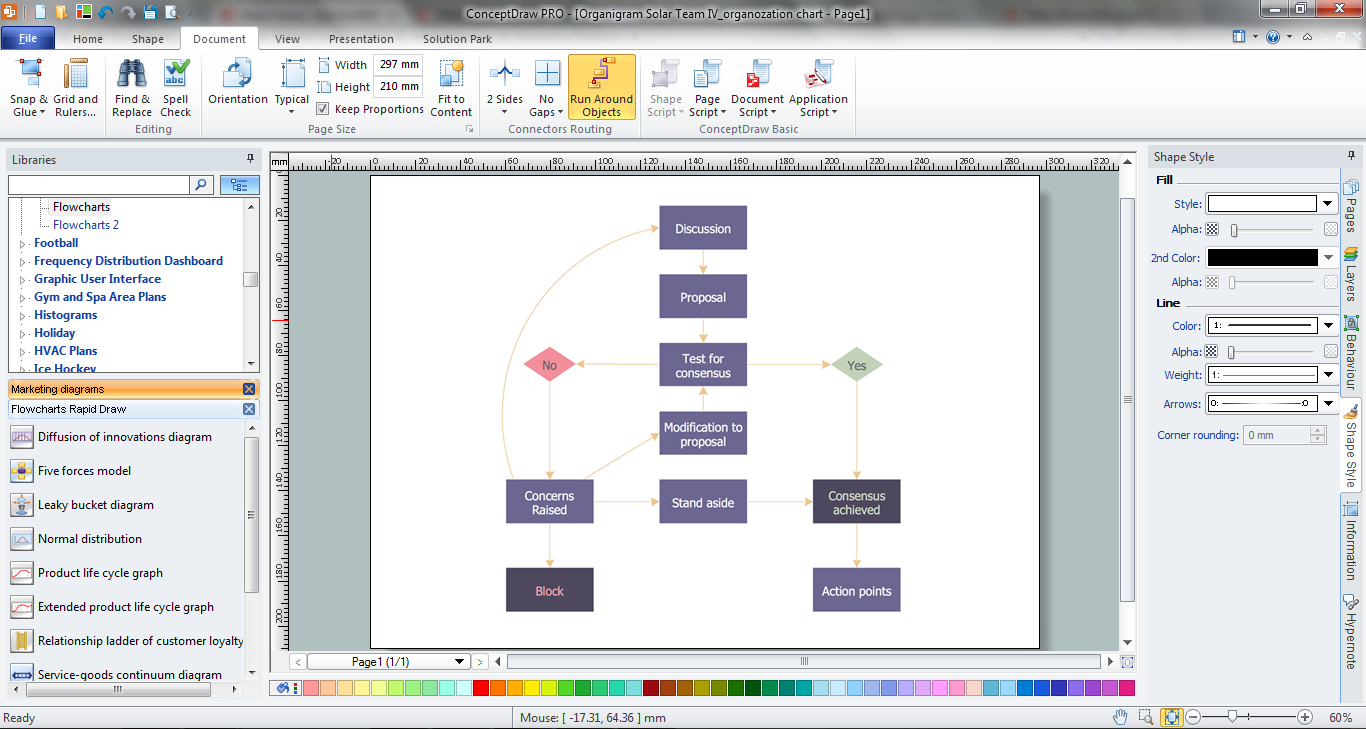
Example 3. Marketing Flow Chart - Consensus Decision Making
The Marketing Flow Chart sample you see on this page was created in ConceptDraw DIAGRAM software with help of Marketing Diagrams Solution for ConceptDraw DIAGRAM Solution Park. It effectively illustrates the consensus decision making process. An experienced user spent 5 minutes creating this sample.
Use the Marketing Diagrams Solution to create your own successful Marketing Flow Chart fast and easy.
All source documents are vector graphic documents. They are available for reviewing, modifying, or converting to a variety of formats (PDF file, MS PowerPoint, MS Visio, and many other graphic formats) from the ConceptDraw STORE. The Marketing Diagrams Solution is available for all ConceptDraw DIAGRAM or later users.
NINE RELATED HOW TO's:
Video tutorials on ConceptDraw products. Try it today!
Picture: How to Draw a Bubble Chart
Related Solution:
Target Diagram is a convenient and visual way of presentation information which is popular and widely used in marketing, business and economics. ConceptDraw DIAGRAM diagramming and vector drawing software extended with Target and Circular Diagrams solution from the Marketing area of ConceptDraw Solution Park is ideal for fast and easy drawing a Target Diagram.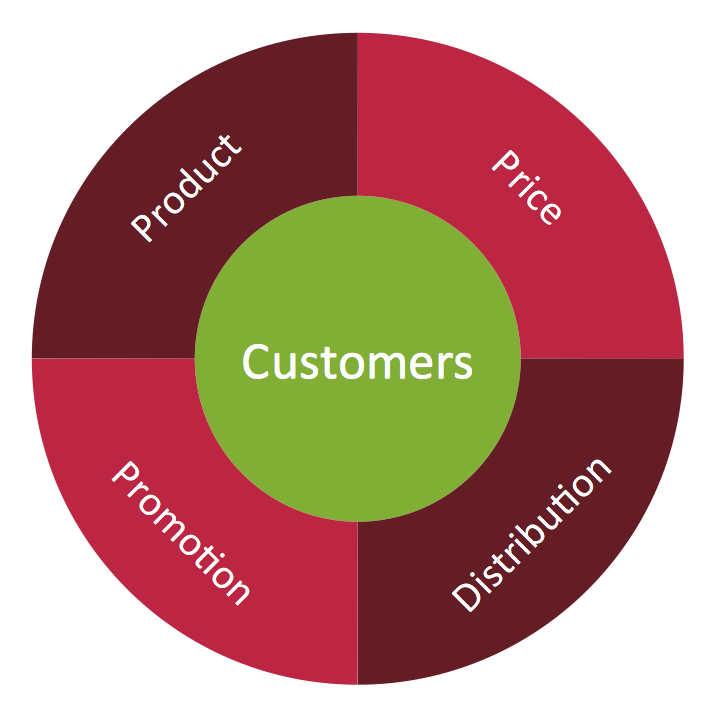
Picture: Target Diagram
Related Solution:
If you have decided to actively participate in social media, ConceptDraw really a choice.
Picture: How To Give Quick and Professional Responses to Social Media Mentions
Related Solution:
ConceptDraw is rapid and powerful network diagram drawing software with rich examples, templates, design objects and stencils.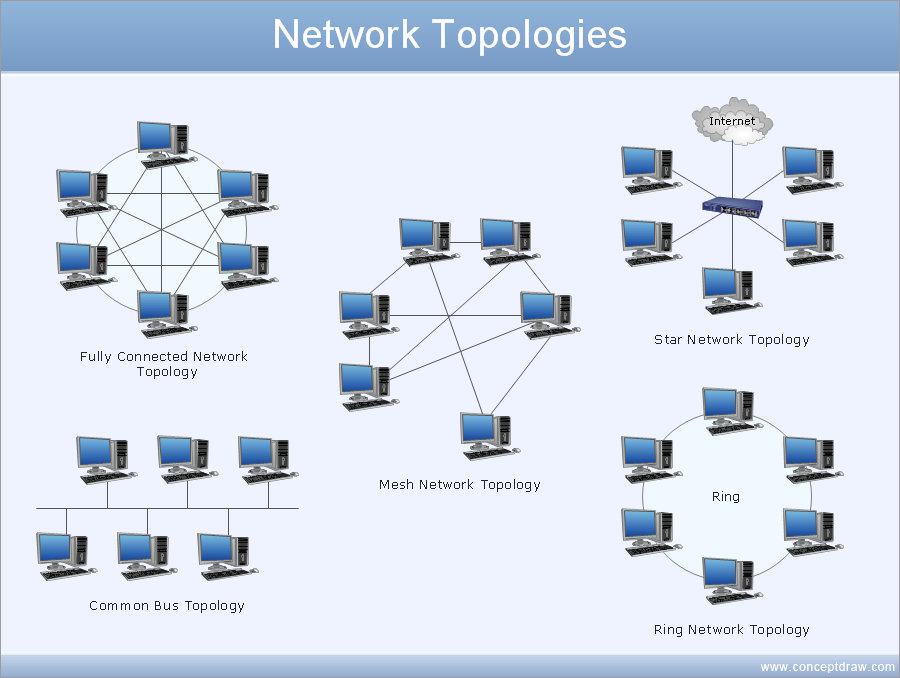
Picture: Draw Network Diagram based on Templates and Examples
A Data Flow Diagram (DFD) is a graphical technique which allows effectively model and analyze the information processes and systems. The ability to fast and easy create the DFDs is made possible with Data Flow Diagrams solution from the Software Development area of ConceptDraw Solution Park. For designing the Data Flow Diagrams are used simple DFD flowchart symbols which are connected each other by arrows depicting the data flow from one step to another.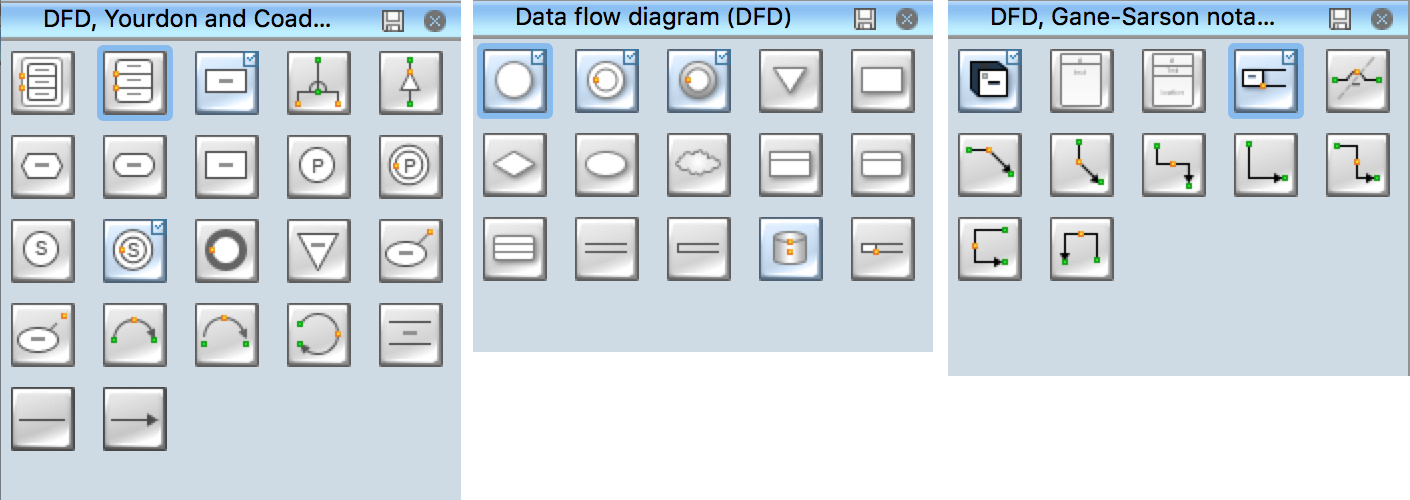
Picture: DFD Flowchart Symbols
Related Solution:
Everyone who starts the construction, repair or remodeling of the home, flat or office, is facing with a need of visualization its ideas for visual explanation how all should to be for the foreman and construction team. It is incredibly convenient to use for this professional home architect software. ConceptDraw DIAGRAM software enhanced with Floor Plans solution provides a lot of built-in drawing tools which allow you quick and easy create design plans for the home of your dreams.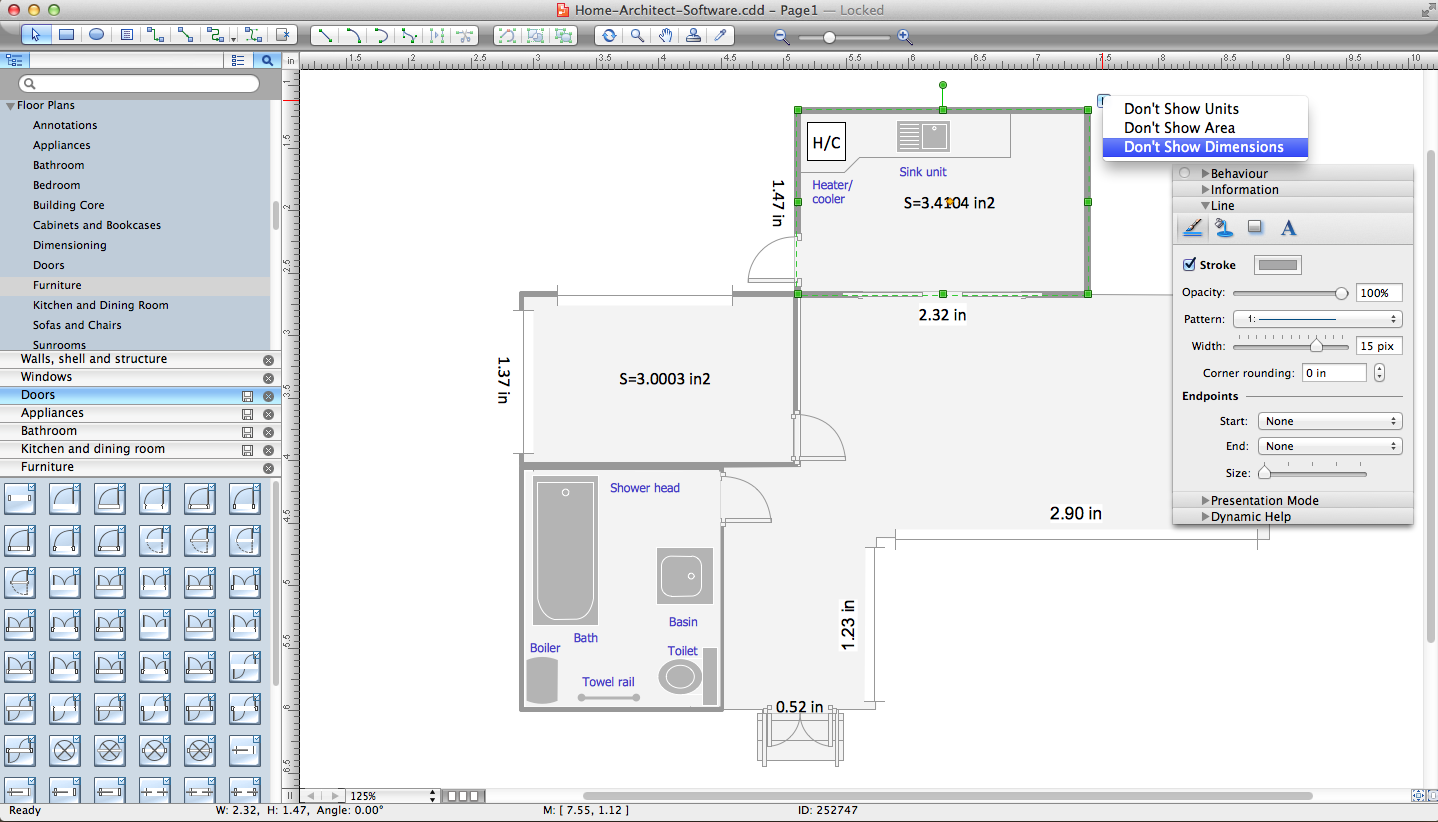
Picture: Home Architect Software. Home Plan Examples
Related Solution:
The human organism is so constituted that for a full life you need a wide range of nutrients, minerals and vitamins. To get all this, it is necessary to enrich your nutrition by natural and healthy food. The same microelements and nutrients are contained in different foods, so it is very important to create your own healthy diet plan, based on your preferences and containing the balance of nutrients suitable for you.
ConceptDraw DIAGRAM diagramming and vector drawing software extended with Health Food solution from the Food and Beverage area of ConceptDraw Solution Park contains powerful tools for designing healthy diet plan.
Picture: Healthy Diet Plan
Related Solution:
The Total Quality Management Diagram solution helps your organization visualize business and industrial processes. Create Total Quality Management diagrams for business process with ConceptDraw software.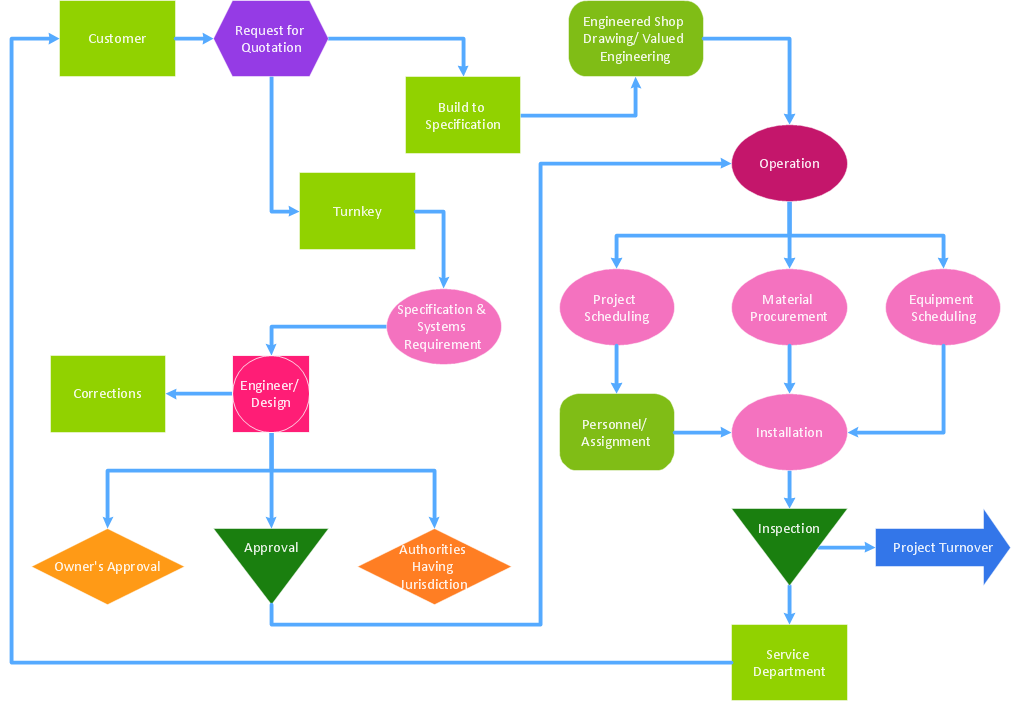
Picture: A Study of the Business Value of Total Quality Management
Related Solution:
Unified Modeling Language (UML) is a graphical modeling language for describing, visualizing, projecting and documenting of object oriented systems. UML digram is used for modeling of organizations and their business processes, for development the big projects, the complex software applications. Comprehensive UML diagram allows to create the set of interrelated documents that gives the complete visual representation of the modeling system.
Picture: UML Sample Project
Related Solution:

