Example 1. Mechanical Engineering - Directional Control Valve
First of all, Mechanical Engineering Solution is rich for the libraries. Here are represented their previews, you can consider them - simply click to enlarge.
This are 8 libraries with 602 vector mechanical symbols, use of them will help you design any mechanical engineering schematic at the new ConceptDraw document. Or you can successfully use the predesigned templates and samples also included in Mechanical Engineering Solution. All they are represented in ConceptDraw STORE and will become the good base and examples for you.

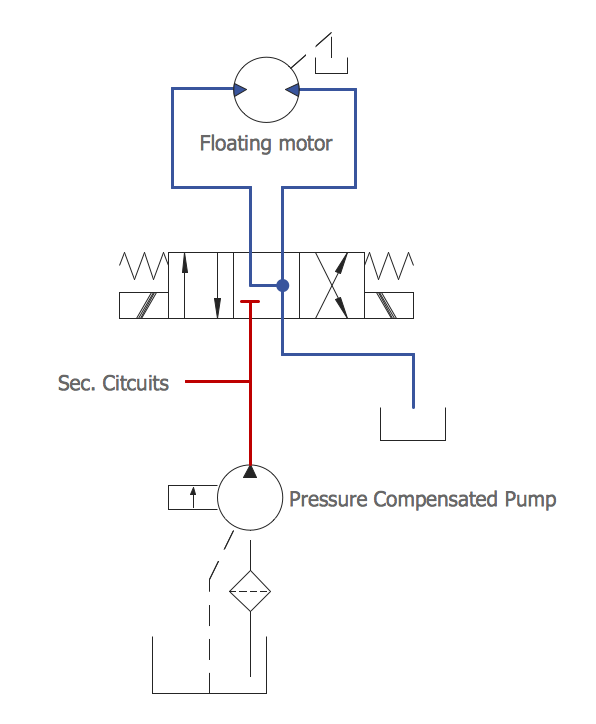
Example 2. Mechanical Engineering - Hydraulic Schematic
The mechanical engineering samples you see on this page were created in ConceptDraw DIAGRAM software using the tools of Mechanical Engineering Solution for ConceptDraw DIAGRAM Solution Park. These samples successfully demonstrate solution's capabilities and professional results you can achieve. An experienced user spent 5-10 minutes creating every of these samples.
Use the Mechanical Engineering Solution for ConceptDraw DIAGRAM software to create your own professional looking mechanical engineering diagrams and schemes of any complexity quick, easy and effective, and then successfully use them in your work activity.
All source documents are vector graphic documents. They are available for reviewing, modifying, or converting to a variety of formats (PDF file, MS PowerPoint, MS Visio, and many other graphic formats) from the ConceptDraw STORE. The Mechanical Engineering Solution is available for all ConceptDraw DIAGRAM or later users.
TEN RELATED HOW TO's:
Use ConceptDraw DIAGRAM software as powerful electrical engineering software and apply switches and relays electrical symbols in ✔️ electrical circuit diagrams, ✔️ electrical drawings, ✔️ electrical schematics, ✔️ wiring diagrams, ✔️ electrical blueprints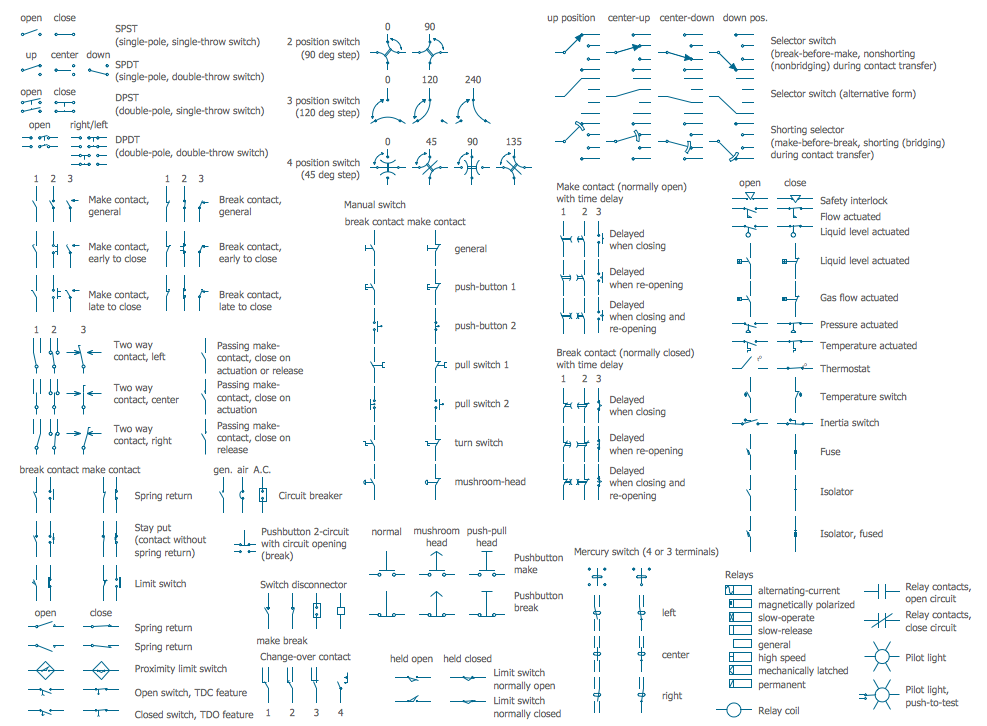
Picture: Electrical Symbols — Switches and Relays
Related Solution:
Any factory needs a clear scheme of all the equipment used in the manufacture processes. So, if you want to place all your machines and equipment on one diagram, you need a good diagramming tool for that. For instance, you can find all the design elements you might need, such as lathes, milling machines or saws on ConceptDraw DIAGRAM Solution Park in Plant Layout Plans solution in appropriate libraries.
This drawing represents the Machines and Equipment library delivered by ConceptDraw Plant Layout Plans solution. This vector library is supplied along with other libraries related to industrial architecture planning and interior design.
Just planning the proper facilities in a proper right place, allows to manufacture a product in the most effective and economic way. Objects containing in these libraries will be helpful for architects and engineers dealing with industrial buildings design. They are intended to use for designing layouts of plants, warehouses, manufacturing workshop etc.
Picture: Interior Design. Machines and Equipment — Design Elements
Related Solution:
The world-best Entity Relationship Diagram software suitable for professional ERD drawing is ConceptDraw DIAGRAM software extended with the Entity-Relationship Diagram (ERD) solution. This solution contains all libraries, templates and samples you may need for professional ERD drawing.
Picture: Entity Relationship Diagram Software
Related Solution:
ConceptDraw DIAGRAM is a powerful diagramming and vector drawing software. Extended with Chemical and Process Engineering Solution from the Industrial Engineering Area of ConceptDraw Solution Park, it became the best Chemical Engineering software.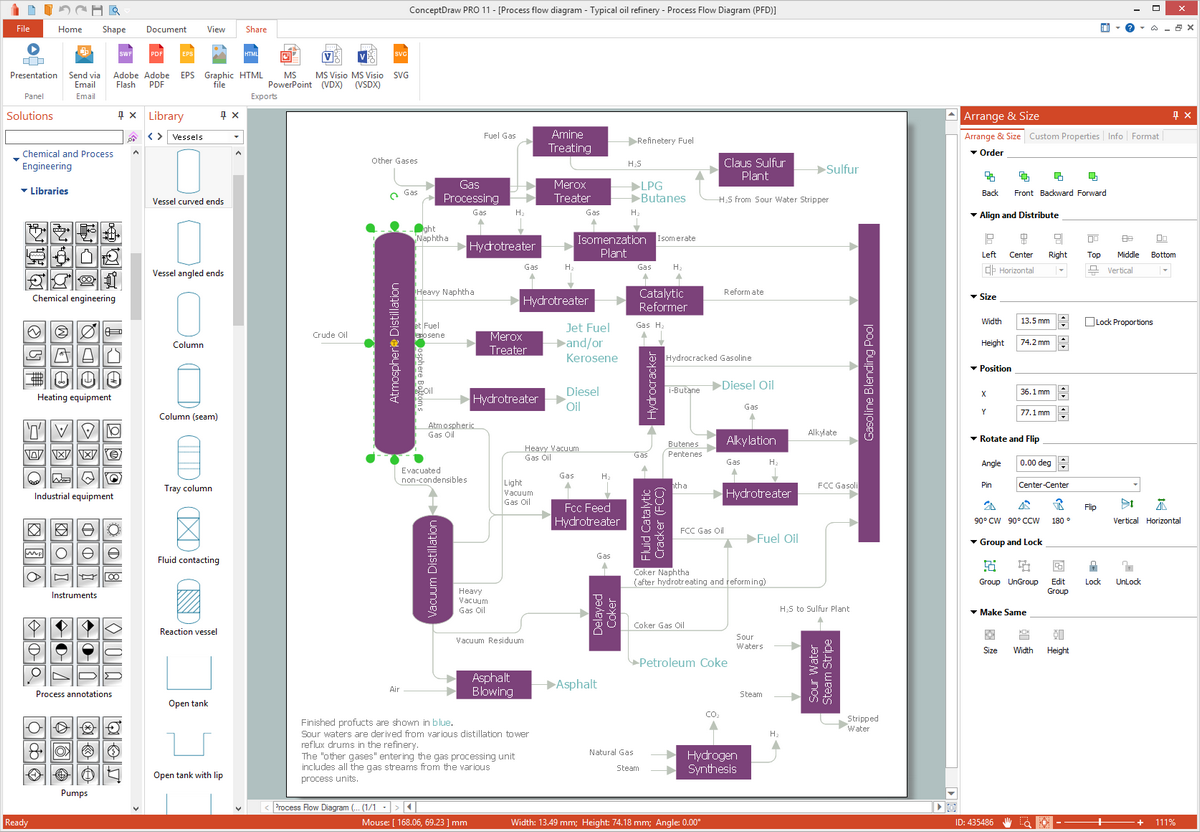
Picture: Chemical Engineering
Related Solution:
The Value Stream Map is one of the key tools of lean practitioners. It helps aptly describe the manufacturing processes both complex and simple. It supports process improvement, allows identifying waste, and reducing process cycle times. Use ConceptDraw DIAGRAM extended with Value Stream Mapping solution to document processes starting with a professionally designed Value Stream Mapping template.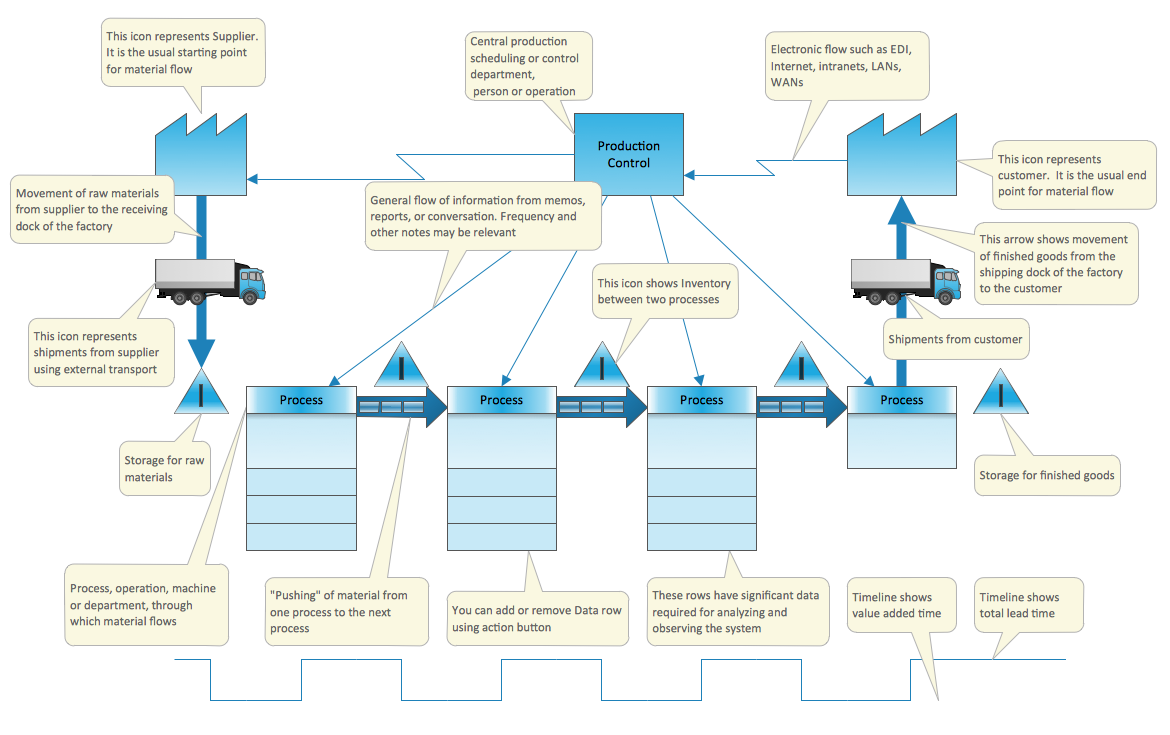
Picture: Value Stream Mapping Template
Related Solution:
When trying to figure out the nature of the problems occurring within a project, there are many ways to develop such understanding. One of the most common ways to document processes for further improvement is to draw a process flowchart, which depicts the activities of the process arranged in sequential order — this is business process management. ConceptDraw DIAGRAM is business process mapping software with impressive range of productivity features for business process management and classic project management. This business process management software is helpful for many purposes from different payment processes, or manufacturing processes to chemical processes. Business process mapping flowcharts helps clarify the actual workflow of different people engaged in the same process. This samples were made with ConceptDraw DIAGRAM — business process mapping software for flowcharting and used as classic visio alternative because its briefly named "visio for mac" and for windows, this sort of software named the business process management tools.
This flowchart diagram shows a process flow of project management. The diagram that is presented here depicts the project life cycle that is basic for the most of project management methods. Breaking a project into phases allows to track it in the proper manner. Through separation on phases, the total workflow of a project is divided into some foreseeable components, thus making it easier to follow the project status. A project life cycle commonly includes: initiation, definition, design, development and implementation phases. Distinguished method to show parallel and interdependent processes, as well as project life cycle relationships. A flowchart diagram is often used as visual guide to project. For instance, it used by marketing project management software for visualizing stages of marketing activities or as project management workflow tools. Created with ConceptDraw DIAGRAM — business process mapping software which is flowcharting visio alternative or shortly its visio for mac, this sort of software platform often named the business process management tools.
Picture: Process Flowchart: A Step-by-Step Comprehensive Guide
Related Solution:
System administrators of the whole world successfully use the Active Directory Domain Services. ConceptDraw DIAGRAM offers the Active Directory Diagrams Solution from the Computer and Networks Area with powerful drawing tools developed specially for all specialists which need create various active directory domain diagrams in their work activity.
Picture: Active Directory Domain
Related Solution:
The Value stream is a totality of all actions on the projection, order composition and production: starting from creation a product project to launching this product, from order to delivery, from extraction of raw materials to ready product manufacturing. Value stream mapping is a process of visualization of these actions and creation of a detailed and graphical map.
Picture: Value stream with ConceptDraw DIAGRAM
Related Solution:
ConceptDraw DIAGRAM diagramming and vector drawing software supplied with Chemical and Process Engineering Solution from the Industrial Engineering Area of ConceptDraw Solution Park is powerful and effective process engineering software.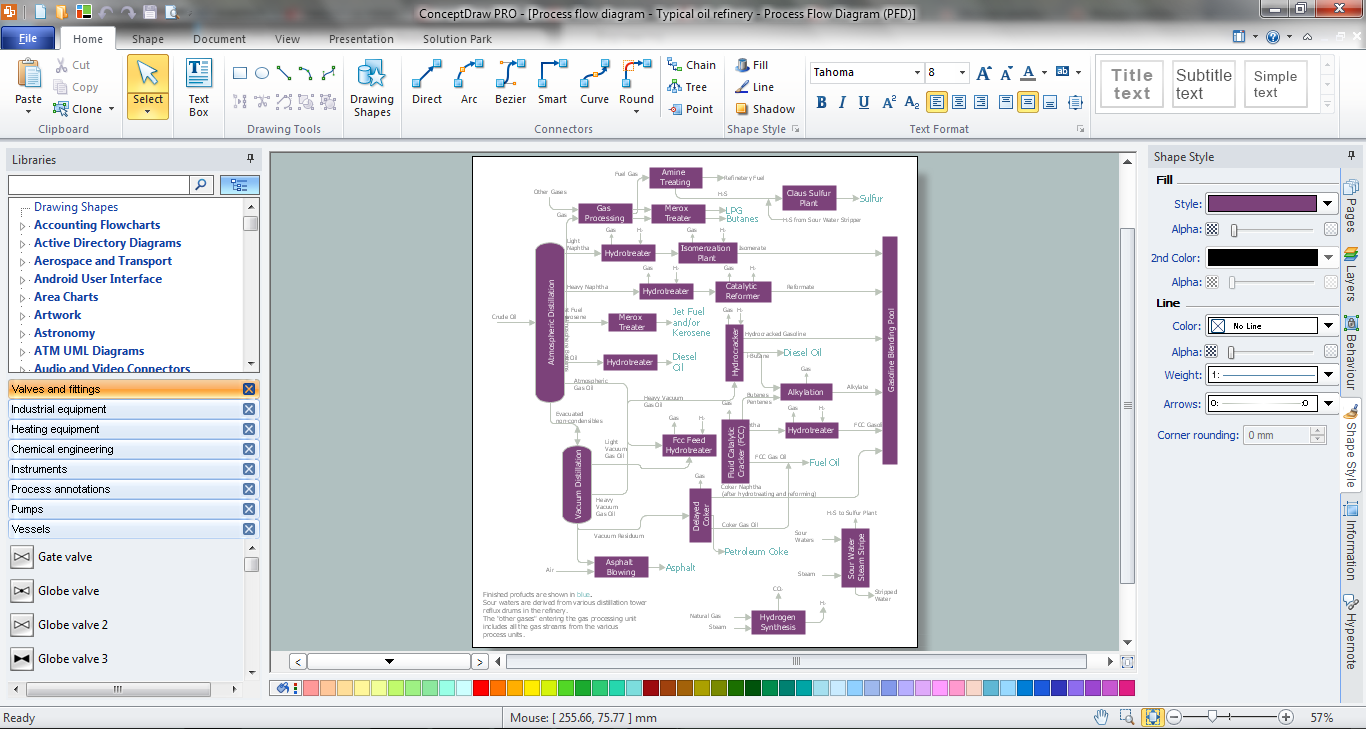
Picture: Process Engineering
Related Solution:
Computer-aided design (CAD) is the use of the computer software to create drawings. Today the large quantity of the technical drawings and architectural designs is created using the CAD software. CAD software makes the design process convenient, efficient and productive.
ConceptDraw DIAGRAM diagramming and vector drawing software allows you the possibility to draw your architectural designs quick, simple and effective.
Use the libraries with a set of vector objects, templates and samples from the Floor Plans Solution from the Building Plans area of ConceptDraw Solution Park for designing your professional architectural designs.

Picture: CAD Software for Architectural Designs
Related Solution:


