Made with
ConceptDraw
MINDMAP 16

7 Management & Planning Tools

Use 7 MP Tools for step-by-step analysis of problems and to plan corrective actions.

Problem analysis: structure problem affecting factors, analyze their cause and effect relations, highlight factor drivers and indicators, prioritize factors using ranking by criteria set, analyze factor root causes and develop corrective actions.

Action planning: define people and groups involvement in corrective actions by roles, identify logical sequences of scheduled actions and critical path of problem solving, identify possible risks of action plan and propose preventive actions.

Use visual communication during all steps of issue management to improve understanding and gain team involvement.

7 MP Tools

Example 1. 7 Management & Planning Tool


Benefits

The "7 Management and Planning Tools" solution implements well-known methodologies for problem analysis and solving. Different products from the ConceptDraw Office suite can be used as a complete solution for any of the methodologies in this solution. ConceptDraw Office provides visual communication during every stage of work.


Objective

Provide comprehensive tool for problem analysis that supports any of the methodologies.


Solution Purpose

Assists in the solving of common business problems by using a step-by-step methodology for problem identification, analysis, planning of solving actions and countermeasures to address risks.


Intended For

This comprehensive solution set is intended for managers in medium to large companies, who are looking for tools to address issue management. The 7 MP solution is intended for business consultants, trainers and coaches to visualize the problem solving by using 7 MP Tools methodology.


Products and methods

ConceptDraw MINDMAP is used for structuring, analyzing information. ConceptDraw DIAGRAM is used to generate ready-for-presentation documents and diagrams. ConceptDraw PROJECT is a powerful, prfessional tool for project planning and PERT chart generation.

7 Management & Planning Tools *

Example 2. Problem Analysis, Action Planning


The Benefits for ConceptDraw MINDMAP Software

  • ConceptDraw MINDMAP is effective for brainstorming, designing mind maps, idea generating, creative and lateral thinking, creativity and problem solving.
  • ConceptDraw MINDMAP is ideal for team and personal work in Business, Marketing and Project Management.
  • The libraries with large quantity of vector objects help to illustrate your mind maps and to make them bright, visual and comprehensible.
  • Use of View Navigator tool lets create presentations from a mind map: you can simply select the map parts you want to present, sequence your slides, and preview the presentation.
  • ConceptDraw MINDMAP provides wide capabilities of importing and exporting in various formats: Microsoft PowerPoint, Microsoft Word, MS Excel, Mindjet MindManager, image, HTML, PDF file.


TEN RELATED HOW TO's:
When we think of an hierarchy, we intuitively imagine a pyramid. Thus, a lot of management tools use pyramid charts as examples or illustrations of various documents or models. You can create any type of triangle diagram using ConceptDraw DIAGRAM. A triangle (pyramid) diagram is often used in marketing to show the data hierarchy. This pyramid diagram represents the Top Brand Model. It illustrate the model of rebranding strategy. It can be used by marketing agency dealing with rebranding strategies development. It’s critical for marketing diagrams to be both clear and eye catching. ConceptDraw Pyramid diagrams solution meet all these requirements and can be successfully applied for creating and presenting various marketing pyramidal diagrams.Pyramid Chart Examples *
Picture: Pyramid Chart Examples
Related Solutions:
This method of problem analysis is widely used in IT, manufacture industries and chemical engineering. If you want to take a fresh look on your problem, you can draw a fishbone diagram with ConceptDraw DIAGRAM software, which supports both MAC OS and Windows. You can see and download fishbone diagram samples and templates in ConceptDraw Solution Park. This Fishbone (Ishikawa) diagram can be applied as template for performing the cause and effect analysis of a service industry problems. It can help to determine factors causing problems. Causes in this diagram are categorized according to the 4S’s principle that means Surroundings, Suppliers, Systems and Skills. Grouping causes allows to reveal main interactions between different events. This diagram was made using ConceptDraw Fishbone diagrams solution. It can help to reveal the causes effected a complicated issue. Of course it can be used together with other methods of approaching to the problem solving.Draw Fishbone Diagram on MAC Software *
Picture: Draw Fishbone Diagram on MAC Software
Related Solution:
The affinity diagram is a business tool used to organize ideas and data. It is one of the Seven Management and Planning Tools. But how design the Affinity Diagram quick and easy? ConceptDraw DIAGRAM diagramming and vector drawing software offers the Seven Management and Planning Tools Solution from the Management Area.Affinity Diagram *
Picture: Affinity Diagram
Related Solution:
Analyze the root causes of factors that influence the problem. A diagram is constructed separately for each high priority factor. Identify the root causes for a factor and then propose possible corrective actions. The diagram displays the structure of causes for a factor and possible corrective actions. The Root Cause Analysis Tree Diagram is used for further formulation of actions.Root Cause Tree Diagram *
Picture: Root Cause Tree Diagram
Related Solution:
The Social Media Response solution provides the means to respond to social media mentions quickly and professionally. This tool keeps the entire team on the same page allowing you to realize your social media strategy, improve the quality of your answers, and minimize the time it takes to respond.Manage Social Media Response Plan DFD *
Picture: Manage Social Media Response Plan DFD
Related Solution:
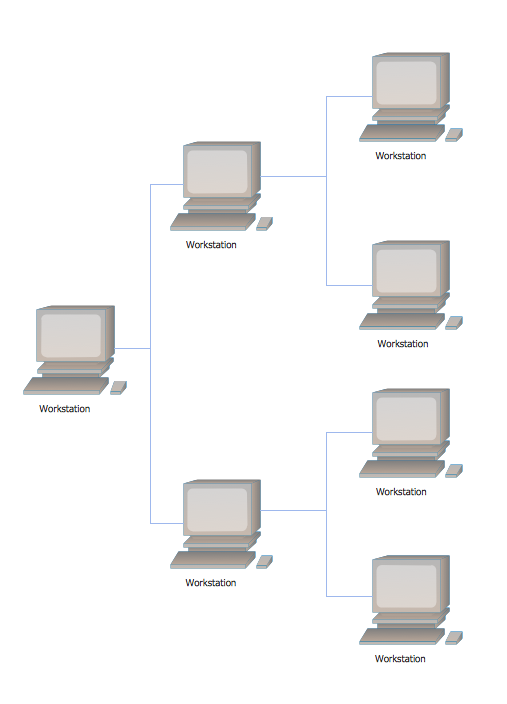
When designing a network, it is important to take into account the hierarchy of network devices. When you have a root device you should consider a tree network topology that might have any number of lower levels as you might need. This technology is based on star and bus network topologies. This is a schematic representation of a Tree computer network topology. A tree topology means that some star networks are linked together. A star network is a topology of the local network where a central workstation is connected with each end-user computer or peripherals. A tree structure means that, the central nodes of these star networks are linked to a main cable (the Bus topology). So, a Tree network topology is a few Star networks connected into a Bus topology. This scheme can be applied to draw the particular physical or logical network diagrams using the ConceptDraw Computer and Networks solution.Tree Network Topology Diagram *
Picture: Tree Network Topology Diagram
Related Solution:
Event-Driven Process Chain Diagrams for improvement throughout an organisation. ConceptDraw DIAGRAM - software that reduces the time needed to create a business process model.EPC for Configuring an Enterprise Resource Planning *
Picture: EPC for Configuring an Enterprise Resource Planning
Related Solution:
A flowchart is a powerful tool for examining processes. It helps improving processes a lot, as it becomes much easier to communicate between involved people, to identify potential problems and to optimize workflow. There are flowcharts of different shapes, sizes and types of flowchart vary from quite basic process flowcharts to complex program flowcharts. Nevertheless, all these diagrams use the same set of special symbols like arrows to connect blocks, parallelogram to show data receiving or rectangles for showing process steps. Basic flowcharts are used to represent a simple process algorithm. A basic flowchart notation consists of rectangles (business processes), arrows (the flow of information, documents, etc.). The same notation is used in items such as the "decision", which allow you to do the branching. To indicate the start of the entire business process and its termination can be used the "Terminator" element. The advantages of Basic Flowchart are simplicity and clarity. With it you can quickly describe the business process steps. Creating of Basic Flowchart does not require any special knowledge, as easily understand by employees with different levels of education and IQ.Types of Flowchart - Overview
Picture: Types of Flowchart — Overview
Related Solution:
ConceptDraw
MINDMAP 16