Quality meeting
QualityIn Solutions from Quality Management Area we support quality and manufacturing managers with visualization tools for production quality control and improvement. The solutions from Quality Management Area extend ConceptDraw DIAGRAM software with Quality Diagrams. Quality mind mapsThis solution extends ConceptDraw MINDMAP software with Quality Management Mind Maps (Presentations, Meeting Agendas, Problem to be solved). |
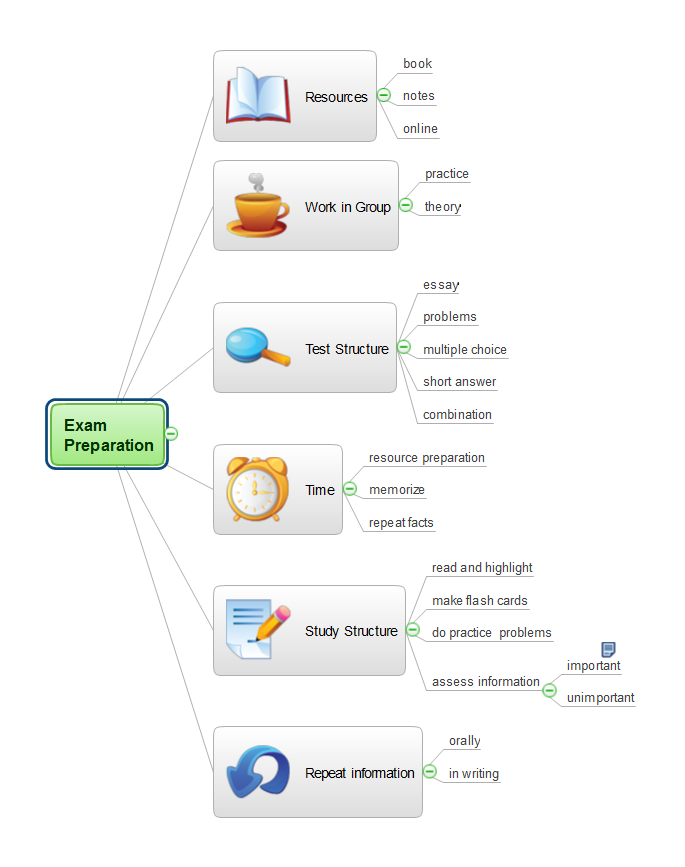
With this mind map template, you can quickly prepare for quality meetings by filling in the appropriate fields. By using this mind map to take notes during the meeting, you'll be able to send a one-page summary to meeting participants or use later to present the material, yourself, to a different audience.

Example 1. Quality meeting
Export to Outline
Product / Service Quality Meeting
- Product / Service
- Date
-
Minutes
-
Quality Status
- Time Limit
-
Defects and Root Causes
- Time Limit
-
Discussion: Corrective Actions
- Time Limit
-
Quality Status
- Start and Finish Time
- Place
- Facilitator
-
Documents to read
- Document
- Document
-
Attendees
- Name
- Name
- Name
- Name
- Name
-
Decisions
- Corrective Action
- Corrective Action
- Corrective Action
The Benefits for ConceptDraw MINDMAP Brainstorming Software
- ConceptDraw MINDMAP is effective for brainstorming, designing mind maps, idea generating, creative and lateral thinking, creativity and problem solving.
- ConceptDraw MINDMAP is ideal for team and personal work in Business, Marketing and Project Management.
- The libraries with large quantity of vector objects help to illustrate your mind maps and to make them bright, visual and comprehensible.
- Use of View Navigator tool lets create presentations from a mind map: you can simply select the map parts you want to present, sequence your slides, and preview the presentation.
- ConceptDraw MINDMAP provides wide capabilities of importing and exporting in various formats: Microsoft PowerPoint, Microsoft Word, MS Excel, Mindjet MindManager, image, HTML, PDF file.
THREE RELATED HOW TO's:
Now we have the best flow chart maker online design software - ConceptDraw DIAGRAM enhanced with Flowcharts Solution.
Picture: Flow Chart Online
Related Solution:
A causal model is an abstract concept, that describes the causal mechanisms of a system, by noting certain variables and their influence on each other, in an effort to discover the cause of a certain problem or flaw. This model is presented in diagram form by using a fishbone diagram.
ConceptDraw DIAGRAM diagramming and vector drawing software enhanced with Fishbone Diagrams solution helps you create business productivity diagrams from Fishbone diagram templates and examples, that provide to start using of the graphic method for the analysis of problem causes. Each predesigned Fishbone Diagram template is ready to use and useful for instantly drawing your own Fishbone Diagram.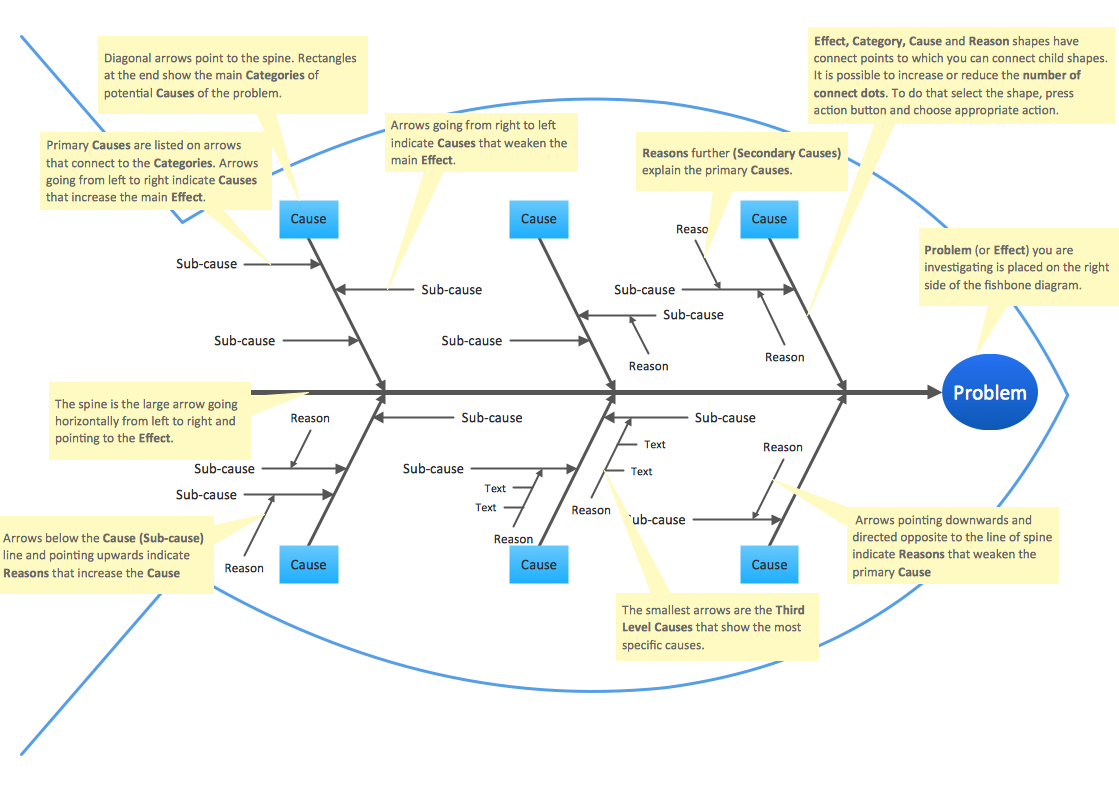
Picture: Fishbone Diagram Template
Related Solution:
ConceptDraw
MINDMAP 16