Made with
ConceptDraw
MINDMAP 16

Risk Diagram (Process Decision Program Chart)

Risk Diagram (Process Decision Program Chart)

Process Decision Program Chart (PDPC) is a commonly used technique that was designed in order to help prepare the contingency plans. The emphasis of the PDPC is identifying the consequential impact of failure on activity plans as well as creating the appropriate contingency plans in terms of limiting the risks. Planning to make the tree diagrams and/or the process diagrams can be extended by a couple of levels when the PDPC can be applied to the bottom level tasks on those diagrams.

Any contingency plan is a plan that is known to be devised for an outcome other than in the usual, an expected plan. Being often used for a risk management in case some exceptional risk would have some catastrophic consequences. The contingency plans can often be devised by different businesses or governments. Thus, in case there are many employees of a company that are traveling together on an aircraft and it crashes, it kills all aboard.

Same way, the company could be ruined or severely strained by such a loss. But nowadays a lot of the companies have the procedures to follow in the event of such a disaster. The mentioned plan may include the standing policies to mitigate a disaster's potential impact, such as limiting the number of employees on any one aircraft or requiring the employees to travel separately from each other.

The contingency plans during times of crisis are often developed in order to explore as well as to prepare for any eventuality. Many governments during the Cold War made the previously described contingency plans for protecting themselves as well as their citizens from the nuclear attack. Today the contingency plans are still in place for dealing with any terrorist attacks or other catastrophes.

Risk Diagram (Process Decision Program Chart) *

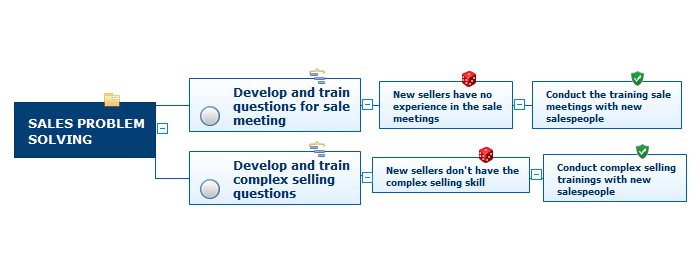
Example 1. Sales Problem Solving

The Process Decision Program Chart (PDPC), that can be created both in ConceptDraw DIAGRAM and ConceptDraw MINDMAP application, from the bottom level of some activity box adds levels for identifying the consequences of some failure after it is clarified what exactly went go wrong as well as finding out the possible countermeasures (the so-called risk mitigation action plan).

Risk management is known to be the assessment, the prioritization and the identification of risks being defined in ISO 31000 as “the effect of uncertainty on objectives”. Any risk management activity is known to be followed by both economical and coordinated application of different resources to monitor, to control as well as to minimize the probability or the impact of some unfortunate events. It can be also done for a reason of maximizing the realization of different opportunities.

Any risk management’s objective is known to be the process of assuring some uncertainty that does not deflect any endeavor from the business goals. Different risks can come from different sources. The uncertainty in financial markets same as the threats from the project failures are all risks, same as the legal liabilities, the accidents, the natural disasters, the events of some uncertain or some unpredictable root-cause, same as the credit risks.

Some of the risk management standards have been criticized for having no measurable improvement on a risk. At the same time, the confidence in decisions and estimates seems to increase. Making the mindmaps with the help of either ConceptDraw DIAGRAM or ConceptDraw MINDMAP software is a way of representing the situation some company is in as well as a way of helping the things go the way they are expected to by the employees who work in this organization, taking into consideration the risks as well as the main objective of the projects or company’s existence.

Any mind map is simply a diagram that is usually used for visual organization some information. A mind map is always hierarchical, showing the relationships among many different pieces of the whole. Being created around a single concept and drawn as a usually large image in the center of some blank page, a mindmap is a commonly used as well as a very popular drawing to make by using the ConceptDraw MINDMAP application — one of the numerous drawing applications for creating the needed schemes.

Any associated representations of the key ideas such as images, parts of the words as well as the whole words can be added to any needed mindmap to be made. The main ideas are known to be connected directly to the central concept, and other ones are known to be branched out from those which are decided to be the key ones. Any mind map can be also drawn by hand being considered to be a type of a spider diagram, but making such drawing by using the professionally developed application such as a ConceptDraw MINDMAP is much simpler making it possible to finish with the needed drawing within only a few minutes.

Mentioning the steps of any problem-solving in a way of a chart or a mind map is the best way to do rather than writing about the solutions even though some tables are used. Any representation of any information in a way of an illustration, such as a chart, a scheme, a mindmap or a diagram, is what can be understood the best as it was proven for many times that having the data to be explained it was always better to make it all clarified by putting its parts in order with some flowchart drawn.



TEN RELATED HOW TO's:
ConceptDraw MINDMAP has a addition to the ConceptDraw Solution Park that provides a creative approach to visualizing quality processes, Quality Mind Map Solution.Mind Mapping in the Quality Management *
Picture: Mind Mapping in the Quality Management
Related Solution:
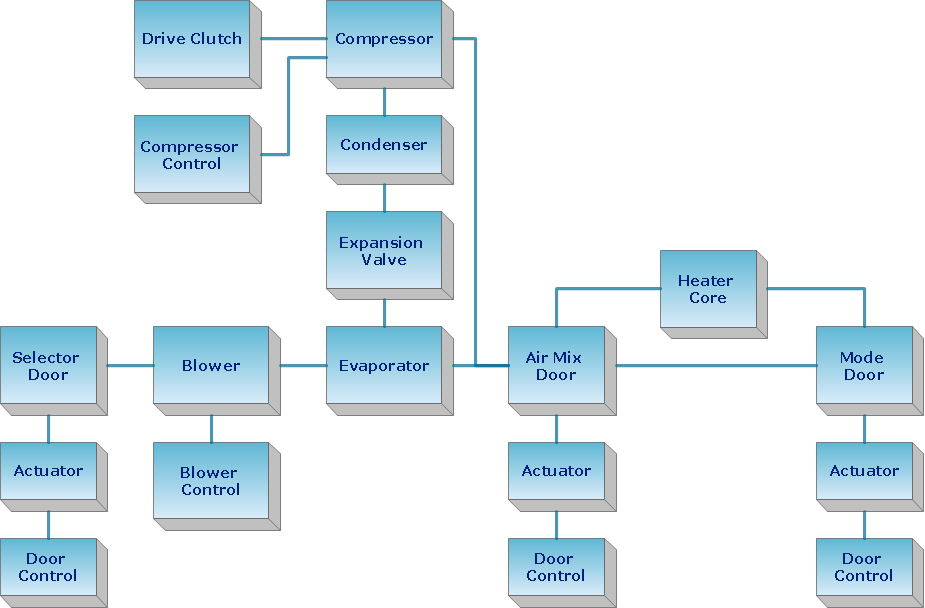
This sample was created in ConceptDraw DIAGRAM diagramming and vector drawing software using the Organizational Charts Solution from the Management area of ConceptDraw Solution Park. The Organizational Chart is a diagram that shows the structure of the organization, different levels of management, hierarchy and the relationships of the organization parts.Horizontal Org Flow Chart *
Picture: Horizontal Org Flow Chart
Related Solutions:
Process Decision Program Chart (PDPC) is a commonly used technique that was designed in order to help prepare the contingency plans. The emphasis of the PDPC is identifying the consequential impact of failure on activity plans as well as creating the appropriate contingency plans in terms of limiting the risks. Planning to make the tree diagrams and/or the process diagrams can be extended by a couple of levels when the PDPC can be applied to the bottom level tasks on those diagrams.Risk Diagram (Process Decision Program Chart) *
Picture: Risk Diagram (Process Decision Program Chart)
Related Solution:
How should diagramming software work? The answer is - Fast and easy. Tree- mode drawing works like that. Just select objects in your drawing and press Tree or Chain button to connect all of them just in one click. Your diagram looks professional and it took only a moment to draw.ConceptDraw Arrows10 Technology *
Picture: ConceptDraw Arrows10 Technology
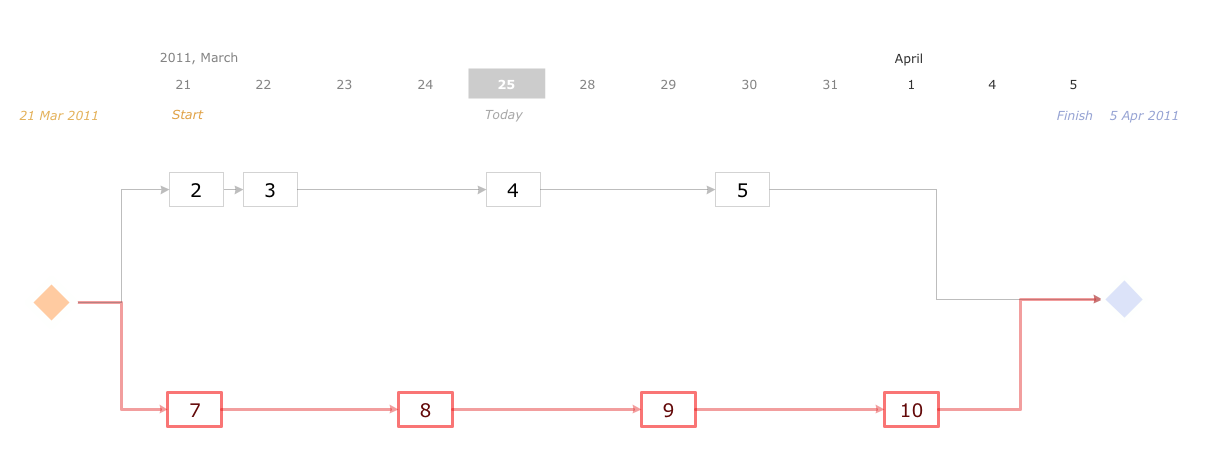
Activity Network and Project Evaluation and Review Technique, or PERT, charts are a way of documenting and analyzing the tasks in a project. This diagram is constructed as part of the process in creating a schedule of corrective actions. The Activity Network Chart (PERT) shows the logical connections and consequence of tasks to be performed. It displays the time period for problem solving and the implementation of all activities through the critical path.Activity Network (PERT) Chart *
Picture: Activity Network (PERT) Chart
Related Solution:
Unified Modeling Language (UML) is a graphical modeling language for describing, visualizing, projecting and documenting of object oriented systems. UML digram is used for modeling of organizations and their business processes, for development the big projects, the complex software applications. Comprehensive UML diagram allows to create the set of interrelated documents that gives the complete visual representation of the modeling system.UML Sample Project *
Picture: UML Sample Project
Related Solution:
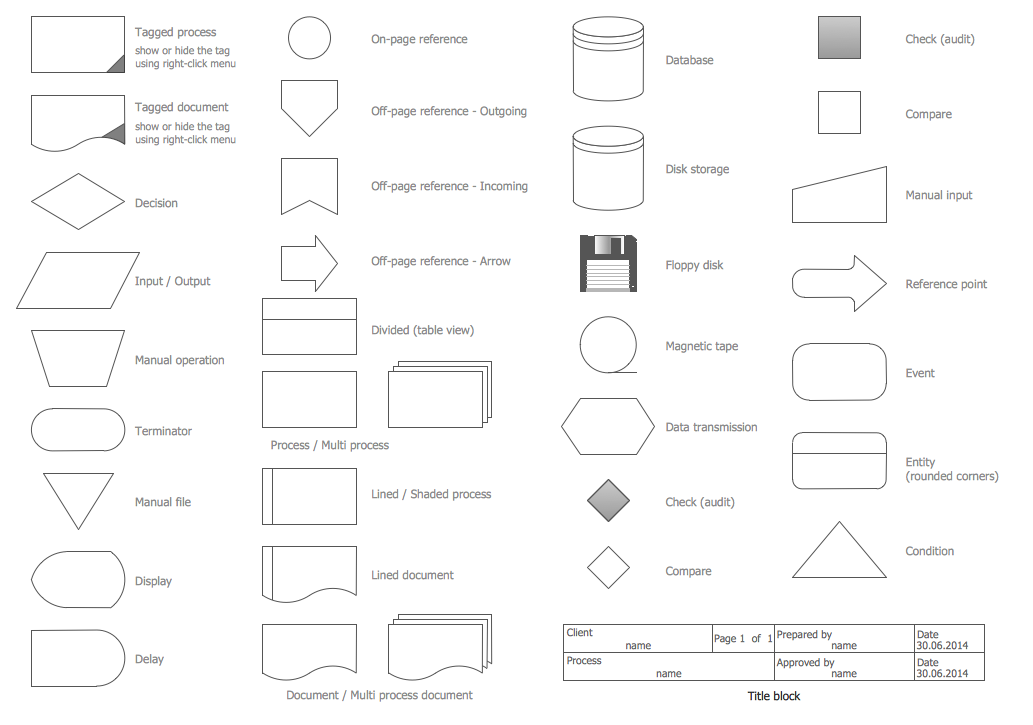
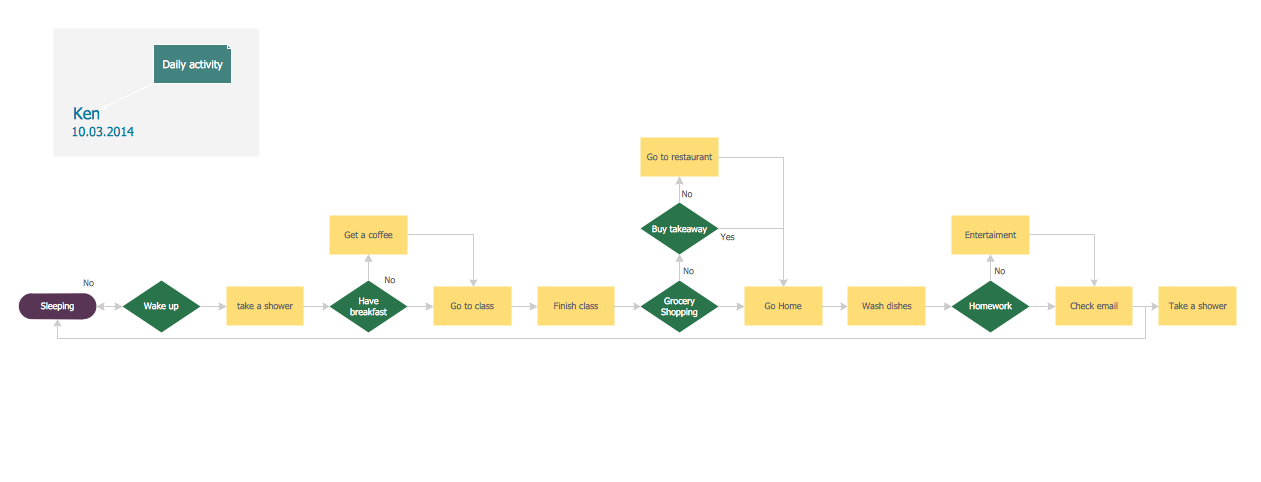
ConceptDraw software has been developed for drawing any type of flowchart. Use RapidDraw - thi is flowchart maker technology for adding new objects to a flowchart quickly. This is technology of fast drawing technique focused on making great-looking flowcharts quickly. To get started using it download flowchart maker ConceptDraw DIAGRAM.Flowchart Program Mac *
Picture: Flowchart Program Mac
Related Solution:
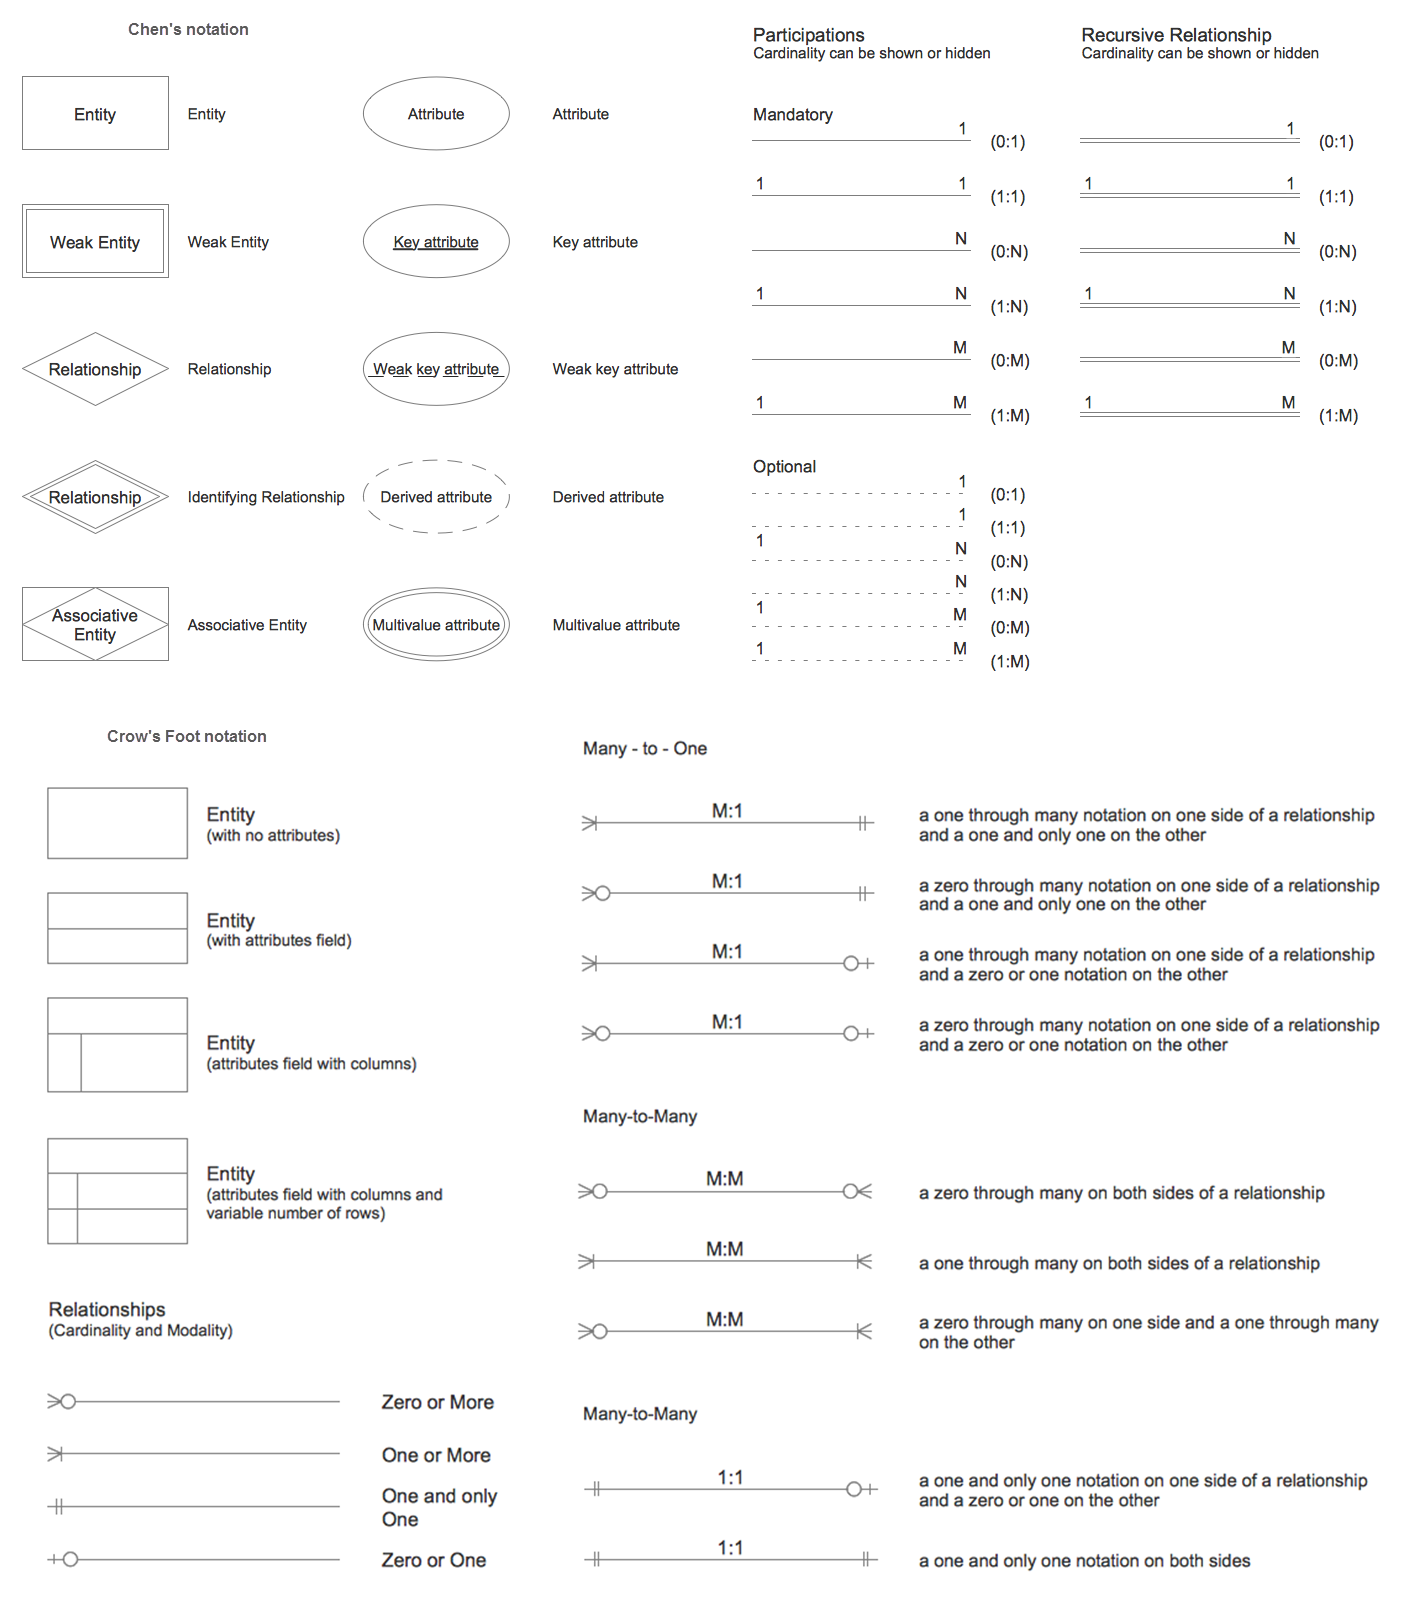
When we start to speak about databases, we must always mention database structure visualization. One of the most common ways to do it is to create an entity relationship diagram, and to put appropriate symbols on it. It is important either for database projecting and for its' future maintenance. Entity Relationship Diagram describes data elements and their relationships within a database. There are a set of special symbols that depict each element of an entity relationship diagram. Entities - represents some stable components such as supplier, employee, invoice, client, etc. Relation symbols show how the entities interact. Attributes define characteristics of the relationships. Attributes can be one-to-one or many-to-many. Physical symbols is used in the physical models. They represent items such as fields, tables, types and keys. ERD physical symbols are the building material for the database. Notation lines are used to illustrate the relationships. The most common method is Crow’s Feet notation. You can use ConceptDraw Entity-Relationship Diagram (ERD) solution to represent a database using the Entity-Relationship model.Entity Relationship Diagram Symbols
Picture: Entity Relationship Diagram Symbols
Related Solution:
Accounting is a cornerstone of any business, it’s basement. If you want to have a visual representation of your finance management, use audit flowchart symbols to document the money flow. Although some would say that accounting is boring, it is very a responsible duty. The audit flowchart symbols is supplied with ConceptDraw Audit Flowcharts solution as a vector objects library. Together with Conceptdraw Drawing capabilities it forms the helpful tool for audit process planning and setting the steps of audit by designing audit flow charts. Audit Flow charts are used to organize fiscal information tracking process as well as in accounting, finance and investment management.Audit Flowchart Symbols
Picture: Audit Flowchart Symbols
Related Solution:
Functional modeling allows to make complex business processes simple. One of the basic methods is IDEF0 and one of the most effective also. To create a business model, use flowchart symbols. The IDEF0 library, supplied with ConceptDraw IDEF0 Diagrams solution contains 18 IDEF0 basic notation symbols. All symbols are the vector graphic images what means, that one can customize their size preserving the stable quality. Another library of IDEF0 symbols can be find out in the the Business Process Diagrams solution, included to the Business Processes section of ConceptDraw Solution Park. These libraries composed from just vector objects and are totally compatible. You can apply the IDEF0 symbols from both libraries at your flowcharts, if needed.IDEF0 Flowchart Symbols
Picture: IDEF0 Flowchart Symbols
Related Solution:
ConceptDraw
MINDMAP 16