Multi Layer Venn Diagram
Venn Diagram Example
A set is one of the key concepts of mathematics. The concept of the set is usually taken as one of the axiomatic concepts, that is, it can not be reduced to other concepts, and therefore has no definition. However, you can give a description of the set, as a collection of different elements, perceived as a whole.
Venn diagram shows all the possible relationships between sets or events of a certain family.
If element X belongs to a set M that is denoted by X ∈ M, and non-membership - X ∉ M. If the sets A and B are composed of the same elements, it is said that they are equal: A = B. Otherwise, the A and B sets are not equal (is denoted by A ≠ B). The set A is called a subset of the set B (denoted A ⊆ B), if every element of the set A is contained in the set B. In this case we also may say that B comprises the A or is a superset of A (denoted by B ⊇ A). The set A is called a proper subset of B (denoted A ⊂ B), if A ⊆ B and A ≠ B, i.e. B has elements that are not contained in A.
A set containing a finite number of elements is called finite, otherwise - infinite. The number of elements of a finite set M is called its power.
The set which doesn’t contain any elements is called empty (denoted by ∅). By definition, ∅ is equal to zero. It is believed that the empty set is a subset of any set. The basic operations on sets are union, intersection, difference and addition.
Union of sets A and B (denoted by AUB) is a set of elements, each of which belongs to either A or B. Thus, a random element X ϵ АUВ if and only if either X ϵ A, and X ϵ B.
Intersection of sets A and B (denoted by A∩B) is the set consisting of all those and only those elements which belong to both set A and set B.
Difference between the sets A and B (denoted by A B) is the set of all those and only those elements of A that are not contained in B.
A logical complement of A (denoted Ā or ¬A) is the set of all those elements that do not belong to the set A.
This sample was created in ConceptDraw DIAGRAM software using the Business Diagrams Solution from the Management area of ConceptDraw Solution Park.
This example shows the radially-symmetrical 5 set Venn Diagram. The Venn Diagrams visualize all possible logical relations between several sets and are widely used in mathematics, logic, statistics, marketing, sociology, philosophy, etc.
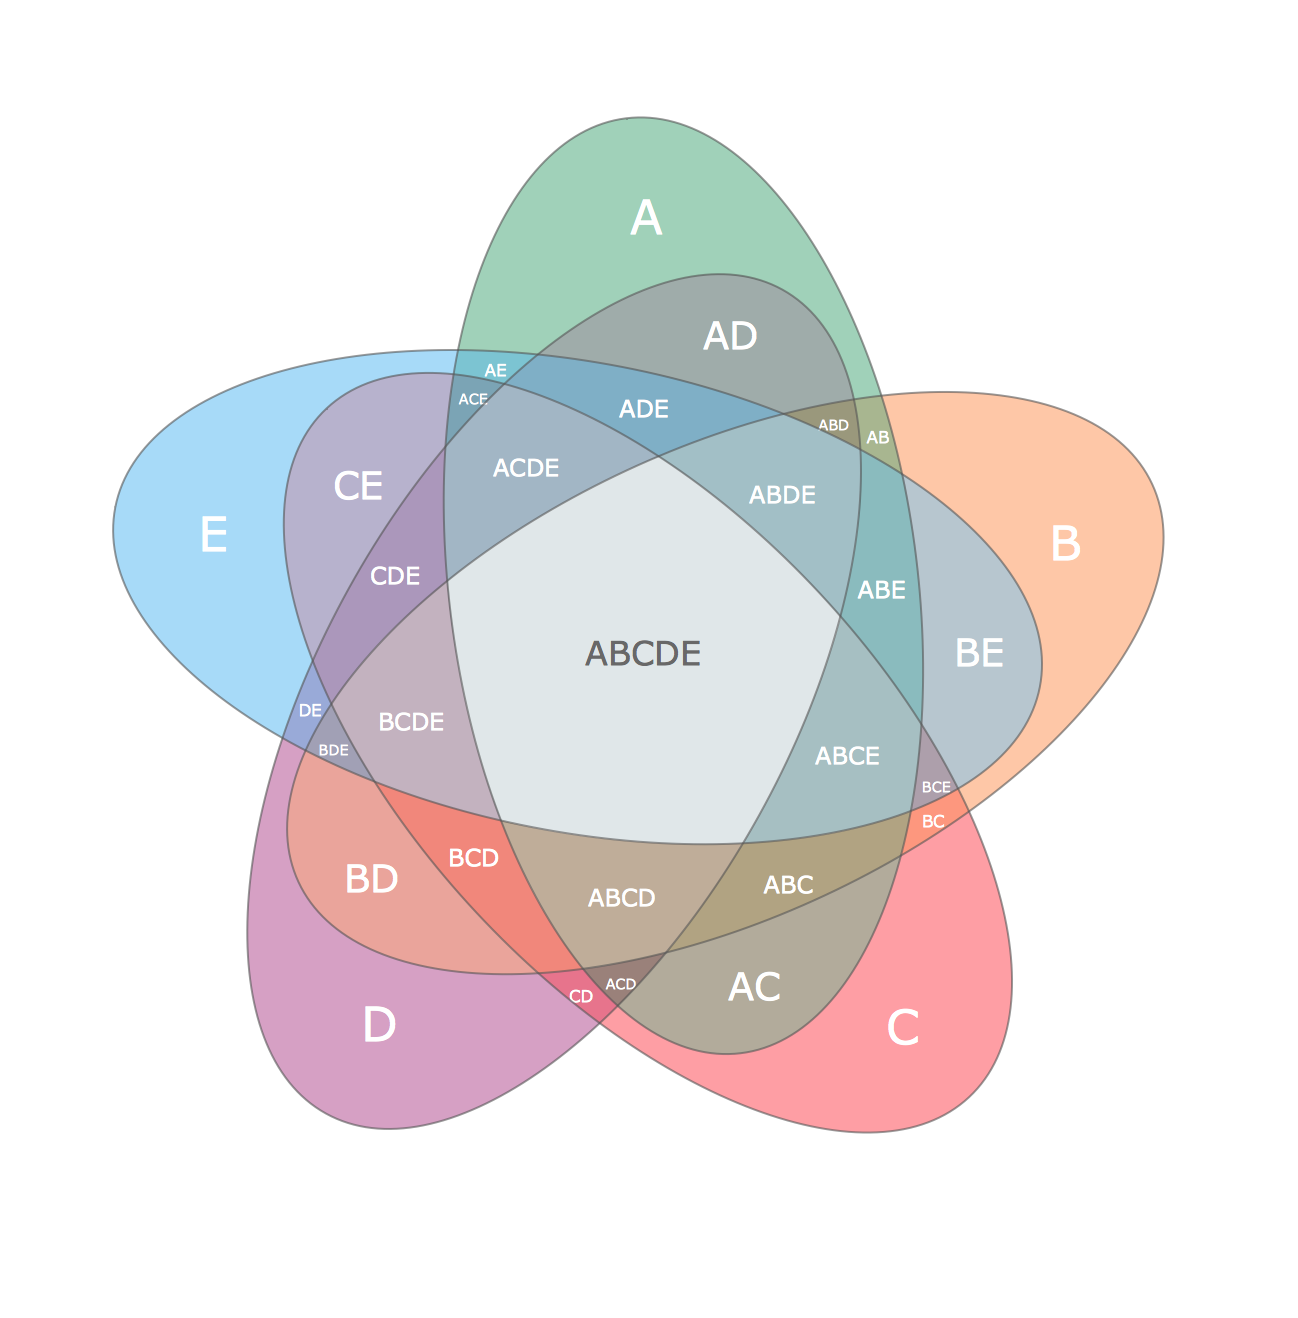
Example 1. Multi Layer Venn Diagram
Using the ready-to-use predesigned objects, samples and templates from the Business Diagrams Solutionn for ConceptDraw DIAGRAM you can create your own professional-looking Venn Diagrams quick and easy.
The Venn Diagrams produced with ConceptDraw DIAGRAM are vector graphic documents and are available for reviewing, modifying, and converting to a variety of formats (image, HTML, PDF file, MS PowerPoint Presentation, Adobe Flash or MS Visio).
TEN RELATED HOW TO's:
It is so simple making the drawing process easier and faster. you just need to choose the right drawing software.
ConceptDraw Arrows10 Technology - This is so easy and fast to draw any type of diagram with any degree of complexity.
Picture: Simple & Fast Diagram Software
Related Solutions:
ConceptDraw DIAGRAM is effective software for a variety of activity fields. Now, extended with Sales Flowcharts solution from the Marketing area of ConceptDraw Solution Park it become also useful in the field of sales. It helps to design professional looking Sales Flowcharts, Sales Process Flowcharts, Sales Process Maps, Plans and Diagrams to effectively realize the process of selling a product or service, and to display the sales results.
Picture: Sales Process
Related Solution:
The Accounting flowchart shows how information flows from source documents through the accounting records. The are based on the accounting procedures or processes.
Flowcharts are used to represent accounting information in a system. There are special symbols which are used to create accounting flowcharts. Try conceptdraw flowcharting set of symbols to draw a professional charts.
Picture: Why Flowchart Important to Accounting Information System?
Related Solution:
All about prototyping. GUI Prototyping with ConceptDraw. Download prototyping software.
Picture: GUI Prototyping with ConceptDraw DIAGRAM
Learn the most common process flowchart symbols used in business process diagrams and workflow charts. Includes symbol meanings, examples, and a practical reference table.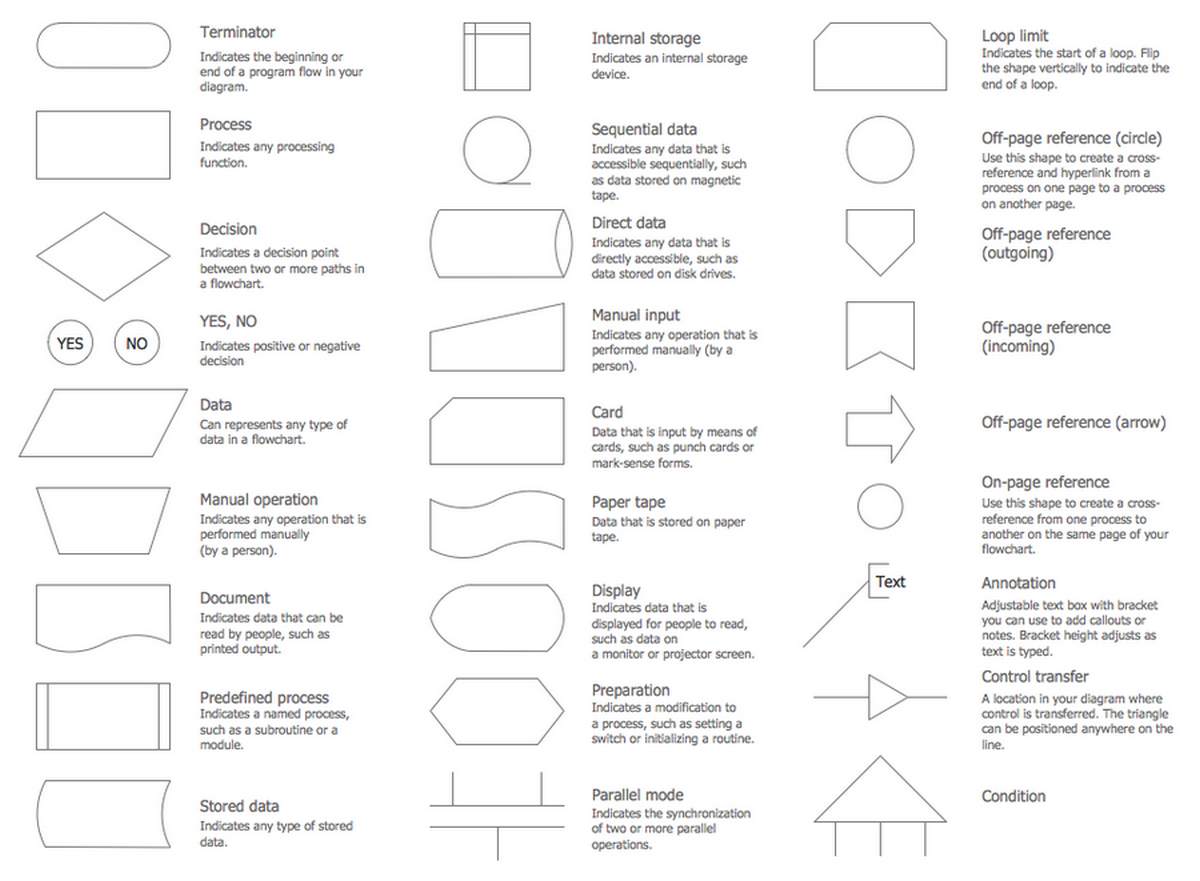
Picture: Process Flowchart Symbols: Meaning, Types and Examples
Related Solution:
Biology is incredibly interesting and useful natural science which studies all living things on the earth (people, animals, plants), structure, functions, interactions, evolution of living organisms. Biologists of the whole world use actively illustrations and drawings in your science and education activity. To facilitate their task of biology drawing, ConceptDraw DIAGRAM diagramming and vector drawing software was extended with Biology solution from the Science and Education area. Now, ConceptDraw DIAGRAM is a powerful biology drawing software.
Picture: Biology Drawing Software
Related Solution:
When searching for a diagramming tool, we look for a powerful and reliable software that would be easy to use. To mention one, ConceptDraw DIAGRAM has all the necessary features to create cross-functional flowcharts (Swim Lanes) quick and effortlessly. You can draw swim lane diagrams in both vertical and horizontal ways.
This cross-functional flowchart displays a payroll process. It explains to each participant his role in the process depending on the category, represented with swimlanes. Using this flowchart, every employee can easily find out what he can expect in terms of salary. Generally a cross-functional diagram enables one to take a look at processes with a wider scope and with more precision than simple flowchart. Business process capturing using cross-functional flowcharts can be useful for stakeholders and managers to define clearly the staff's roles and responsibilities.
Picture: Cross-Functional Flowchart (Swim Lanes)
Related Solution:
Drawing defensive strategy diagrams using ConceptDraw DIAGRAM software extended with the Football solution saves your time, and adds more value to your work. You can easily convert vector drawing to a popular graphic format and then post it to your blog or site. There is no problem to add your logo or text copyright, or use some text comments to make your diagrams unique and recognizable.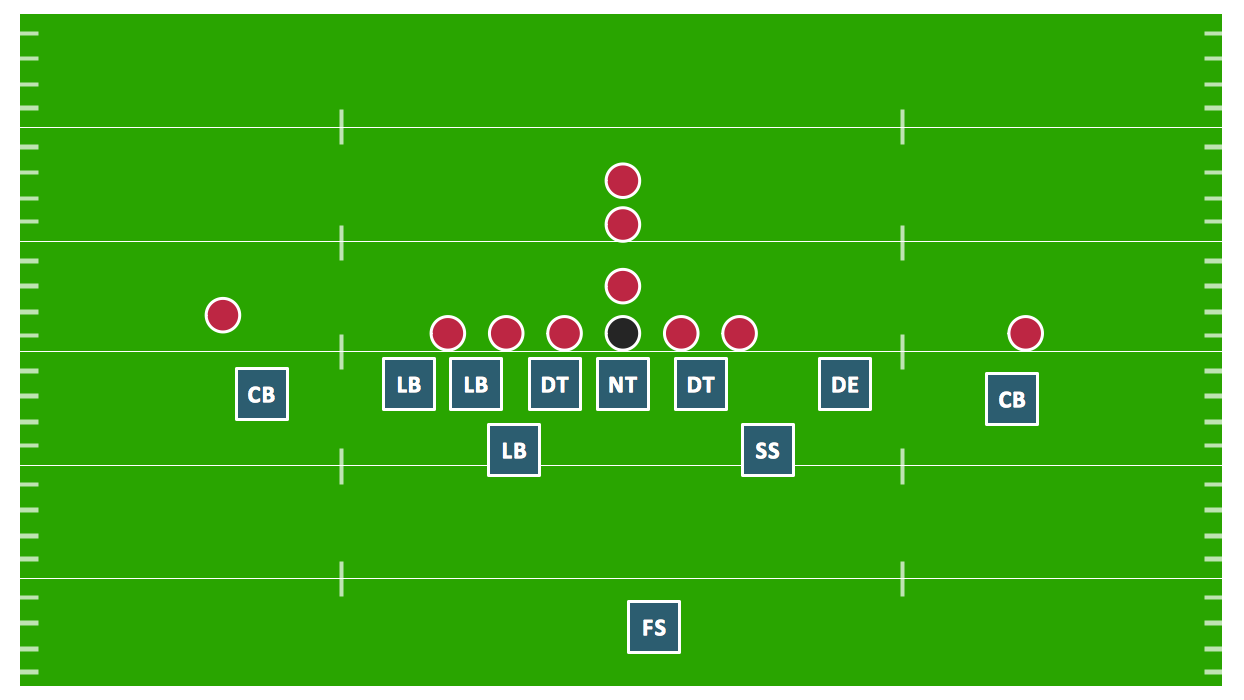
Picture: Defensive Strategy Diagram – 46 Defence
Related Solution:
To visualize the relationships between subsets of the universal set you can use Venn diagrams. Сreate your own professional-looking Venn Diagrams quick and easy.Picture:
Multi Layer Venn Diagram
Venn Diagram Example
Related Solution:
This sample was created in ConceptDraw DIAGRAM diagramming and vector drawing software using the Pie Charts Solution from Graphs and Charts area of ConceptDraw Solution Park.
This sample shows the Pie Chart of the approximate air composition. You can see the percentage of oxygen, nitrogen and other gases in the air visualized on this Pie Chart.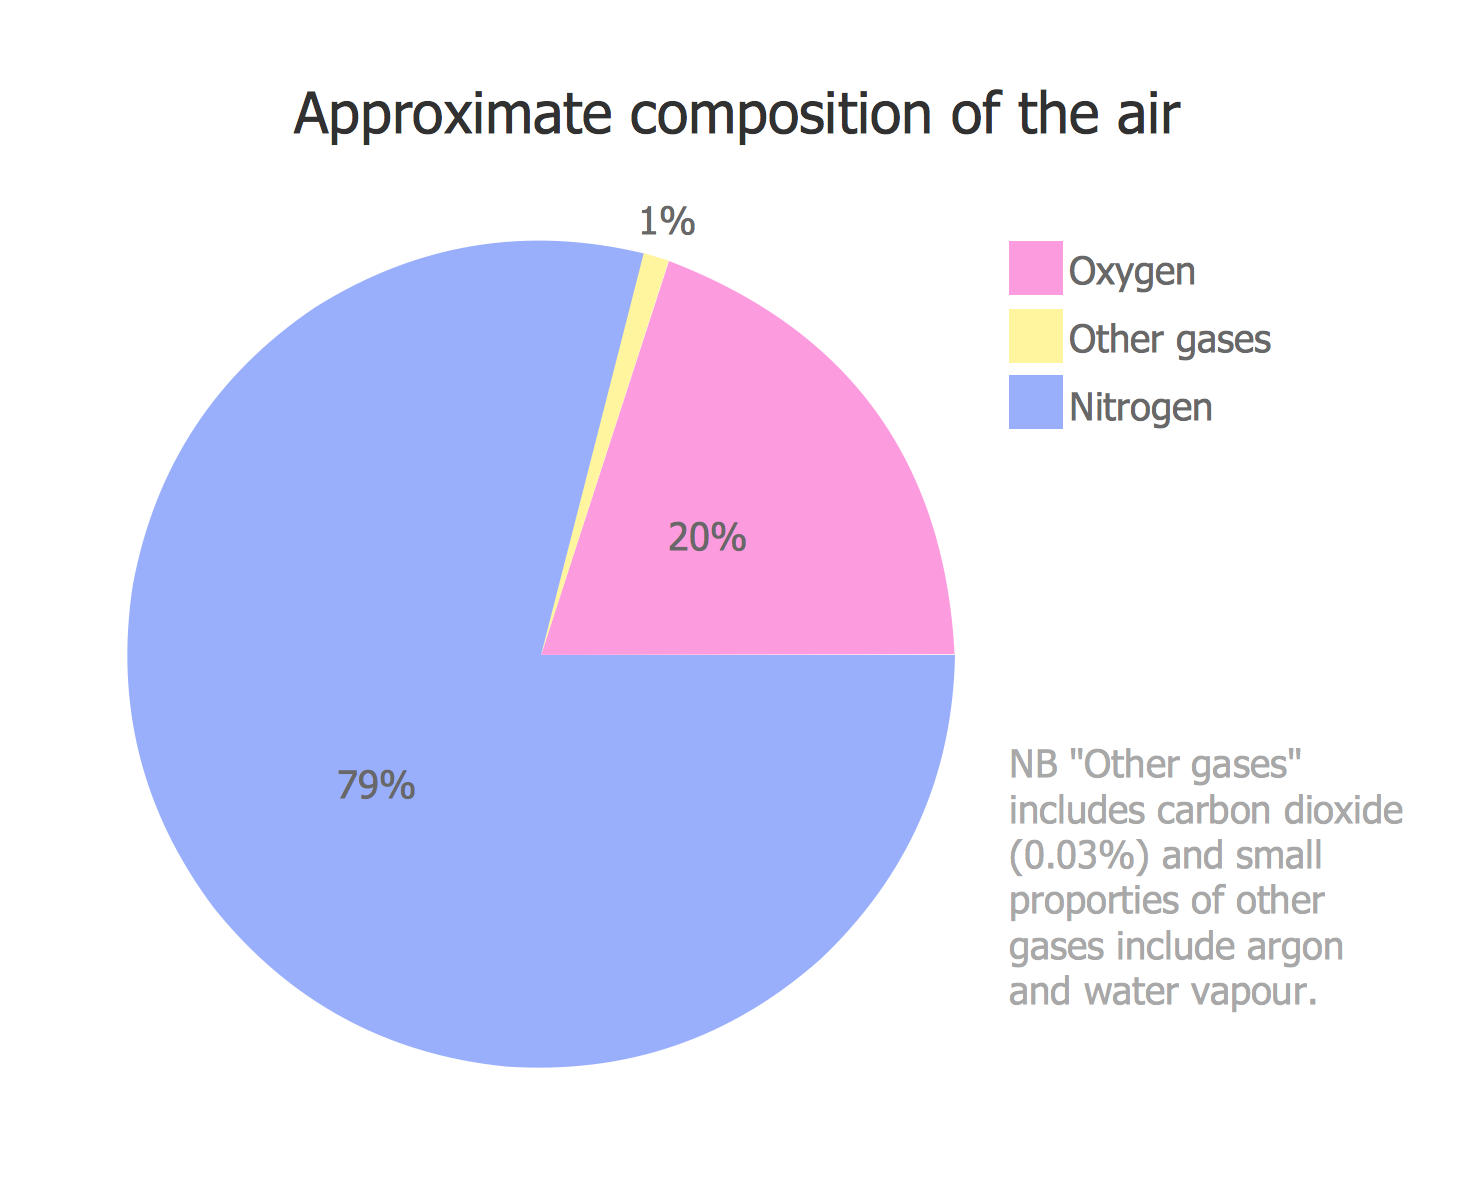
Picture: Percentage Pie Chart. Pie Chart Examples
Related Solution: