Network Community Structure.
Computer and Network Examples
Network community structure is a network which nodes can be easily grouped into the sets of nodes with dense internally connections.
The community structure is a common characteristic of computer, information, biological, metabolic, social networks. But also there are networks such as for example the random graph, Barabasi–Albert model that don't display community structure. The community structure allows to see how the network function and topology affect each other.
This example shows a network that displays the community structure with three groups of nodes with dense internal connections and sparser connections between the groups.

Example 1. Network Community Structure. Computer and Network Examples
This example was redesigned from the file [https://commons.wikimedia.org]
Using the solutions of the Computer and Networks Area for ConceptDraw DIAGRAM with wide set of ready-to-use predesigned vector stencils and examples you can design anyone Network community structure quick and easy.
The diagrams created with ConceptDraw DIAGRAM are vector graphic documents and are available for reviewing, modifying, and converting to a variety of formats (image, HTML, PDF file, MS PowerPoint Presentation, Adobe Flash or MS Visio).
See also Samples:
TEN RELATED HOW TO's:
Two types of diagrams are used in UML: Structure Diagrams and Behavior Diagrams. Behavior Diagrams represent the processes proceeding in a modeled environment. Structure Diagrams represent the elements that compose the system.
Picture: UML Diagram Types List
Related Solution:
Users can start draw their own flowchart diagrams from existing examples.
Picture: Examples of Flowchart Diagram
Related Solution:
Easy charting software comes with beautiful chart templates and examples. This makes it easy to create professional charts without prior experience.
Picture: Chart Examples
Related Solutions:
Wireless Networks solution from ConceptDraw Solution Park extends ConceptDraw DIAGRAM diagramming and vector drawing software to help network engineers and designers efficiently design, create and illustrate WAN network diagram of any complexity. The ConceptDraw DIAGRAM software helps users to quickly transit from an idea to the implementation of a Wireless Network WAN
Picture: Wireless Network WAN
Related Solution:
Today, we can’t imagine our lives without daily data exchange. To call a set of devices that can be connected with each other a computer network, we must be sure that these devices support appropriate protocols to transfer data. A network consisting of personal devices is private, and global computer networks, for example, Internet, connects network nodes worldwide.
This diagram represents a computer telecommunication network. The network depicted on the current diagram is featured with networked communication devices that provide data exchange through Internet. The network interconnections and connections between Internet nodes are settled using the cable media and wireless media. The nodes are the network workstations (terminals). and host computers. This network diagram was drawn with ConceptDraw DIAGRAM and its Computer and Networks Diagrams solution.
Picture: Computer Network. Computer and Network Examples
Related Solution:
ConceptDraw DIAGRAM extended with Mathematics solution from the Science and Education area is a powerful diagramming and vector drawing software that offers all needed tools for mathematical diagrams designing.
Mathematics solution provides 3 libraries with predesigned vector mathematics symbols and figures:
Solid Geometry Library, Plane Geometry Library and Trigonometric Functions Library.
Picture: Mathematics Symbols
Related Solution:
The Wireless Network solution helps users to quickly transition from an idea to the implementation of a wireless computer network.
ConceptDraw DIAGRAM is well placed to provide experienced and comprehensive assistance in the workplace.
The vector stencils, examples, and templates included to solution is a strong toolset for network engineer.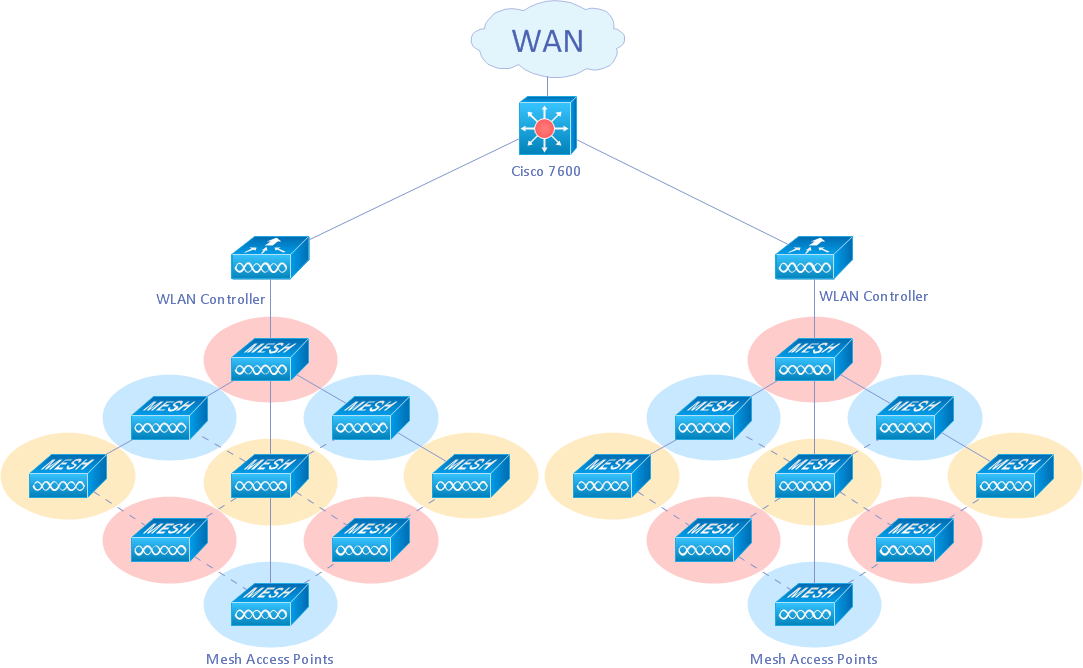
Picture: Wireless Network Drawing
Related Solution:
ConceptDraw DIAGRAM is a chemistry drawing software that is ideal for designing of various: chemistry drawings, scientific and educational chemistry illustrations, schemes and diagrams of chemical and biological lab set-ups, images with chemical formulas
Picture: Chemistry Drawings
Related Solution:
ConceptDraw DIAGRAM is perfect for software designers and software developers who need to draw Computer&Network Diagrams.
ConceptDraw has 1004 vector stencils in the 40 libraries that helps you to start using software for designing own Network Diagrams. You can use the appropriate stencils from Computer and Network Diagrams library with 56 objects..png)
Picture: Design Element: Computer and Networkfor Network Diagrams
Related Solution: