Network Diagramming Software
for Network Active Directory Diagrams
Design Element Active Directory
Active Directory Diagrams visualize the detailed structures of the
- Microsoft Windows networks,
- Active Directory Domain topology,
- Active Directory Site topology,
- Organizational Units (OU),
- Exchange Server Organization.
They are used to visually document the Microsoft Active Directory network detail structure for network designing, and for managing the control access to printers and files, the access and security, the traffic flow optimization in local and wide area nets, the network equipment maintenance and repair, the data backup, storage, and recovery.
ConceptDraw has 1004 vector stencils in the 40 libraries that helps you to start using software for designing your own Network Diargams. You can use the appropriate stencils from Active Directory Objects with 20 objects.
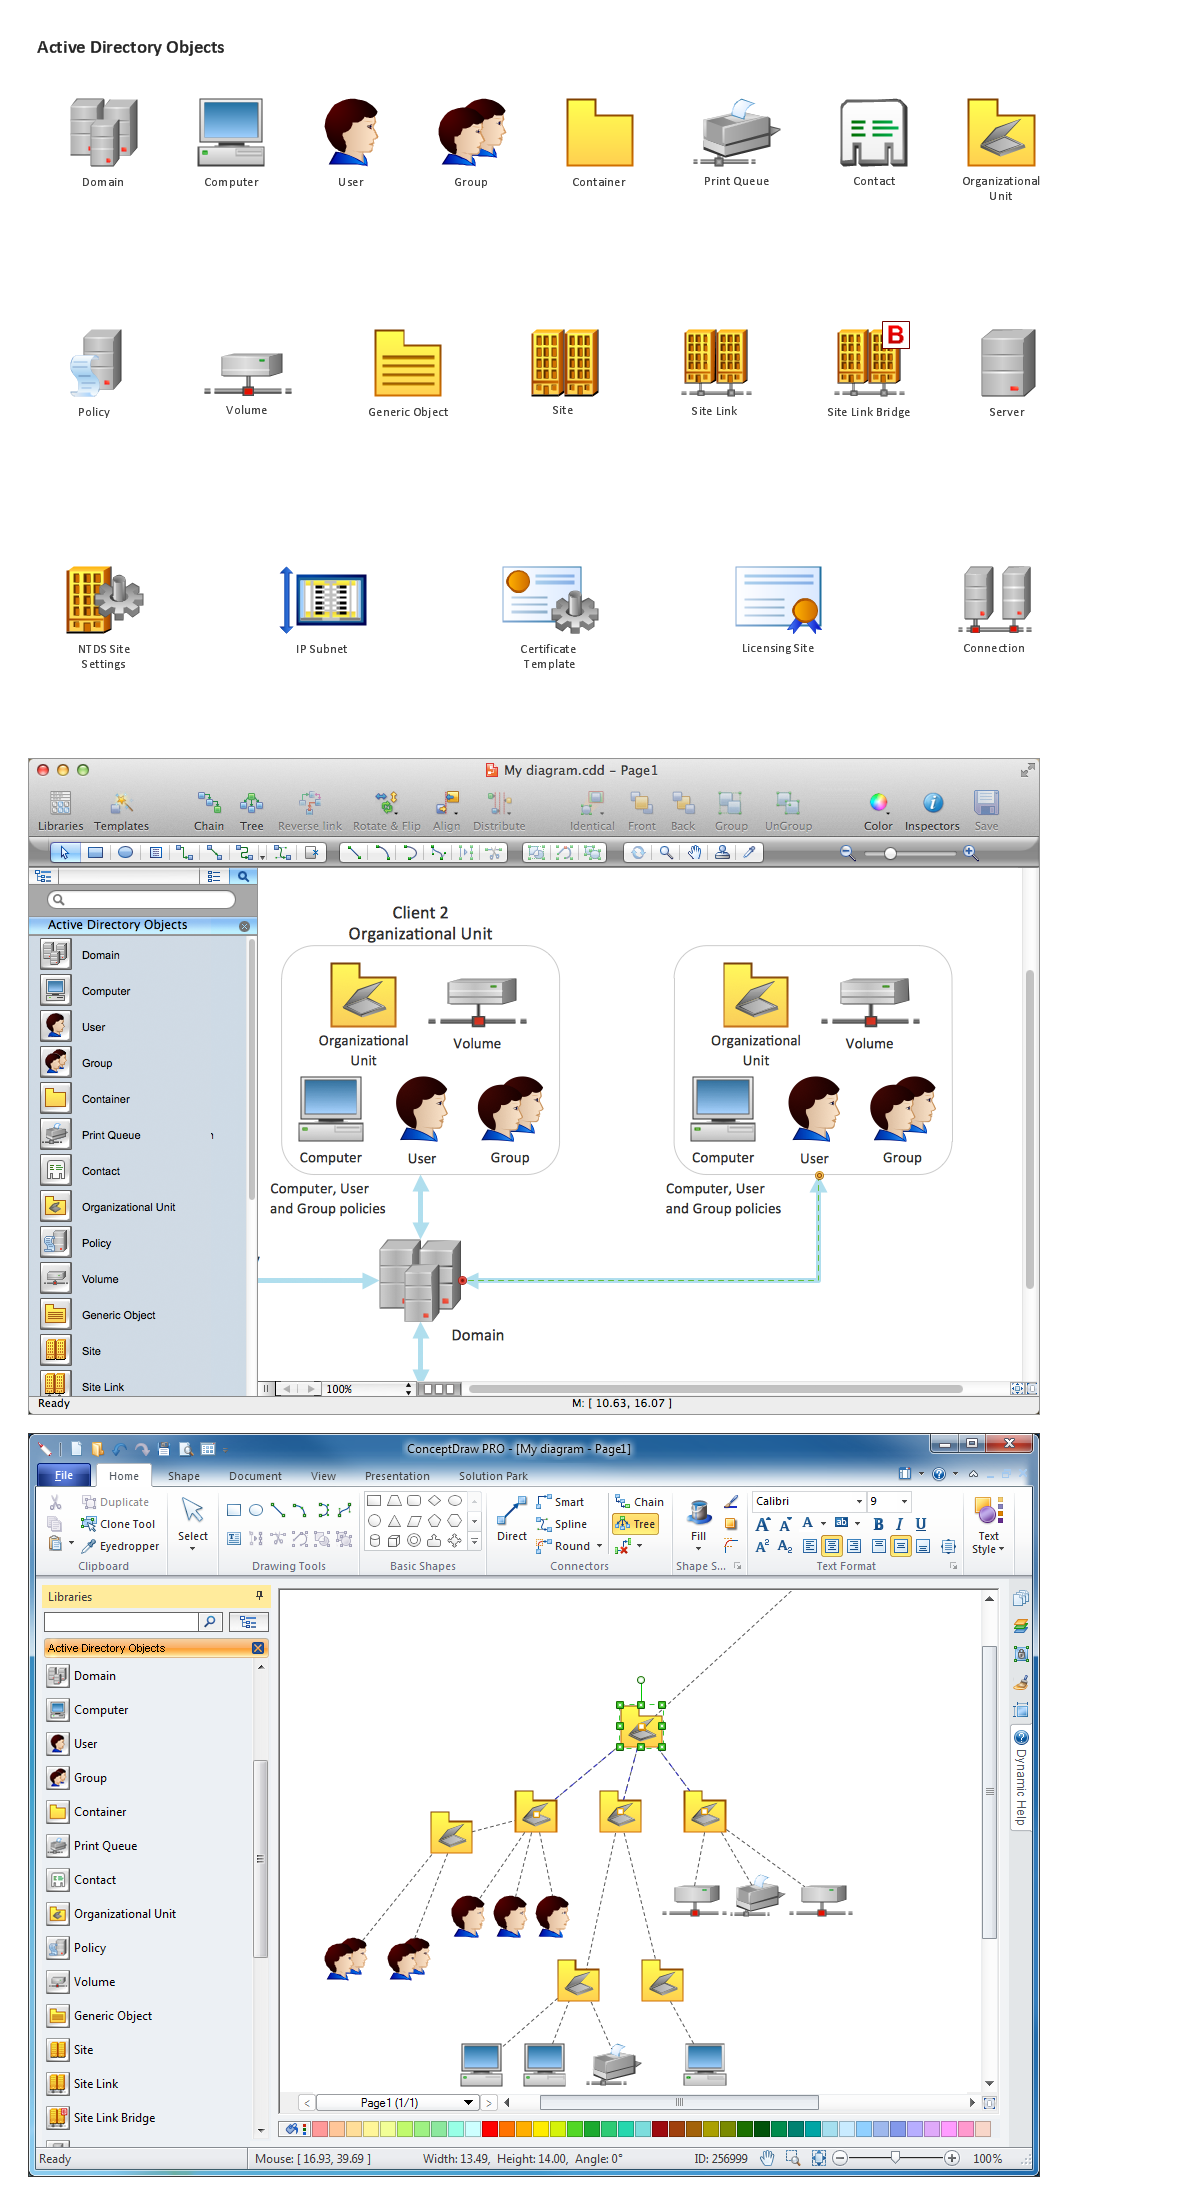
Pic.1. Network Diagramming Software
Design Elements — Active Directory (macintosh, windows)
ConceptDraw solution Computer and Networks provides 4 libraries of vector stencils for drawing the Active Directory network diagrams: Active Directory Objects, Active Directory Sites and Services, Exchange Objects and LDAP Objects.
Use these libraries of design elements to draw network diagrams of Microsoft Windows networks, Active Directory Domain topology, Active Directory Site topology, Organizational Units (OU), Exchange Server Organization.
TEN RELATED HOW TO's:
Some organization hold offices for years and decades, or even build their own campuses. However, if it’s time for your organization to move to another building, drawing software for designing office layout plan would come in handy. With such software you can save a lot of time and create a new layout or try to save old layout in a new building.
This office layout plan is an example of a typical office furniture and equipment arrangement. This drawing provides a graphic view of the office area and its facilities including furniture and office equipment. It can be used as template which represent, desks, files, and other pieces of equipment that can be re-arranged according the certain requirements to office space and facilities. The vector graphic objects that represent various office layout elements such as special office furniture and equipment can help you to shape a number of creative ideas and develop your office layout plan.
Picture: Building Drawing Software for Design Office Layout Plan
Related Solution:
While creating flowcharts and process flow diagrams, you should use special objects to define different statements, so anyone aware of flowcharts can get your scheme right. There is a short and an extended list of basic flowchart symbols and their meaning. Basic flowchart symbols include terminator objects, rectangles for describing steps of a process, diamonds representing appearing conditions and questions and parallelograms to show incoming data.
This diagram gives a general review of the standard symbols that are used when creating flowcharts and process flow diagrams. The practice of using a set of standard flowchart symbols was admitted in order to make flowcharts and other process flow diagrams created by any person properly understandable by other people. The flowchart symbols depict different kinds of actions and phases in a process. The sequence of the actions, and the relationships between them are shown by special lines and arrows. There are a large number of flowchart symbols. Which of them can be used in the particular diagram depends on its type. For instance, some symbols used in data flow diagrams usually are not used in the process flowcharts. Business process system use exactly these flowchart symbols.
Picture: Flowchart Symbols: Meaning and Examples
Related Solution:
Do you need to draw a check order process flowchart?
Use the intuitive product - ConceptDraw.
Picture: Check Order Process Flowchart. Flowchart Examples
Related Solution:
The Social Media Response solution provides the means to respond to social media mentions quickly and professionally. This tool keeps the entire team on the same page allowing you to realize your social media strategy, improve the quality of your answers, and minimize the time it takes to respond.
Picture: Manage Social Media Response Plan DFD
Related Solution:
UML state machine's goal is to overcome the main limitations of traditional finite-state machines while retaining their main benefits. ConceptDraw is ideal for software designers and software developers who need to draw UML State Machine Diagrams.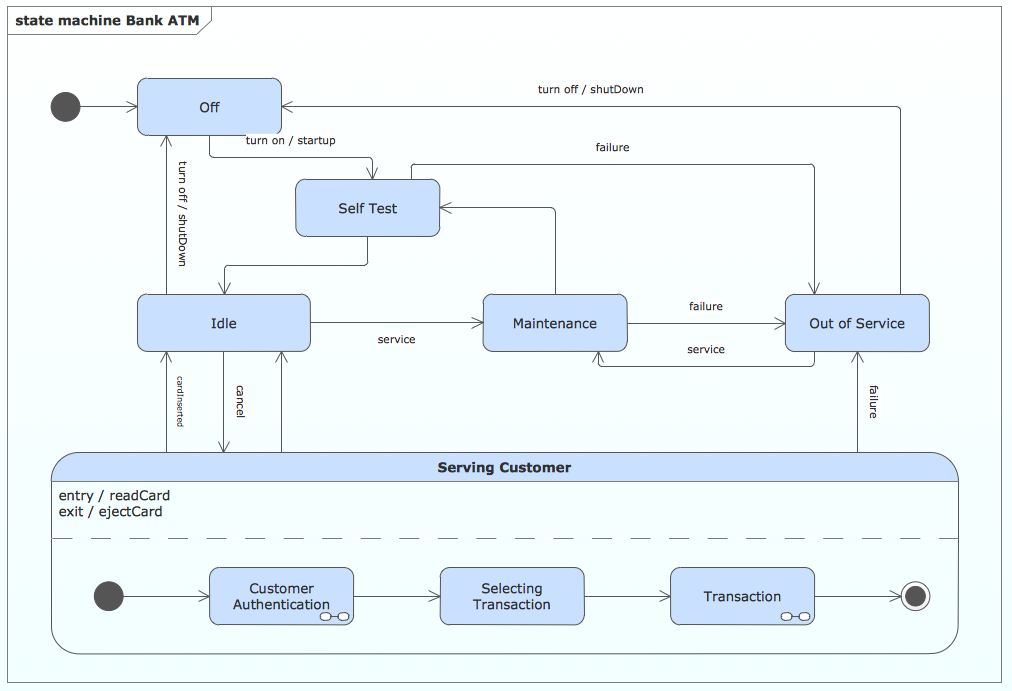
Picture: State Machine Diagram
ConceptDraw DIAGRAM diagramming and vector drawing software extended with Wireless Networks Solution gives the ability to its users to create professional looking WLAN schemes and diagrams quick and easy.
Picture: WLAN
Related Solution:
You want create a professional room plan quick and easy? ConceptDraw DIAGRAM diagramming and vector drawing software will help you. It’s very simple and convenient design the room plans with Floor Plans Solution from the Building Plans area of ConceptDraw Solution Park.
Picture: Room Planning Software
Related Solution:
It's obvious that any building has a plan, and it is a hard and diligent work to draw one. And it's great that nowadays there are software tools for those purposes. For instance, ConceptDraw Pro contains design elements depicting different parts of sport fields. It's easy to use them and it facilitates your work exponentially.
Planning of athletic facilities, playgrounds and Leisure Centers, needs thoughtful and creative approach. Any layout regarding to sport facilities should satisfy the requirements of both athletes and spectators. Well designed sport fields , playgrounds and recreation spaces attract people to sport activities in the cities and countryside. ConceptDraw Sport Field Plans solution is useful and convenient professional drawing tool. It delivers the kit of vector libraries that can be used for representing sport fields, sportgrounds and recreation spaces: football, hockey, volleyball, cricket, basketball , swimming pool, etc.
Picture: Building Drawing Software for Design Sport Fields
Related Solution:
Comparing ConceptDraw DIAGRAM to Omnigraffle - Cross-platform product. While most drawing tools are designed for use on one operating system, ConceptDraw DIAGRAM is available as two independent and concurrent versions on both Macintosh (macOS) and PC (Windows).
License is per named user. That means you can use a single license for Macintosh and PC. Users can install at work and at home with a single license.
Picture: Comparing ConceptDraw DIAGRAM to Omnigraffle
Related Solution:
ConceptDraw MINDMAP is the most productive tool you can use to solve problems and generate yout great ideas.
Picture: Professional & Powerful Mind Mapping Software
Related Solution: