Notation & Symbols for ERD
Creation of the entity-relationship model is one of the most important stages in the process of creating databases and modeling of business processes. Entity Relationship Diagram (ERD) reflects reality and allows you to get the most complete picture about the actual data requirements that are set at the company.
The entity-relationship model described in form of ERD represents the information that is gathered and used at the conduct of business. It visually shows how the database or application system will look, but doesn't disclose a way of realization. The ERD doesn't depend on the choice of database producer. It groups the data into separate entities and links these entities to each other on the base of business rules. The entity has the contents and represents some object about which is needed to store information. The business rules is a line of conduct and procedures for the business organization, they describe how the company is functioning.
The ER diagram is constructed from the specific ERD graphic elements. There are used 2 types of ERD notations: Chen and Crow's Foot.
A complete set of work flow shapes, notation & symbols for ERD, entity relationship stencils, included in Entity-Relationship Diagram (ERD) solution for ConceptDraw DIAGRAM software, makes drawing diagrams based on ERD notation as smooth as possible.

Example 1. Entity relationship diagram (ERD) symbols, Crow's Foot notation
All these ERD symbols are vector, you can drag to the document to construct the ER Diagram, resize any of them without loss of quality, change their color to make your diagram more attractive and colorful.
ERD Chen's notation
| Symbol |
Shape Name |
Symbol Description |
| Entities |
 |
Entity |
An entity is represented by a rectangle which contains the entity’s name. |
 |
Weak Entity |
An entity that cannot be uniquely identified by its attributes alone. The existence of a weak entity is dependent upon another entity called the owner entity. The weak entity’s identifier is a combination of the identifier of the owner entity and the partial key of the weak entity. |
 |
Associative Entity |
An entity used in a many-to-many relationship (represents an extra table). All relationships for the associative entity should be many |
| Attributes |
 |
Attribute |
In the Chen notation, each attribute is represented by an oval containing atributte’s name |
 |
Key attribute |
An attribute that uniquely identifies a particular entity. The name of a key attribute is underscored. |
 |
Multivalued attribute |
An attribute that can have many values (there are many distinct values entered for it in the same column of the table). Multivalued attribute is depicted by a dual oval. |
 |
Derived attribute |
An attribute whose value is calculated (derived) from other attributes. The derived attribute may or may not be physically stored in the database. In the Chen notation, this attribute is represented by dashed oval. |
| Relationships |
 |
Strong relationship |
A relationship where entity is existence-independent of other entities, and PK of Child doesn’t contain PK component of Parent Entity. A strong relationship is represented by a single rhombus |
 |
Weak (identifying) relationship |
A relationship where Child entity is existence-dependent on parent, and PK of Child Entity contains PK component of Parent Entity. This relationship is represented by a double rhombus. |

Example 2. ER Diagram - Chen's Notation
ERD Crow’s Foot notation
| Symbol |
Meaning |
| Relationships
(Cardinality and Modality) |
 |
Zero or More |
 |
One or More |
 |
One and only One |
 |
Zero or One |
| Many - to - One |
 |
a one through many notation on one side of a relationship and a one and only one on the other |
 |
a zero through many notation on one side of a relationship and a one and only one on the other |
 |
a one through many notation on one side of a relationship and a zero or one notation on the other |
 |
a zero through many notation on one side of a relationship and a zero or one notation on the other |
| Many - to - Many |
 |
a zero through many on both sides of a relationship |
 |
a one through many on both sides of a relationship |
 |
a zero through many on one side and a one through many on the other |
 |
a one and only one notation on one side of a relationship and a zero or one on the other |
 |
a one and only one notation on both sides |

Example 3. ER Diagram - Crow's Foot Notation
The samples you see on this page were created in ConceptDraw DIAGRAM using the Entity-Relationship Diagram (ERD) solution from Software Development area of ConceptDraw Solution Park. An experienced user spent 10 minutes creating these samples.
Use the Entity-Relationship Diagram (ERD) Solution for ConceptDraw DIAGRAM software to create quick and easy your own professional looking ERDs using Crow's Foot and Chen notations.
All source documents are vector graphic documents. They are available for reviewing, modifying, or converting to a variety of formats (PDF file, MS PowerPoint, MS Visio, and many other graphic formats) from the ConceptDraw STORE. The Entity-Relationship Diagram (ERD) Solution is available for all ConceptDraw DIAGRAM or later users.
TEN RELATED HOW TO's:
While designing a conceptual data model, you should use appropriate software. For instance, ConceptDraw DIAGRAM is a user-friendly ER diagram tool that has a lot of samples and templates to facilitate your work. A clear entity-relationship diagram helps to define the relations between system’s components.
Software engineering is the section of a computer science engaged to design, realization, and support of complex software products. An ERD is a data modeling method that is widely applied in the software engineering practice. Commonly it is used for developing a structure of a a relational database. An entity relationship diagram is helpful for structuring and organizing databases that can be modeled using a relational structure. An entity relationship diagram is designed to depicts the interrelationships within the sets of entities which are accumulated in the database. Each entity represents a particular component of a data. Thus, ER diagrams depicts the logical structure of databases. ConceptDraw ER Diagrams solution provides software engineers with the professional tool for making entity-relationship diagrams.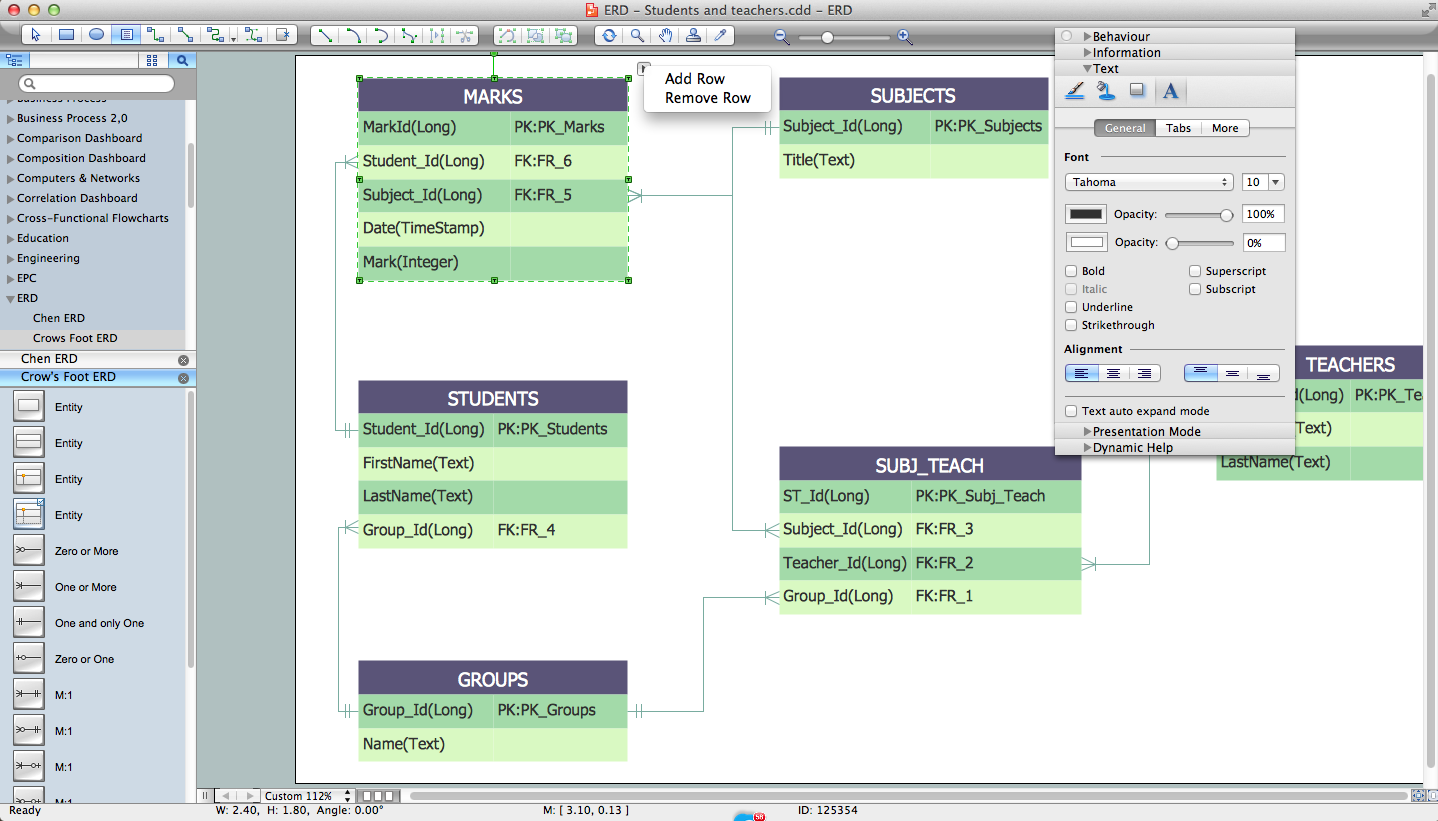
Picture: Entity Relationship Diagram Software Engineering
Related Solution:
Both Crow’s Foot and Chen’s notations are used to build database models. Each of them has its’ own features, and if you use a proper entity relationship diagram software, you’ll be able to create diagrams of any notation. Database model with clearly defined entities and relationships between them facilitates further work greatly.
This ERD represents the model of Employee Certification Entity. The entity-relationship diagram is a visual instrument of database software development. It is used to structure data and to define the relationships between structured data groups. This ERD was designed with a help of ConceptDraw Entity-Relationship Diagram (ERD) solution. The solution supports the both basic ERD notations used to describe the structure of database: Chen's and Crow’s Foot notations.
Picture: Entity Relationship Software
Related Solution:
The world-best Entity Relationship Diagram software suitable for professional ERD drawing is ConceptDraw DIAGRAM software extended with the Entity-Relationship Diagram (ERD) solution. This solution contains all libraries, templates and samples you may need for professional ERD drawing.
Picture: Entity Relationship Diagram Software
Related Solution:
The ConceptDraw DIAGRAM is a good flow chart app for Mac. Numerous vector stencils, samples and templates created by designers allows you to draw any type of flowchart.
Picture: Good Flow Chart app for Mac
Related Solution:
A waterfall model describes software development process as a sequence of phases that flow downwards. SSADM is one of the implementations of waterfall method. It’s easier to learn about structured systems analysis and design method (SSADM) with ConceptDraw DIAGRAM because this software has appropriate tools for creating data flow diagrams. You can use all the three main techniques of SSADM method with special tools and predesigned templates.
This data flow diagram illustrates the Structured Systems Analysis and Design Method. This method method considers analysis, projecting and documenting of information systems. Data flow models are the most important elements of SSADM and data flow diagrams are usually used for their description. It includes the analysis and description of a system as well as visualization of possible issues.
Picture: Structured Systems Analysis and Design Method. SSADM with ConceptDraw DIAGRAM
Related Solution:
Any business process consists from a number of tasks carrying out the certain business goal. It is useful to diagram business processes to ensure that they are as foolproof, logical and sequential as possible. This business process diagram describes a typical booking process flow by the example of a cab booking process. It can be used as a roadmap for any booking system implementation. Diagramming a business process allows you to look at the entire project and take into account all types of possible scenarios. Business process diagram helps you investigate and clarify the process thoroughly so that you can find out how it can be improved. Business process diagram supports team communications by ensuring that each process element is clear and everyone in the team is on the same page.
Sometimes your company brings you less profit than you expect it to be, and it’s difficult to reveal the causes. Maybe it’s time to learn new technologies, because business diagram are easily developed by means of special software, so you won’t make any extra effort. In return, you will increase your productivity and get more done in a less time.
Picture: Business Diagram Software
Related Solutions:
Complexity of databases increases day by day, due to this the Entity relationship models and E-R diagrams become more and more popular, and now are an important part of database design. E-R diagrams created at ConceptDraw DIAGRAM allow visually and graphically represent structure and design of databases.
Picture: E-R Diagrams
Related Solution:
When it comes to system construction, a class diagram is the most widely used diagram. UML Class Diagrams is a type of static structure diagram that is used for general conceptual modeling of the systematics of the application. Such a diagram would illustrate the object-oriented view of a system. The object orientation of a system is indicated by a class diagram. It describes the structure of a system by showing the general issues,classes of a system, attributes, operations, interfaces, inheritance, and the relationships between them.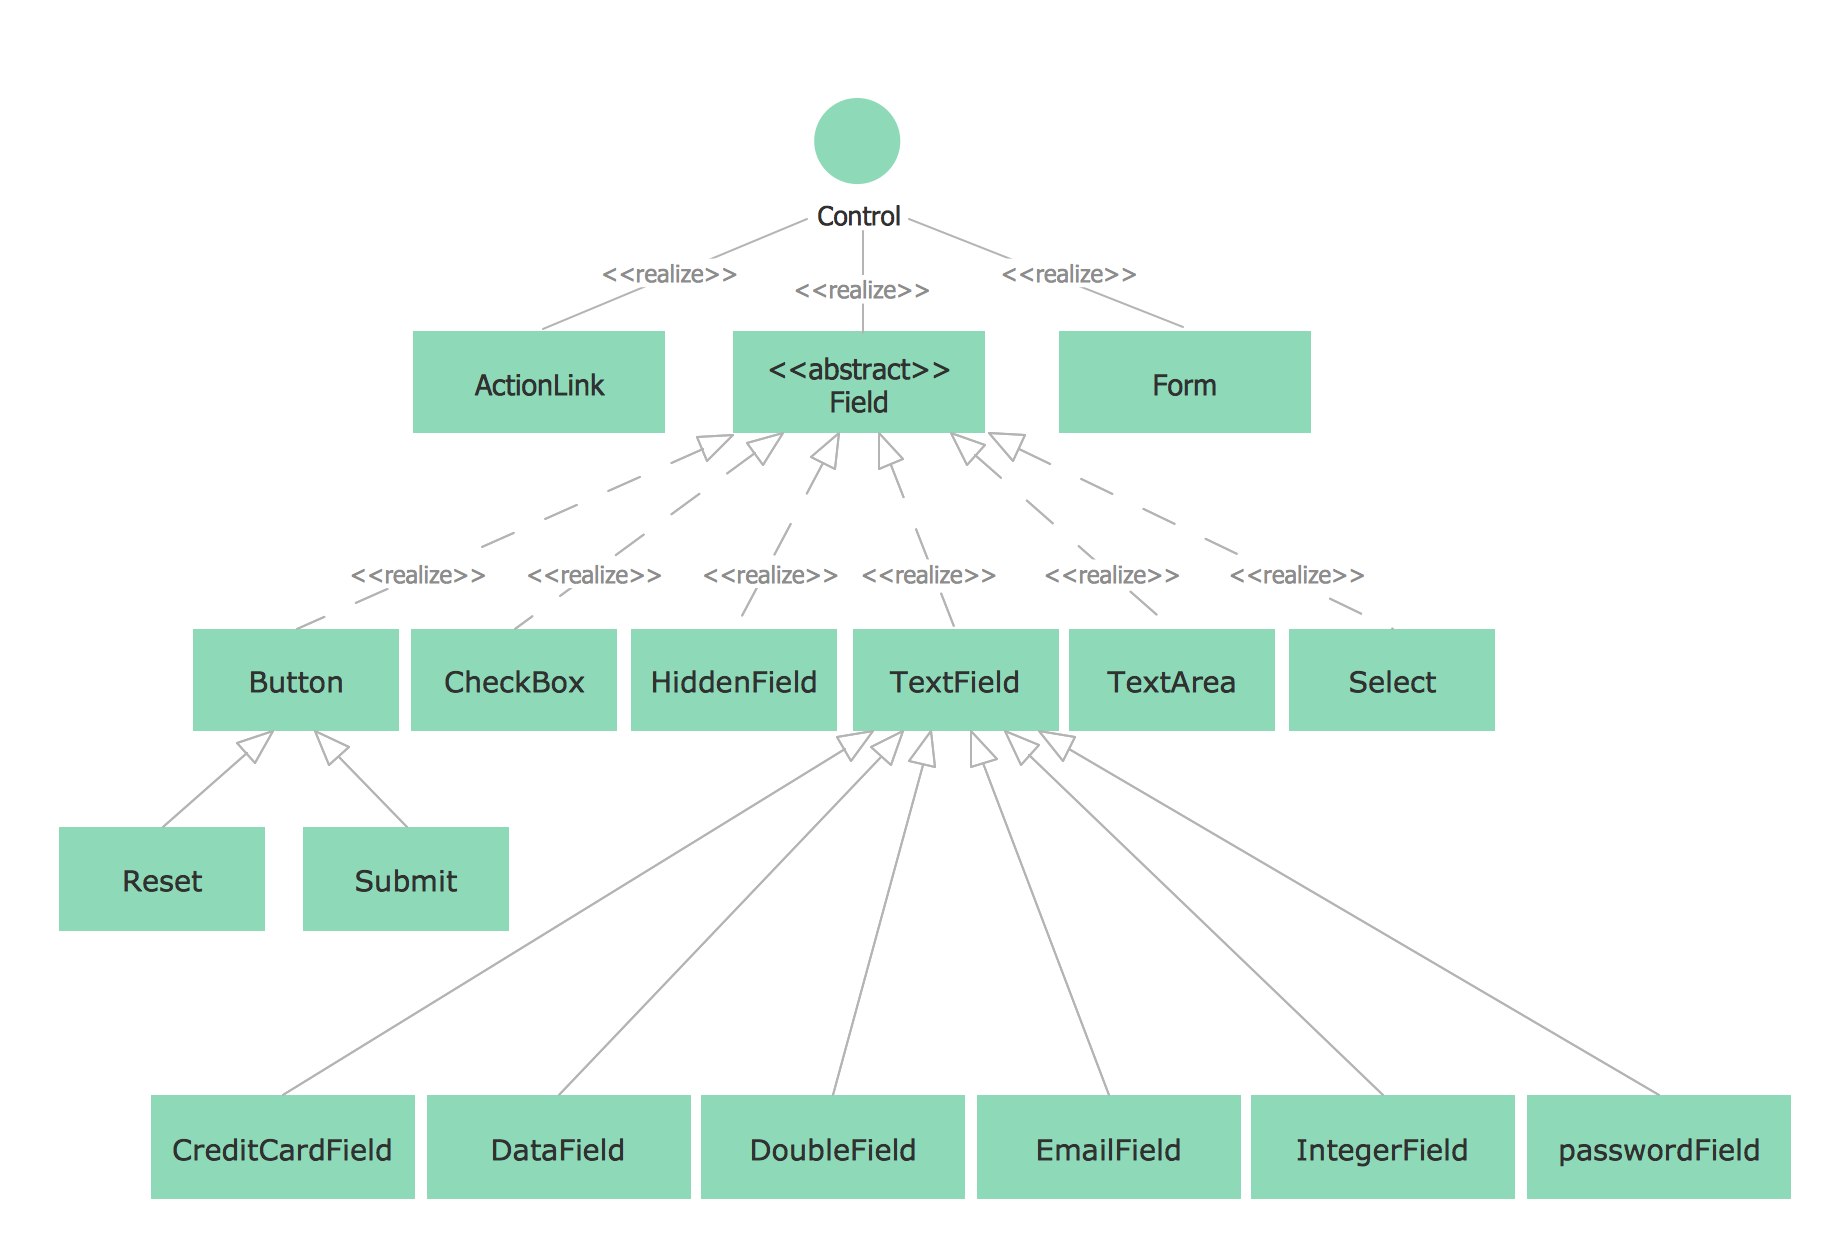
Picture: UML Class Diagram Notation
Related Solution:
Database design is an important part of any project, as databases become more and more complex nowadays. To make the model more representative, entity relationship diagrams are widely used in software engineering area. These diagrams show sets of entities as rectangles connected via lines labeled with their cardinalities.
This an example of the ER-diagram developed to store information regarding some online role-playing game. It includes three main elements of ER diagram: entities, relationships and attributes. The entities, attributes and relationships on this ER-diagram is depicted according to the Chen's notation. Chen's notation for Entity Relationship diagrams admits using of rectangles to depict entities, ovals for attributes and ,at least, diamonds to show relationships. ConceptDraw Entity-Relationship Diagrams solution was applied as ERD software to create this diagram.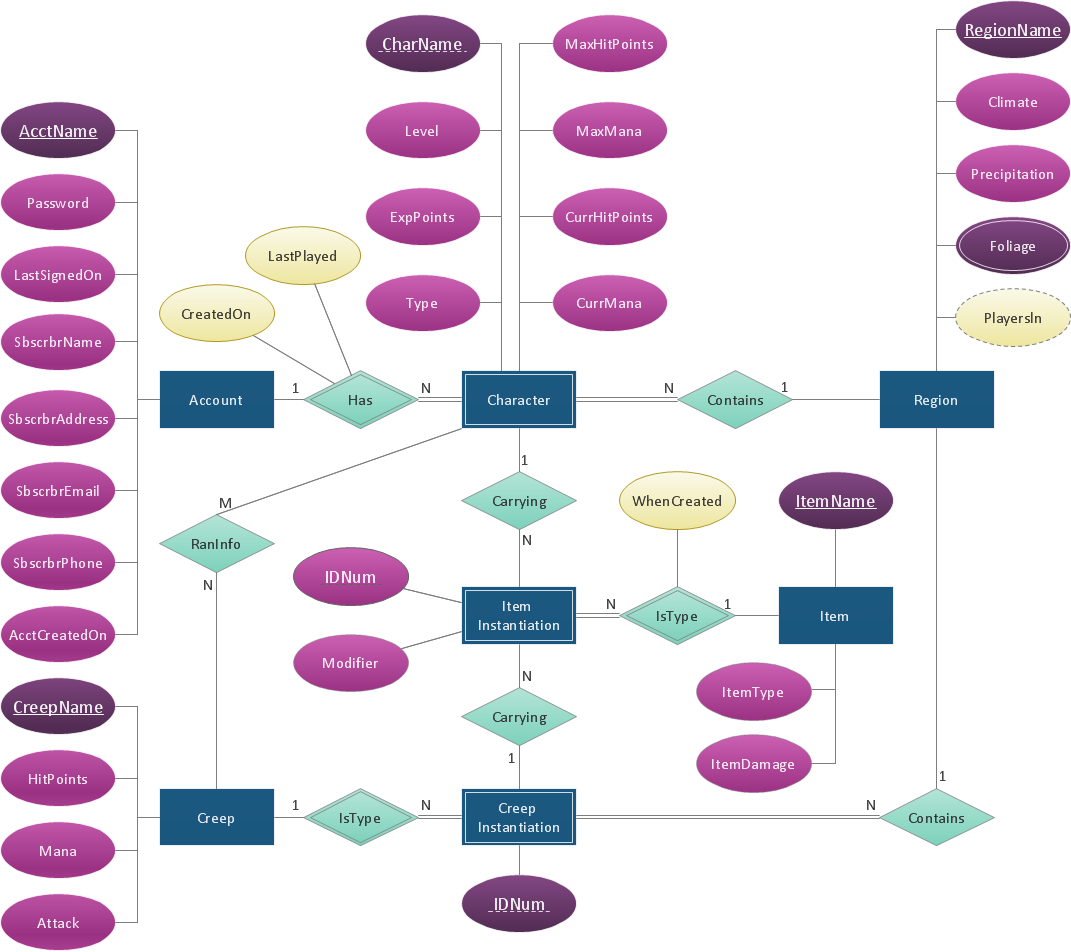
Picture: ConceptDraw DIAGRAM ER Diagram Tool
Related Solution:
There are many ways to describe a database structure. One of the most usual is to draw an entity relationship diagram (ERD) using a Crow’s Foot notation to represent database elements. If you don’t want to draw it on paper, you should use an appropriate software.
An entity-relationship (ER) diagram is used to show the structure of a business database. ERD represents data as objects (entities) that are connected with standard relationships symbols which Illustrate an association between entities. ERD, there is a wide range of ERD notations used by data bases architects for reflecting the relationships between the data entities. According to the crow’s foot notation relationships are drawn as single labeled lines designating a certain kinds of relationship. Crow foot notation is a most frequently used ERD standard, because of improved readability of diagrams, with a more accurate use of space on the page._Win_Mac.png)
Picture: Entity Relationship Diagram - ERD - Software for Design Crows Foot ER Diagrams
Related Solution:

