Oil and Gas Industry Infographics
Oil and gas are some of the world’s most important natural resources. They are the main sources of energy on the planet and play an essential role in manufacturing. A significant part of the extracted oil is also spent on non-energy needs, i.e. on processing into components for other products. There are many industries where oil and gas are used. In this way, the oil and gas companies are a major force in the global energy sector. They have an incredible influence on international economics and politics.
The list of products produced from oil is really wide. It's hard to believe but a lot of things we use in everyday life are the products of the oil industry. First of all, these are gasoline, diesel, liquefied gas, jet fuel, liquid boiler fuel, kerosene, aviation fuel, fuel oil. Oil is also used in manufacturing furniture, tableware, plastic and rubber products, toys, fabrics, medicines, paint and varnish materials, detergents, fertilizers, etc. In turn, natural gas is most often used for energy — electric and thermal, but it is also applied for the production of fertilizers, fuels, paints, and much more.
The infographics made for the oil and gas industry can provide a summary of the industry. They are useful to depict the largest and most influential oil and gas companies in the world. The oil and gas infographics are used to generate a ranking of the world’s largest companies based on the different factors. You can rank oil producers by production in barrels per day, by profit, etc. Use the visual representation of data to compare values for each company in different months or years, and evaluate perspective.
The detailed infographics allow explaining key concepts and standards of the industry, detecting the energy consumption trends in a visual form. You can evaluate the global oil usage, demand, and also difference between supply and demand. The oil and gas infographics support you in tracking changes in values within one year and over the different years, detecting the periods of stability and dramatic fluctuations. They allow easy detecting the factors having the greatest impact and forecasting the energy industry for the future. They are also the best to provide an overview of the prospects and challenges facing the industry. The infographics allow expressing new ideas for changes and improvements in a visual form and presenting the results of the last international energy forums.
ConceptDraw DIAGRAM enhanced with Oil and Gas solution is useful to create a variety of infographics for the oil and gas industry. It also supports you in designing the safety and warning infographics. They are important because all stages of oil and gas mining and use, processing, and transportation are conjugated with a certain level of danger. Oil, gas and their refining products are highly flammable materials, some of them are stored and transferred under the high-pressure. These factors entail a high risk of explosion and ignition. In this regard, the safety instructions and warning announcements are not just desirable, but mandatory.
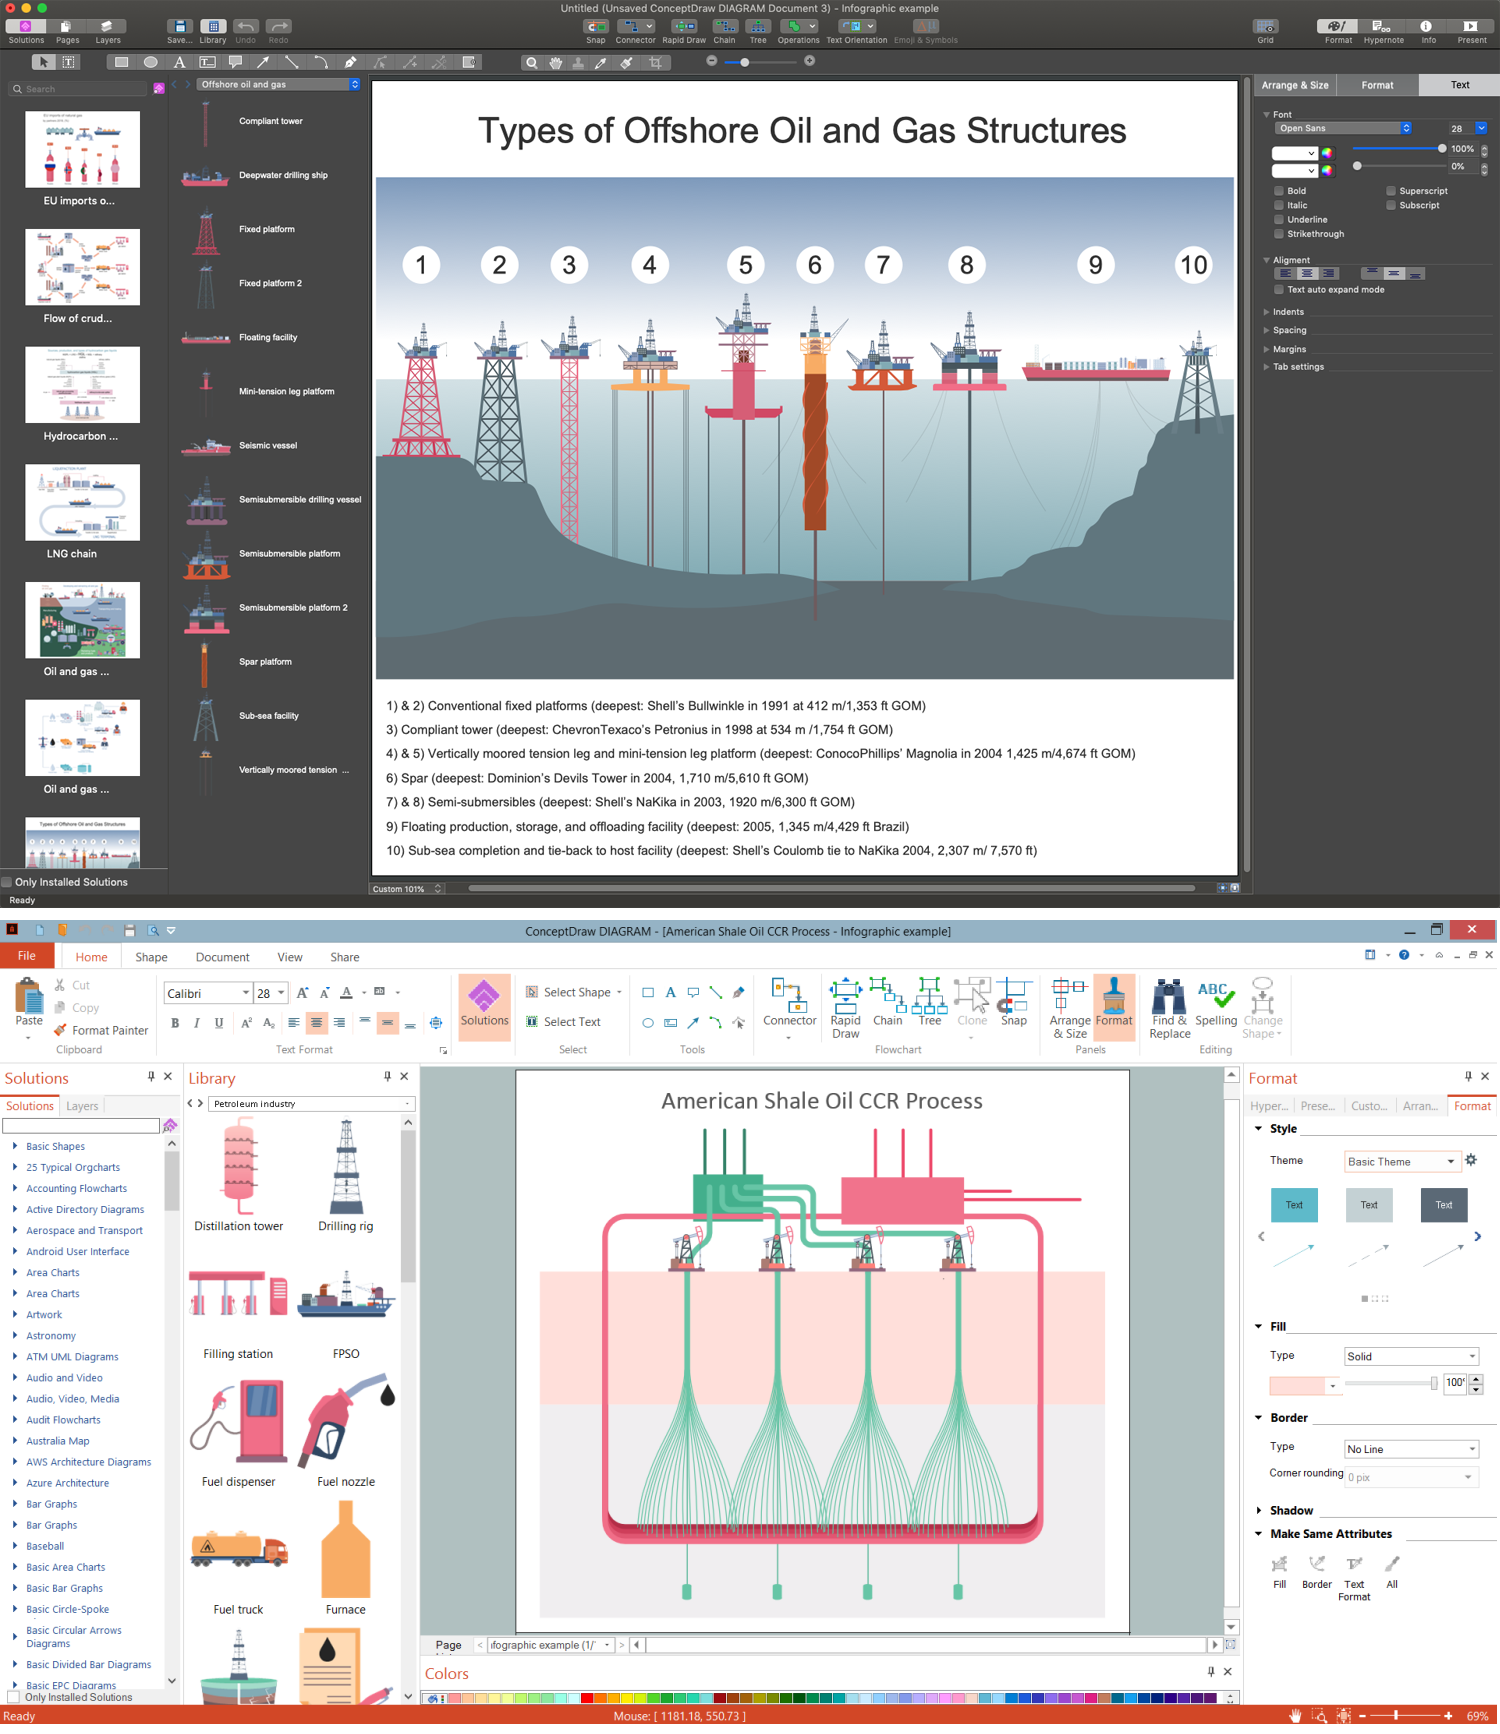
Example 1. Oil and Gas Industry Infographics in ConceptDraw DIAGRAM for Win and Mac
Use the Oil and Gas solution to create appealing and exhaustive oil and gas industry infographics, illustrations, diagrams, schematics. You can start your drawing with one of the samples included in the solution's collection or design your infographic in a new document. Use the large collection of pre-made design elements - petrochemical industry symbols, icons for the petroleum industry, gas industry, petrochemical products, and much more.
The resulting illustrations and diagrams are perfect for use in reports on the newest researches and trends in the oil and gas industry. Involve these infographics to illustrate the scientific materials, official documents, news, videos, articles in professional magazines, websites, blogs, pages on social networks, etc.

Example 2. Oil and Gas Infographics - LNG Chain
The samples you see on this page were created in ConceptDraw DIAGRAM software using the Oil and Gas Solution for ConceptDraw Solution Park. They are the best examples of oil and gas industry infographics. An experienced user spent 10-15 minutes creating each of these samples.
Use the Organizational Charts Solution for ConceptDraw DIAGRAM software to develop your own professional-looking diagrams related to the oil and gas industry quickly, simply, and effectively.
The possibility of exporting to a variety of popular graphical formats (PNG, JPEG, JPG, GIF, TIF, TIFF, BMP, DIB, EMF, SVG) and file formats like Microsoft PowerPoint (PPT), Adobe Acrobat (PDF), Microsoft Visio (VDX, VSDX), Adobe Flash (SWF), Encapsulated PostScript (EPS), HTML, opens wide opportunities for you.