Winter Sports.
Olympic Games Illustrations. Medal Summary
Medal Summary Illustration
ConceptDraw DIAGRAM software extended with the Winter Sports solution gives you a flexible tool to visualize Olympic schedules and results to illustrate your post, article or just keep personal statistics.
The Winter Sports solution delivers a complete set of samples and templates you can easily modify to visualize information about your favourite sports, such as tournament schedule or medal summary.
The library objects are scalable vector images that can be easily exported to PDF format, Microsoft PowerPoint, Microsoft Visio, graphic image file, or HTML.

Sample 1. Medal Summary Freestyle Skiing at the 2010 Winter Olympics
The Winter Sports solution from Sport Area of ConceptDraw Solution Park contains winter sports illustrations and diagram examples, templates, and vector sport pictogram libraries.
This example was created in ConceptDraw DIAGRAM using the 'Winter Sports Symbols' library, from our Winter Sports Solution. An experienced user spent 15 minutes creating this sample.
Using a visual format for Olympic Game results lets you compare the competing countries results in sports competitions. This is a good way to illustrate your analysis and share it.
SIX RELATED HOW TO's:
Competitor analysis is a first and obligatory step in elaboration the proper corporate marketing strategy and creating sustainable competitive advantage. Use powerful opportunities of numerous solutions from ConceptDraw Solution Park for designing illustrative diagrams, charts, matrices which are necessary for effective competitor analysis.
Picture: Competitor Analysis
Related Solution:
The vector stencils library Rail transport contains clipart of railway transport for ConceptDraw DIAGRAM diagramming and vector drawing software.
Use it to draw illustrations of trains and transportation of passengers and goods by railroads.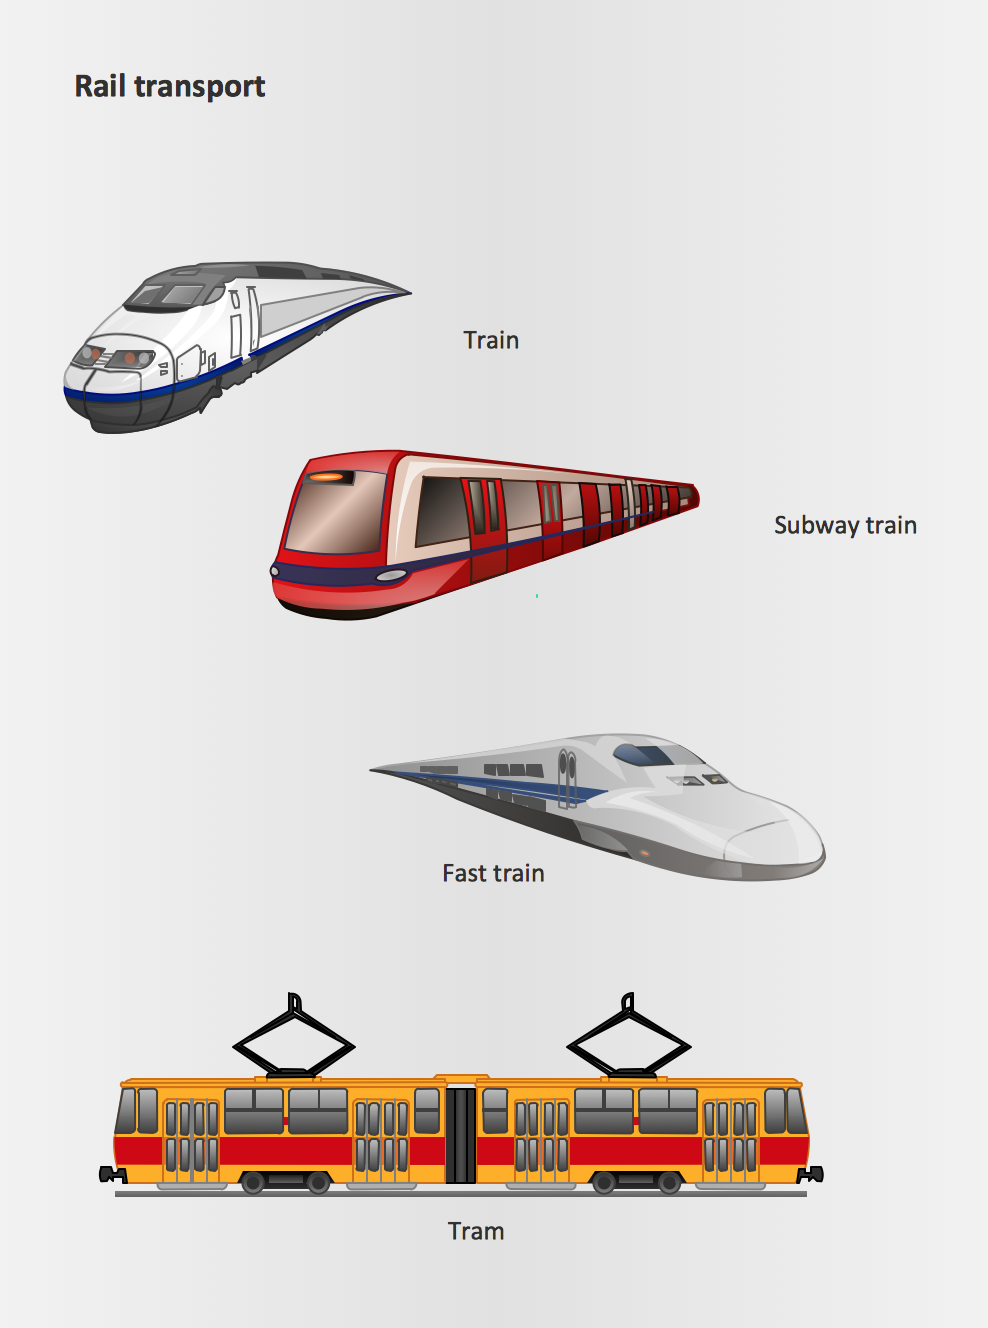
Picture: Rail transport - Design elements
Related Solution:
The power, economy, and versatility of ConceptDraw MINDMAP takes personnel and team productivity to another level. Discover today what this means to you.
Picture: Mind Map Making Software
Related Solution:
The Winter Sports solution from Sport Area of ConceptDraw Solution Park contains winter sports pictogram you may use illustrating any kind of material about Olympic Games or any other sport competitions.
Picture: Winter Sports.Using Winter Sports Design Elements Producing Infographics
Related Solution:
How to draw pictorial chart quick, easy and effective? ConceptDraw DIAGRAM offers the unique Pictorial Infographics Solution that will help you!
Pictorial Infographics solution contains large number of libraries with variety of predesigned vector pictograms that allows you design infographics in minutes. There are available 10 libraries with 197 vector pictograms.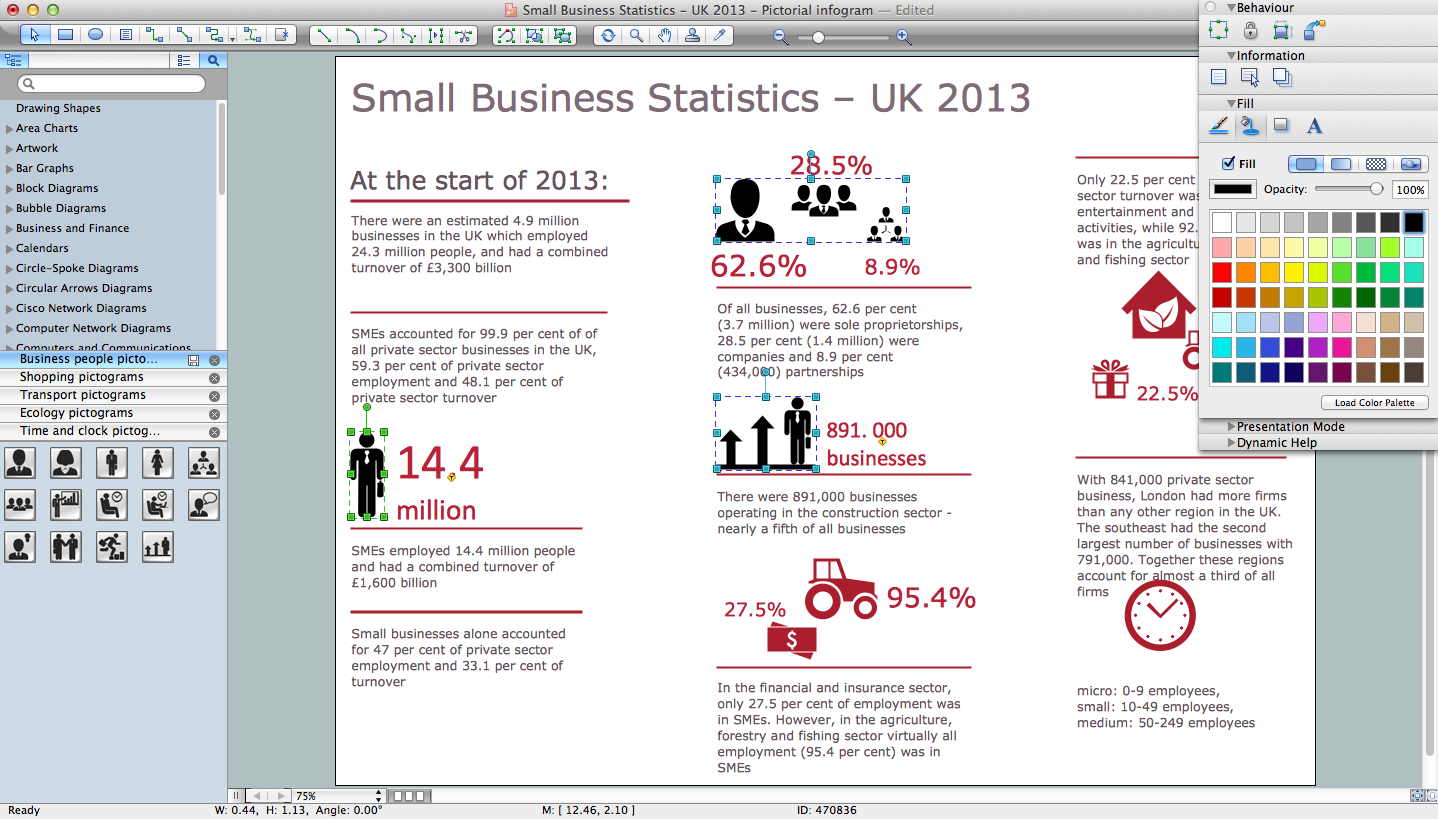
Picture: How to Draw Pictorial Chart. How to Use Infograms
Related Solution: