
Pic. 1. OOSE method example.
This sample shows the OOSE diagram with aggregation and composition associations.
Using the Rapid UML Solution for ConceptDraw DIAGRAM you can create your own professional OOSE Diagrams quick and easy.
The OOSE diagrams produced with ConceptDraw DIAGRAM are vector graphic documents and are available for reviewing, modifying, and converting to a variety of formats (image, HTML, PDF file, MS PowerPoint Presentation, Adobe Flash or MS Visio).
SEVEN RELATED HOW TO's:
The UML Diagrams are widely used by software developers and software engineers. They can draw the UML Diagrams manually on the paper, but it is incredibly convenient to use the special UML diagramming software. The UML diagramming software allows you to draw the UML Diagrams in a few minutes.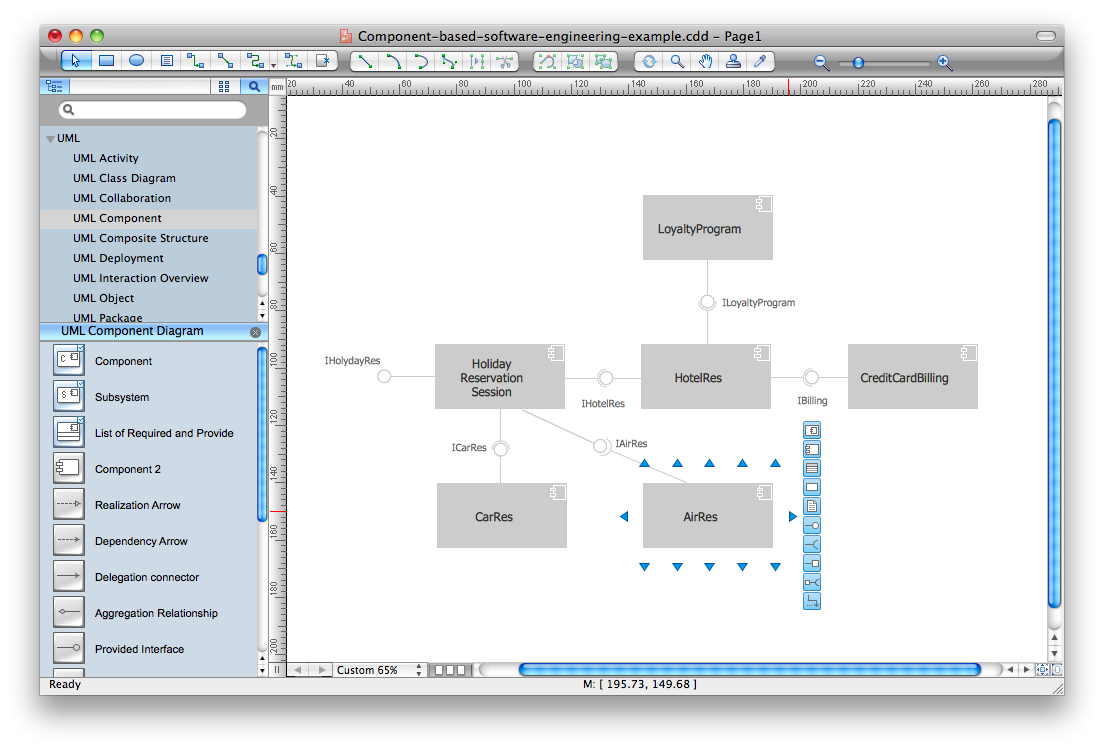
Picture: UML Diagram Software
Related Solution:
When you are a beginner in software development, you make a lot of mistakes. Developing logical models, or data flow diagrams is a way to see the the whole project and all the processes clearly. And some novices, unfortunately for them, miss modeling stage at the beginning of project life cycle, and get into troubles as the project grows.
This image represents the data flow diagram applying symbols of Yourdon and Coad notation. This DFD depicts the data flow inside an organization department deals with receivables. The icons of standard Yourdon and Coad notation provides possibility to draw professional looking and well- readable DFD for business documentation. This data flow diagram was designed with the help of ConceptDraw DIAGRAM and its Data Flow Diagrams solution. The solution delivers three vector graphic libraries including elements of Yourdon and Coad and Gane-Sarson notations.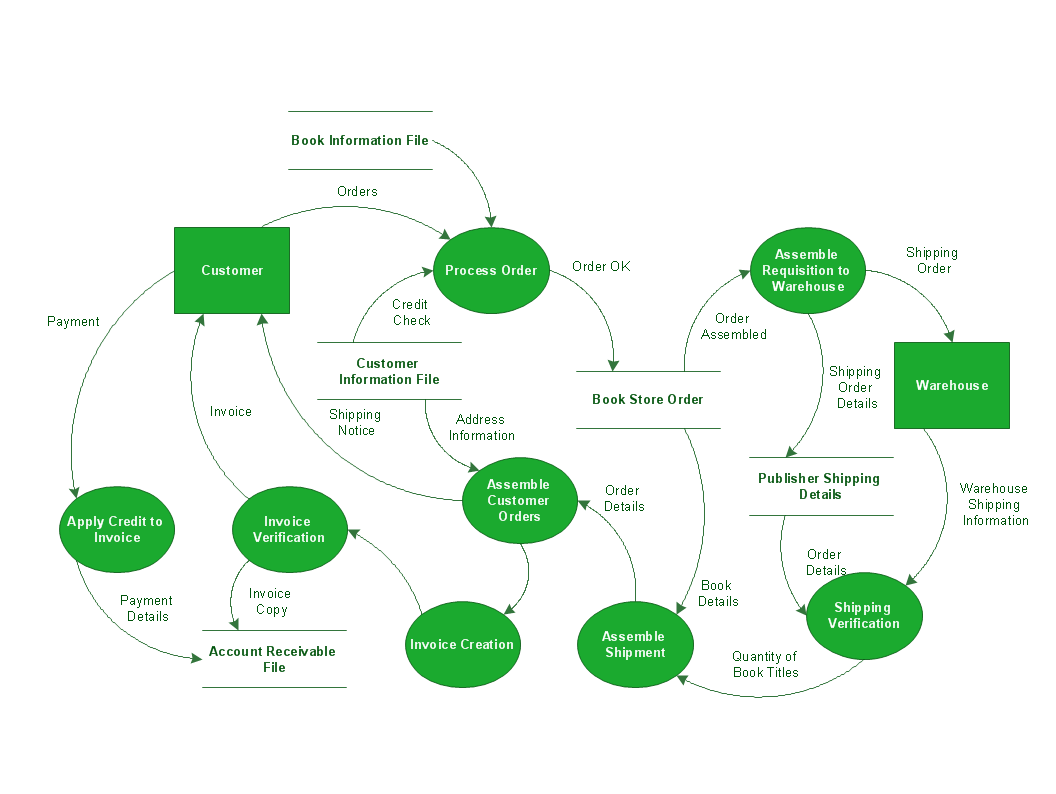
Picture: Data Flow Diagram Process
Related Solution:
There are many ways to define the flow of information within a system. Structured-systems analysis method often uses data flow diagrams to show data flow, data storages and data processing visualization. These diagrams are easy to develop and quite useful.
Here is a dataflow diagram presenting an example of the manufacturing process flow. The oval process shapes represent a process that controls data within the current system. The process may produce data or make some action based on data. Data flows are represented by lines. They show the movement of information through the system. The direction of the data flow is depicted by the arrow. The external entities are shown by rectangles. They represent the external entities interacting with the system. The data store objects (unclosed rectangles) are used to show data bases participating in a process flow.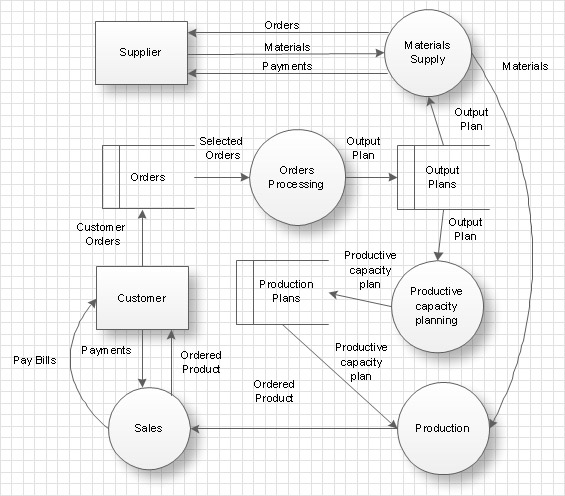
Picture: Data Flow Diagram
Related Solution:
Structured-systems analysis and design method uses data flow diagrams to represent the process of data flowing through a system. Talking about this might be useless without a proper example of DFD for online store (Data Flow Diagram). This DFD example shows all the distinctness that a diagram can bring into a scattered data structure.
Data flow diagrams are used to show how data is processed within some business processes. Making DFD is a common practice for business process modeling and analysis. This diagram represents the online store business flow. It describes inputs and outputs within online selling process and depicts the interactions between its participants. This DF diagram can be used by system analysts to create an overview of a business, to study and discover its inherent strengths and weak points.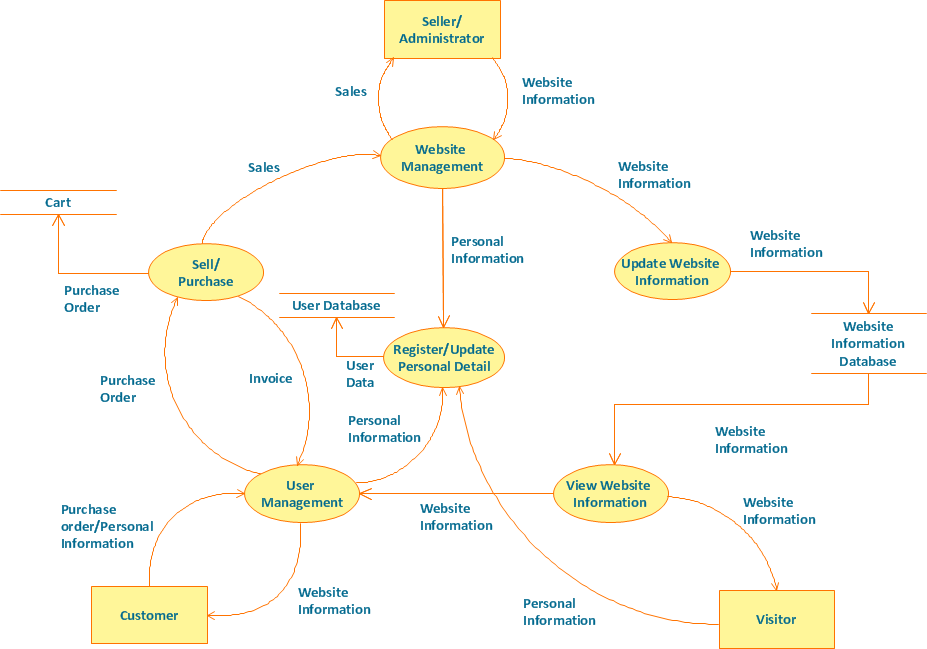
Picture: Example of DFD for Online Store (Data Flow Diagram)
Related Solution:
State Diagram UML of Online Store. This sample was created in ConceptDraw DIAGRAM diagramming and vector drawing software using the UML Class Diagram library of the Rapid UML Solution from the Software Development area of ConceptDraw Solution Park.
This sample shows the work of the medical shop and is used at the creation of the medical shop or pharmacy project, for understanding the process of shopping in the medical shop, for keeping purchases, for medical supplies.
Picture: UML Class Diagram Example - Medical Shop
Related Solution:
Any information system receives data flows from external sources. In order to visualize them there is a list of data flow diagram symbols that describes how the system components cooperate. If you want to create a data flow diagram, ConceptDraw DIAGRAM Solution Park has DFD Library that contains both Yourdon and Gane-Sarson notations.
This figure shows the content of vector libraries, delivered with ConceptDraw solution for data flow diagram (DFD). There are three libraries composed from about 50 vector objects used to make data flow diagrams.
They include a complete set of objects utilized by Yourdon-Coad and Gane-Sarson notations - two primary notations that are apply for data flow diagramming. Also, one can discover additional "Data flow diagram (DFD)" library that provides a data flow diagram elements for designing level 1 and context-level data flow diagrams.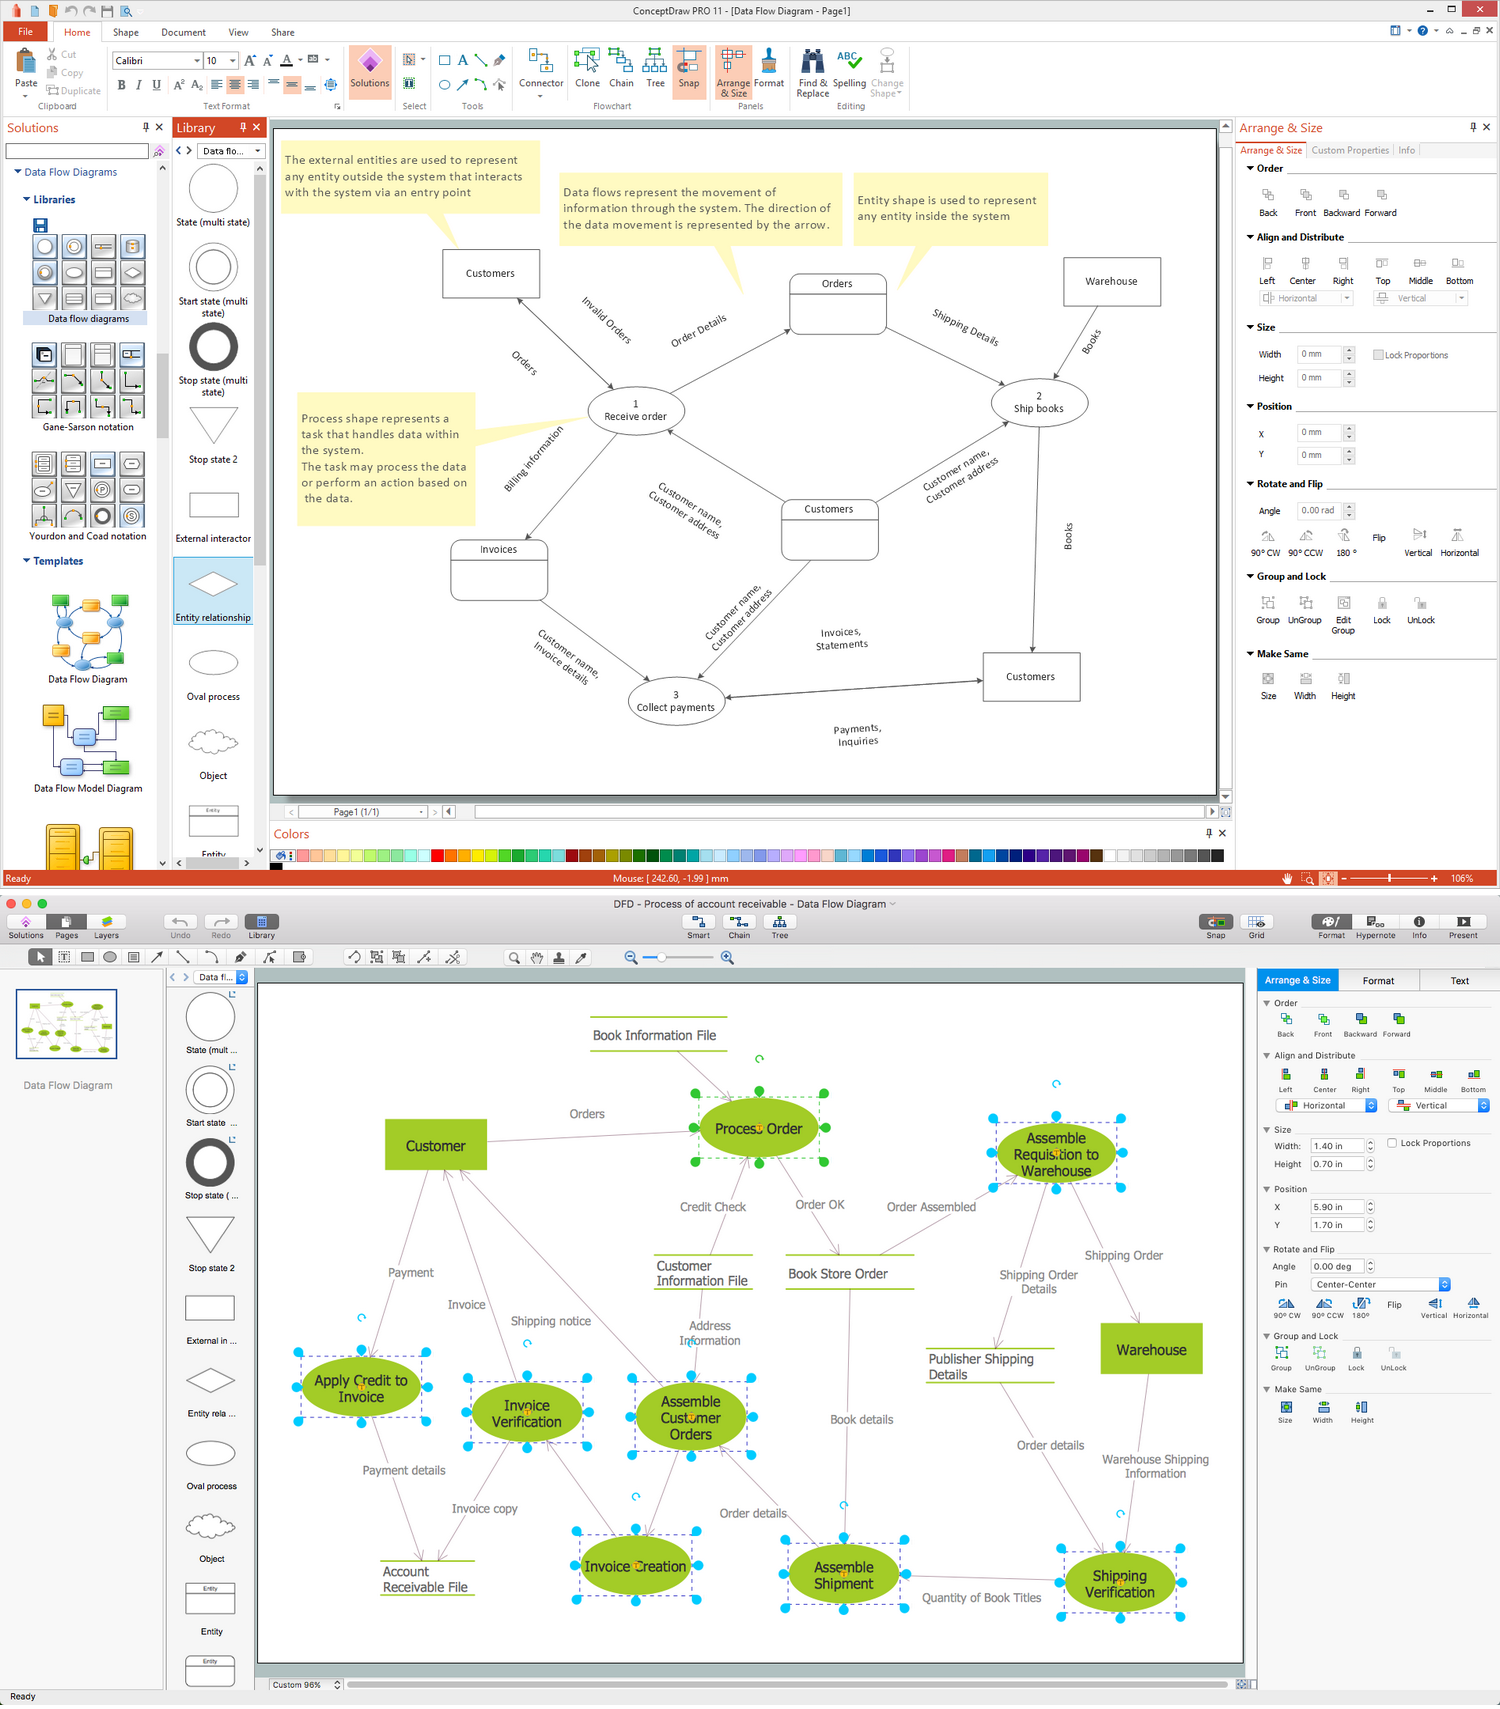
Picture: Data Flow Diagram Symbols. DFD Library
Related Solution:
ConceptDraw DIAGRAM is ideal for software designers and software developers who need to draw Booch OOD Diagrams.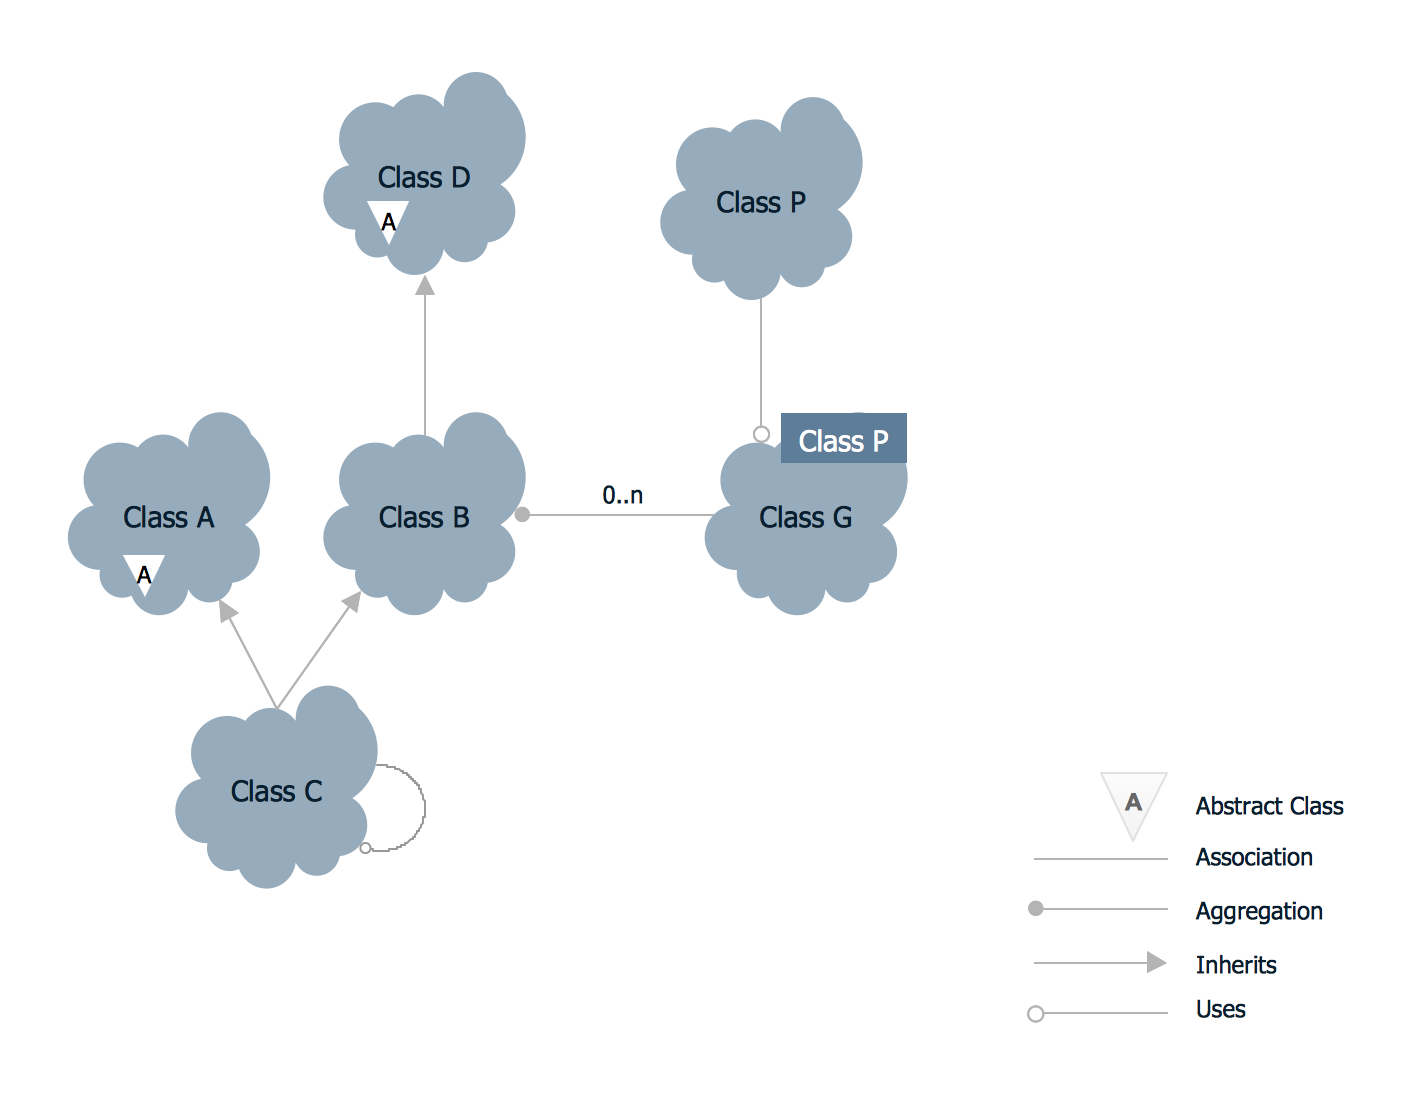
Picture: Booch OOD Diagram