
Example 1. Organic Chemistry Symbols
Chemistry Solution offers 6 libraries with 726 chemical equation symbols and organic chemistry symbols professionally designed for ConceptDraw DIAGRAM users. You can simply drag and arrange them at your document, add the text if need.
Chemistry Solution includes also variety of predesigned samples and examples. All they are available from ConceptDraw STORE which is the best for easy navigation through a ConceptDraw Solution Park. It is convenient that ConceptDraw STORE gives a quick access to all libraries, templates and samples directly from it.

Example 2. Organic Chemistry Drawing — Phenols
The samples you see on this page were created in ConceptDraw DIAGRAM software using the organic chemistry symbols from the libraries of Chemistry Solution. These organic chemistry schemes successfully demonstrate solution's capabilities and professional results you can achieve. An experienced user spent 5-15 minutes creating each of them.
Use the Chemistry Solution for ConceptDraw DIAGRAM software to create your own professional looking chemical drawings, diagrams, illustrations and schemes of any complexity quick, easy and effective.
All source documents are vector graphic documents. They are available for reviewing, modifying, or converting to a variety of formats (PDF file, MS PowerPoint, MS Visio, and many other graphic formats) from the ConceptDraw STORE. The Chemistry Solution is available for all ConceptDraw DIAGRAM or later users.
TEN RELATED HOW TO's:
You can see that when you rotate a group, connectors change their angle, keeping their position inside of the grouped objects. If you decide to ungroup the objects, the connectors will adjust to keep lines parallel to the edges of the sheet.
The magic of ConceptDraw Arrows10’s rotating group containing connectors, makes complex diagramming simple and easy.
The way to connect objects has never been easier.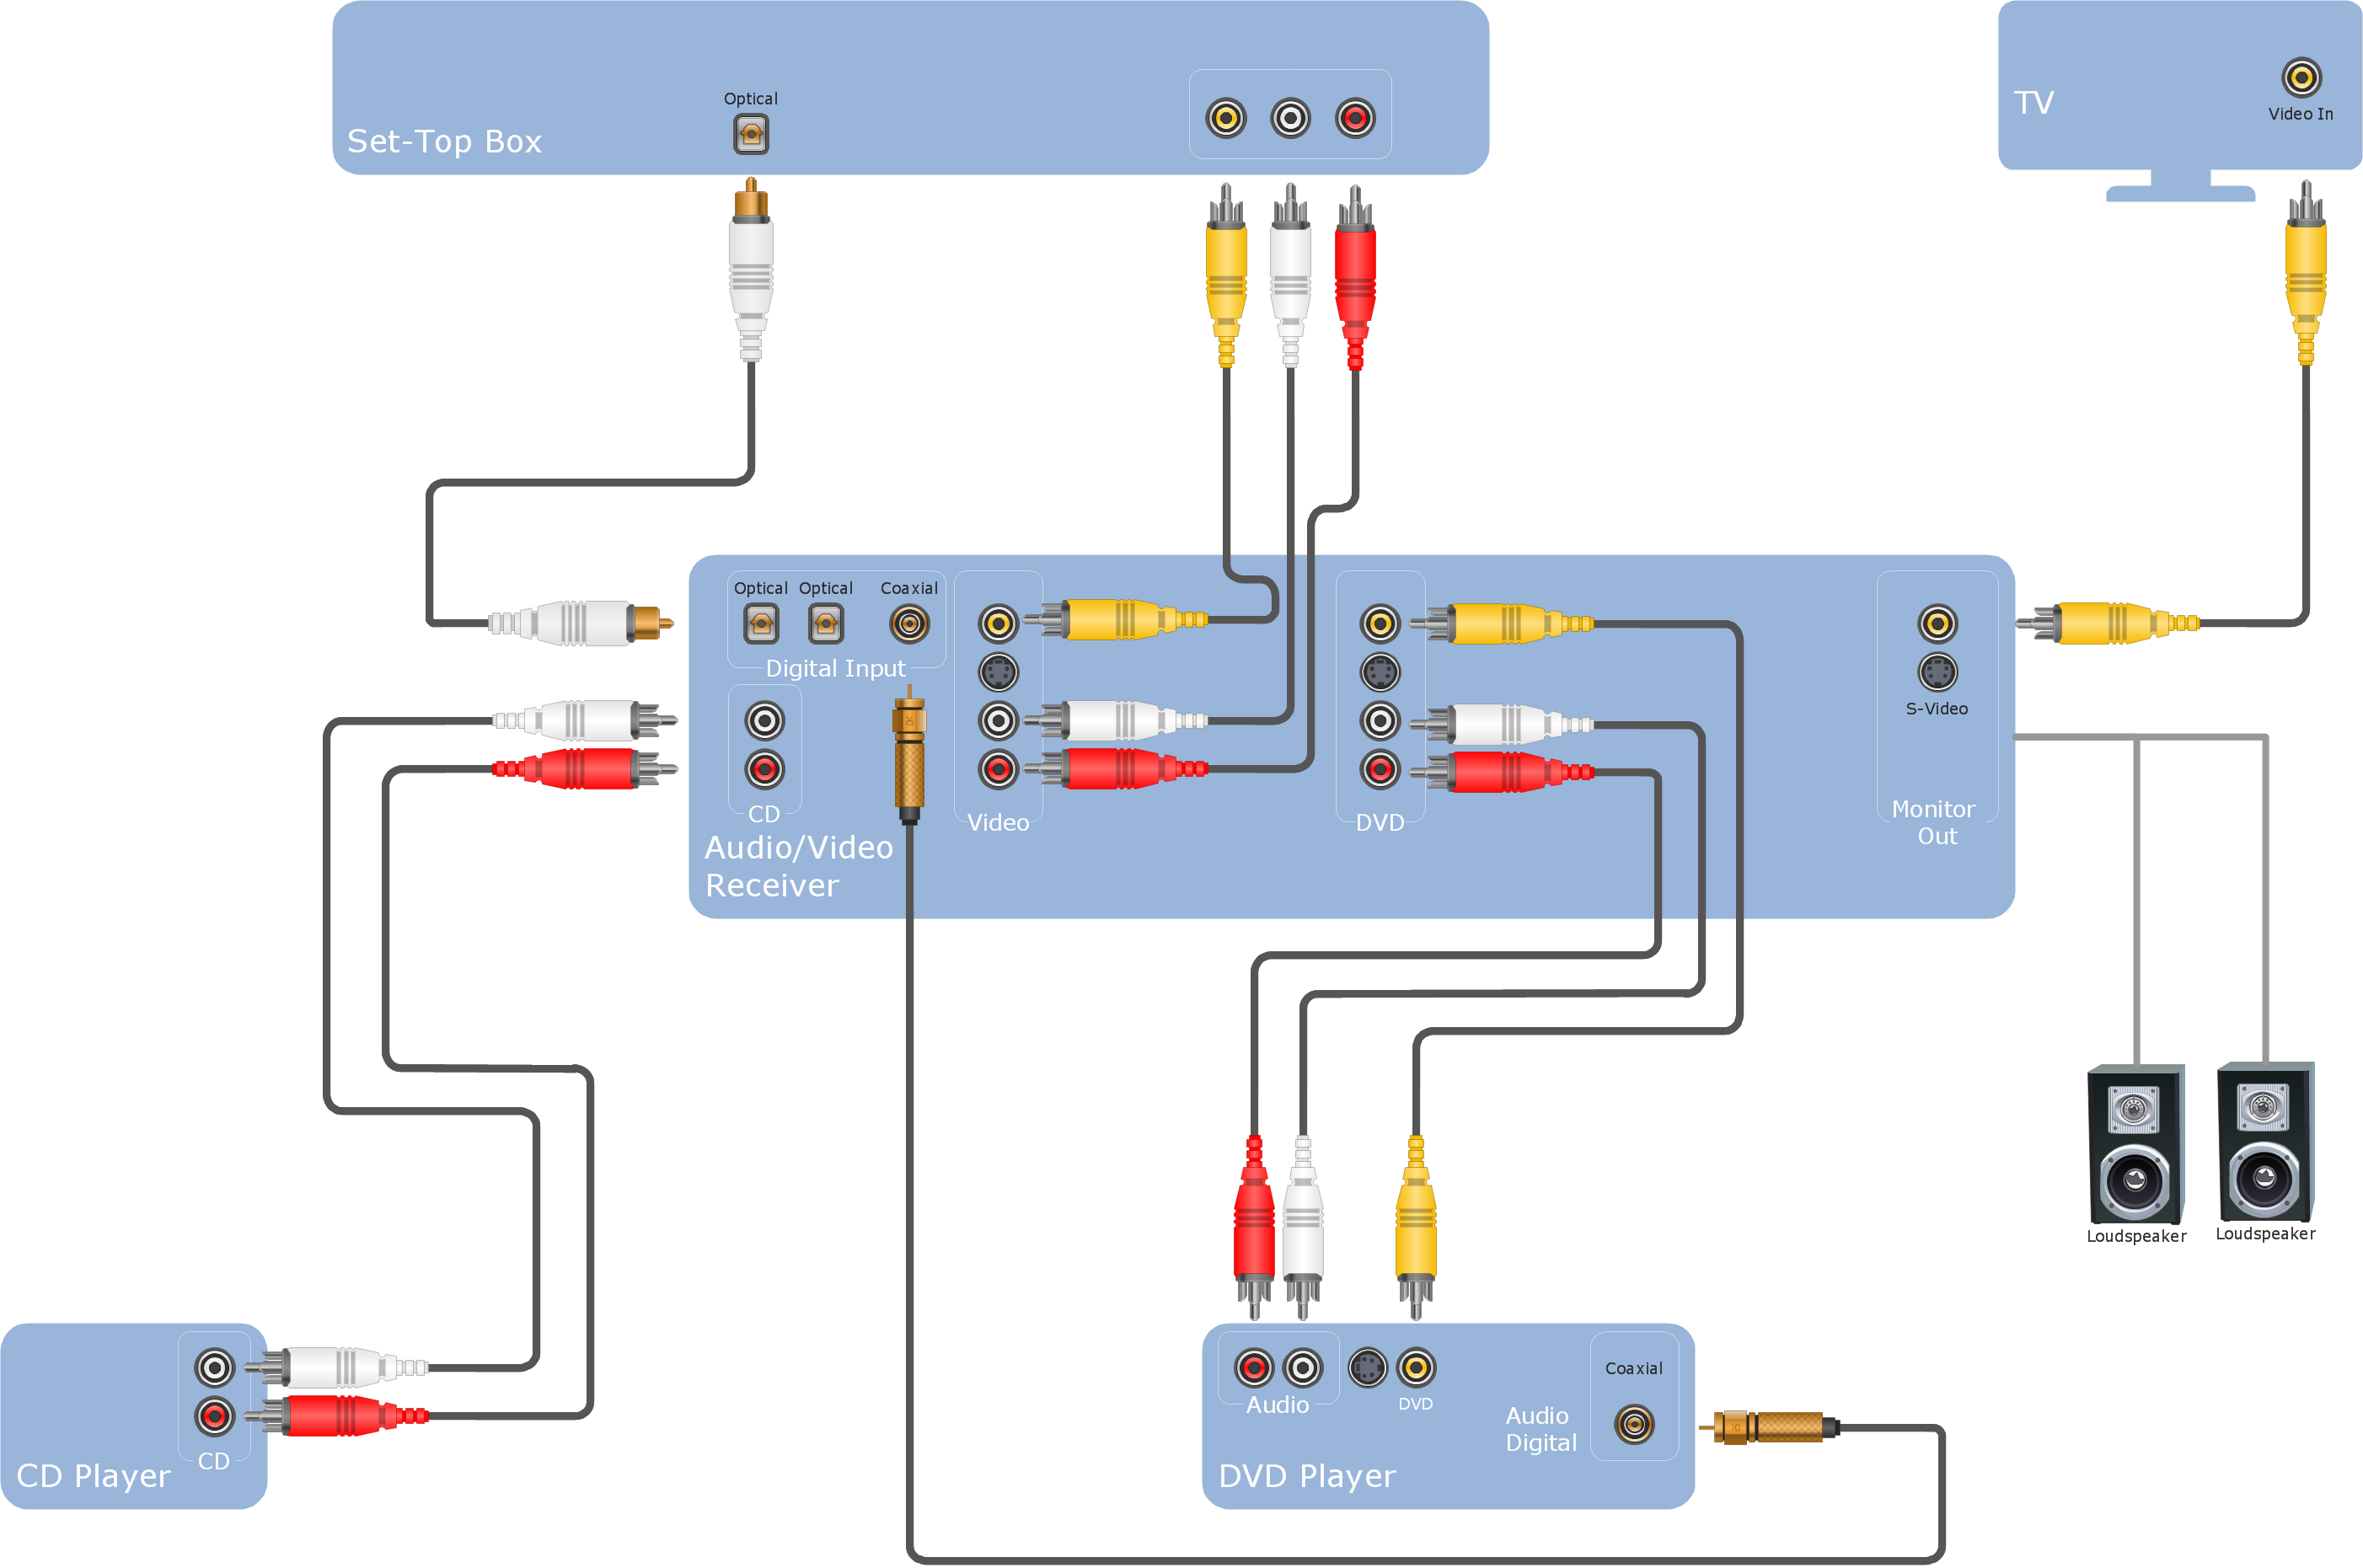
Picture: ConceptDraw Arrows10 Technology
Network community structure is a network which nodes can be easily grouped into the sets of nodes with dense internally connections.
This example shows a network that displays the community structure with three groups of nodes with dense internal connections and sparser connections between the groups.
Picture: Network Community Structure. Computer and Network Examples
Related Solution:
A Data Flow Diagram (DFD) is a graphical technique which allows effectively model and analyze the information processes and systems. The ability to fast and easy create the DFDs is made possible with Data Flow Diagrams solution from the Software Development area of ConceptDraw Solution Park. For designing the Data Flow Diagrams are used simple DFD flowchart symbols which are connected each other by arrows depicting the data flow from one step to another.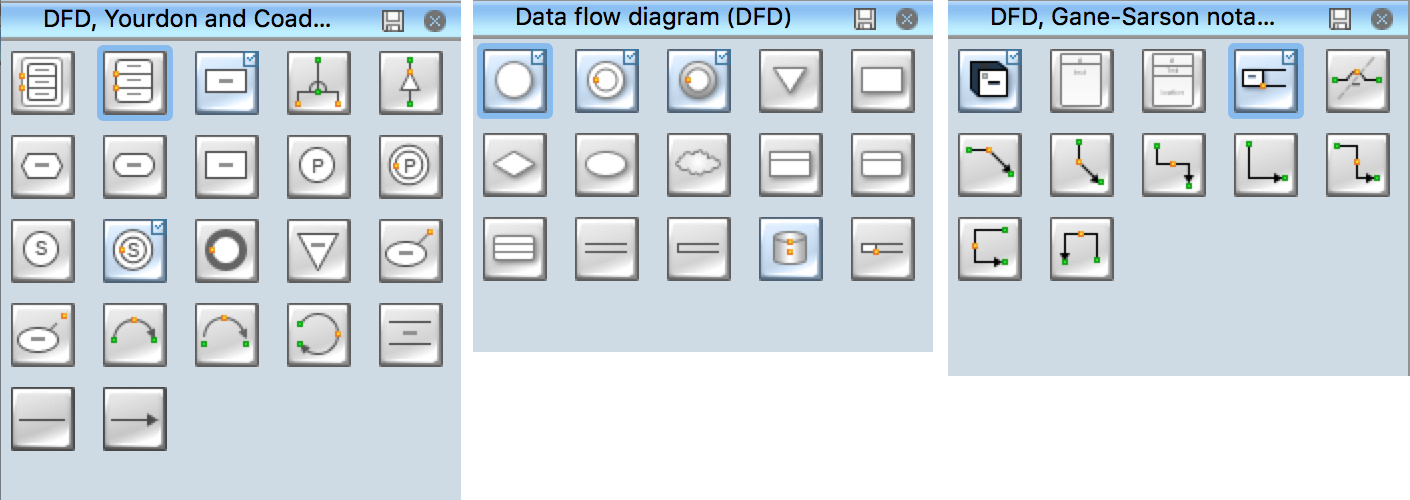
Picture: DFD Flowchart Symbols
Related Solution:
State Diagram UML of Online Store. This sample was created in ConceptDraw DIAGRAM diagramming and vector drawing software using the UML Class Diagram library of the Rapid UML Solution from the Software Development area of ConceptDraw Solution Park.
This sample shows the work of the medical shop and is used at the creation of the medical shop or pharmacy project, for understanding the process of shopping in the medical shop, for keeping purchases, for medical supplies.
Picture: UML Class Diagram Example - Medical Shop
Related Solution:
Any work process visualized as a workflow diagram becomes easier-to-analyse. To visualize work processes regularly we recommend to use ConceptDraw DIAGRAM software extended with the Workflow Diagrams solution. This software contains features and technologies designed to draw workflow diagrams faster.
Picture: Work Process
Related Solution:
The Total Quality Management Diagram solution helps your organization visualize business and industrial processes. Create Total Quality Management diagrams for business process with ConceptDraw software.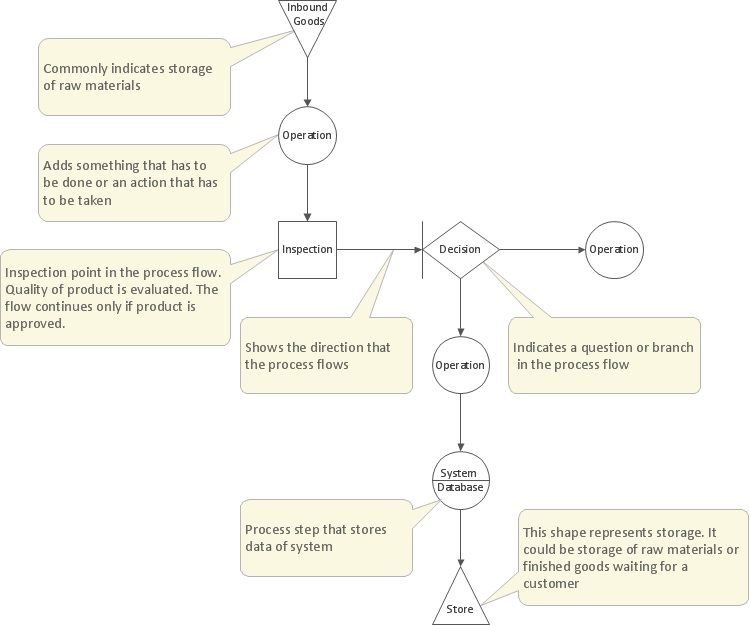
Picture: Management Tools — Total Quality Management
Related Solution:
If you want to find a way to understand complex things in minutes, you should try to visualize data. One of the most useful tool for this is creating a flowchart, which is a diagram representing stages of some process in sequential order. There are so many possible uses of flowcharts and you can find tons of flow charts examples and predesigned templates on the Internet. Warehouse flowchart is often used for describing workflow and business process mapping. Using your imagination, you can simplify your job or daily routine with flowcharts.
Warehouse flowcharts are used to document product and information flow between sources of supply and consumers. The flowchart provides the staged guidance on how to manage each aspect of warehousing and describes such aspects as receiving of supplies; control of quality; shipment and storage and corresponding document flow. Warehouse flowchart, being actual is a good source of information. It indicates the stepwise way to complete the warehouse and inventory management process flow. Also it can be very useful for an inventory and audit procedures.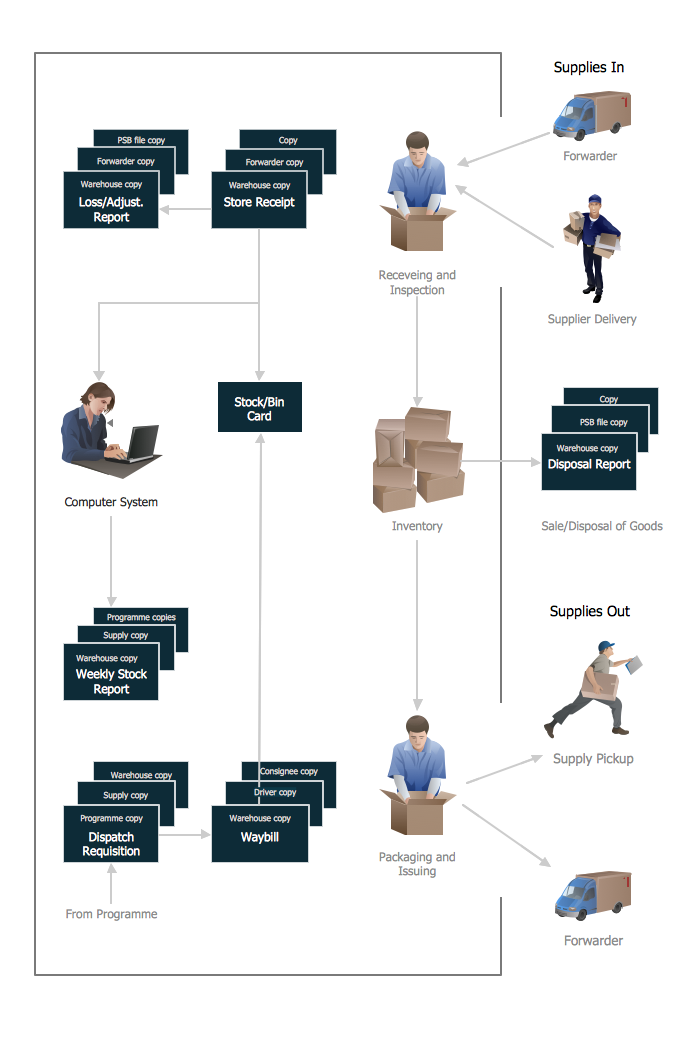
Picture: Flow Chart Example: Warehouse Flowchart
Related Solution:
A Venn diagram, sometimes referred to as a set diagram, is a diagramming style used to show all the possible logical relations between a finite amount of sets. Having ConceptDraw DIAGRAM software one allows anyone who cares for their drawings to look not only nice but also smart and professional.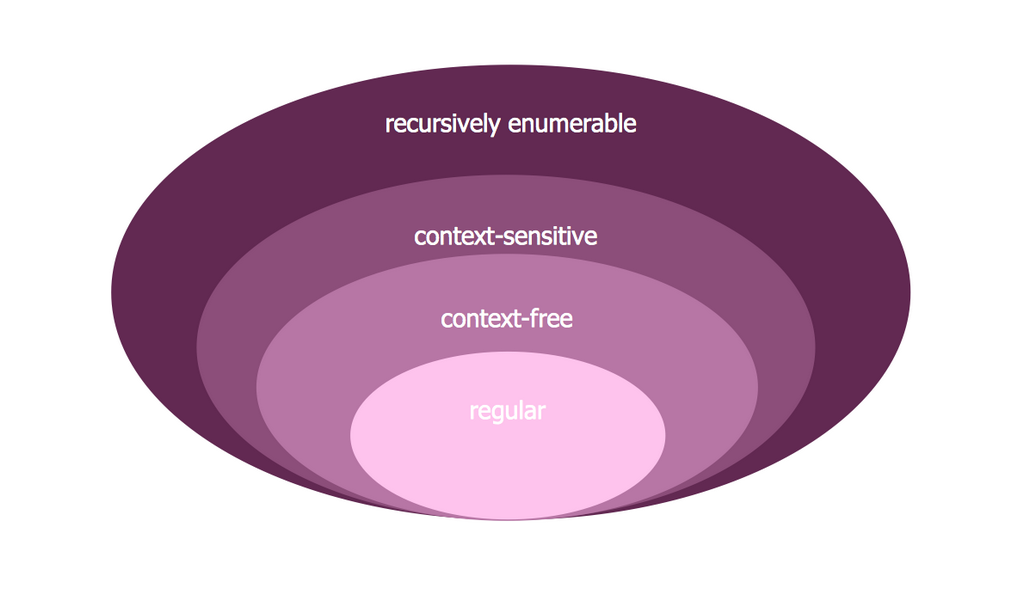
Picture:
Venn Diagram Examples for Problem Solving
Computer Science. Chomsky Hierarchy
Related Solution:
In general, you can use any icons to represent network equipment on a diagram. However, there are some icons, for instance, Cisco icons, shapes, stencils and symbols, that are recognizable worldwide. Using those icons you can create Cisco network topology diagrams in minutes and share them anywhere.
The icons depicting Cisco network equipment are recognized and generally applied as standard images for designing network diagrams. They are free to used , but can not be reworked. Cisco network diagrams are created to depict how signals processed on the network equipment and end-user computers and how data transfer through LAN or WLAN between nodes. The vector graphic library of ConceptDraw CISCO Network Diagrams solution includes about 90 icons of Cisco network equipment for designing computer network diagrams with ConceptDraw DIAGRAM.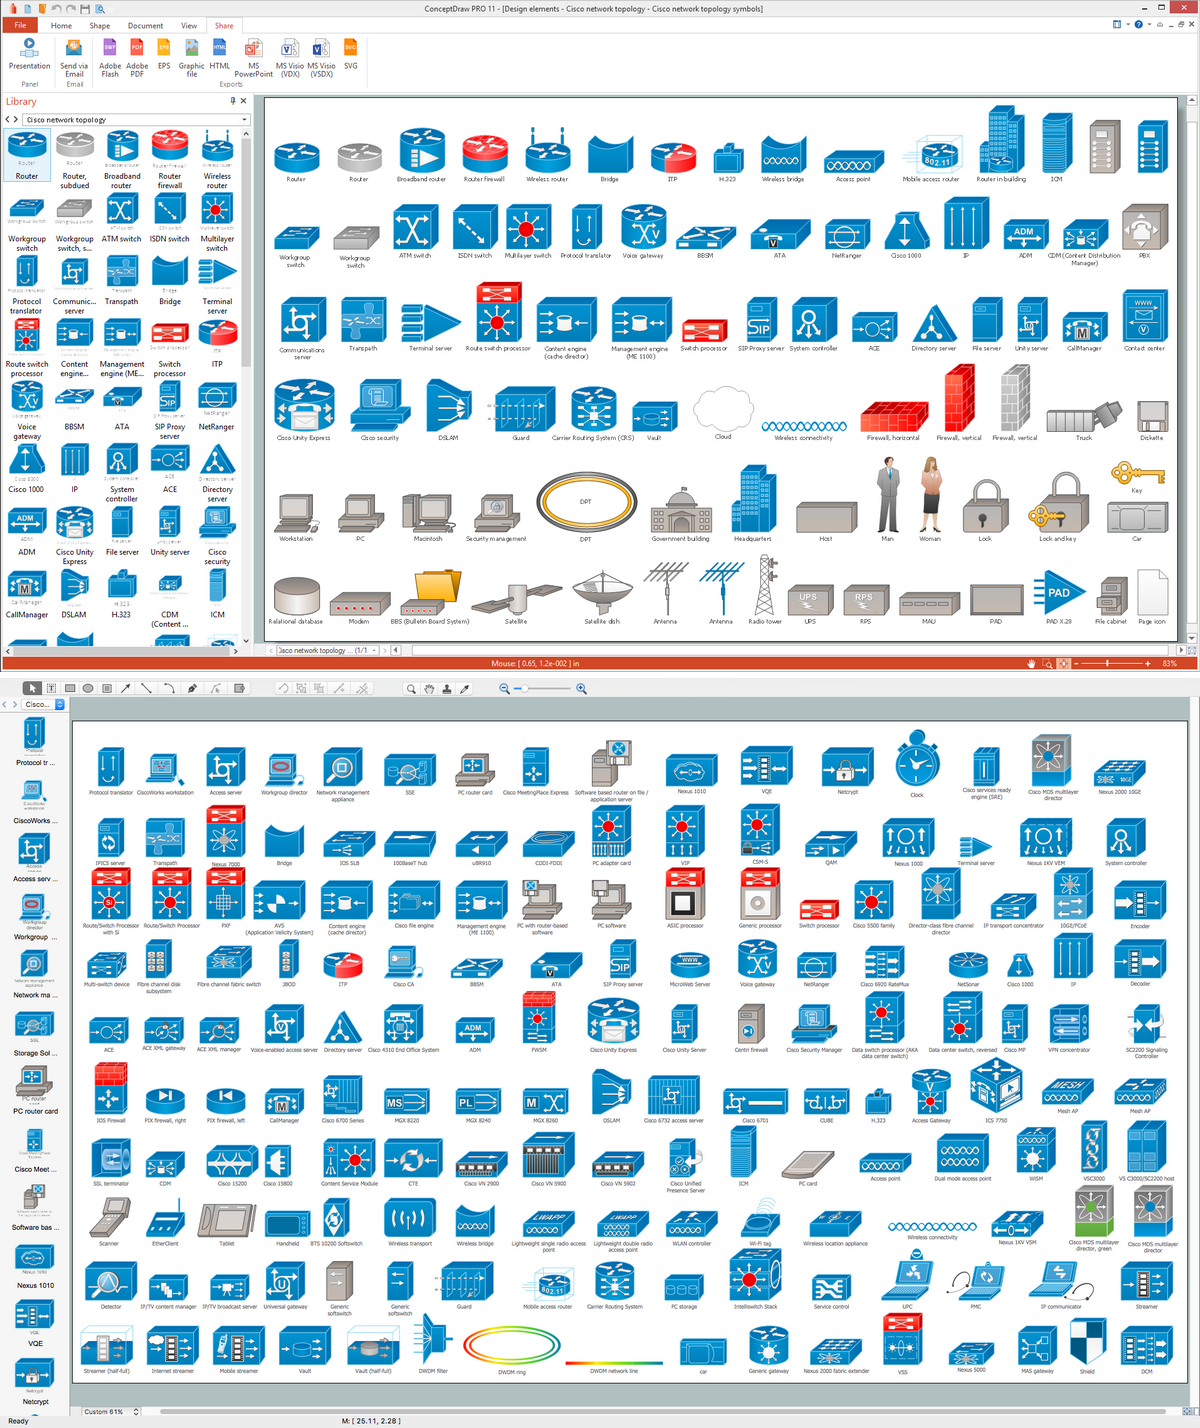
Picture: Cisco Network Topology. Cisco icons, shapes, stencils and symbols
Related Solution:
Visio Files and ConceptDraw. ConceptDraw DIAGRAM is compatible with MS Visio.VDX formatted files.VDX is Visio’s open XML file format, and it can be easily imported and exported by ConceptDraw DIAGRAM.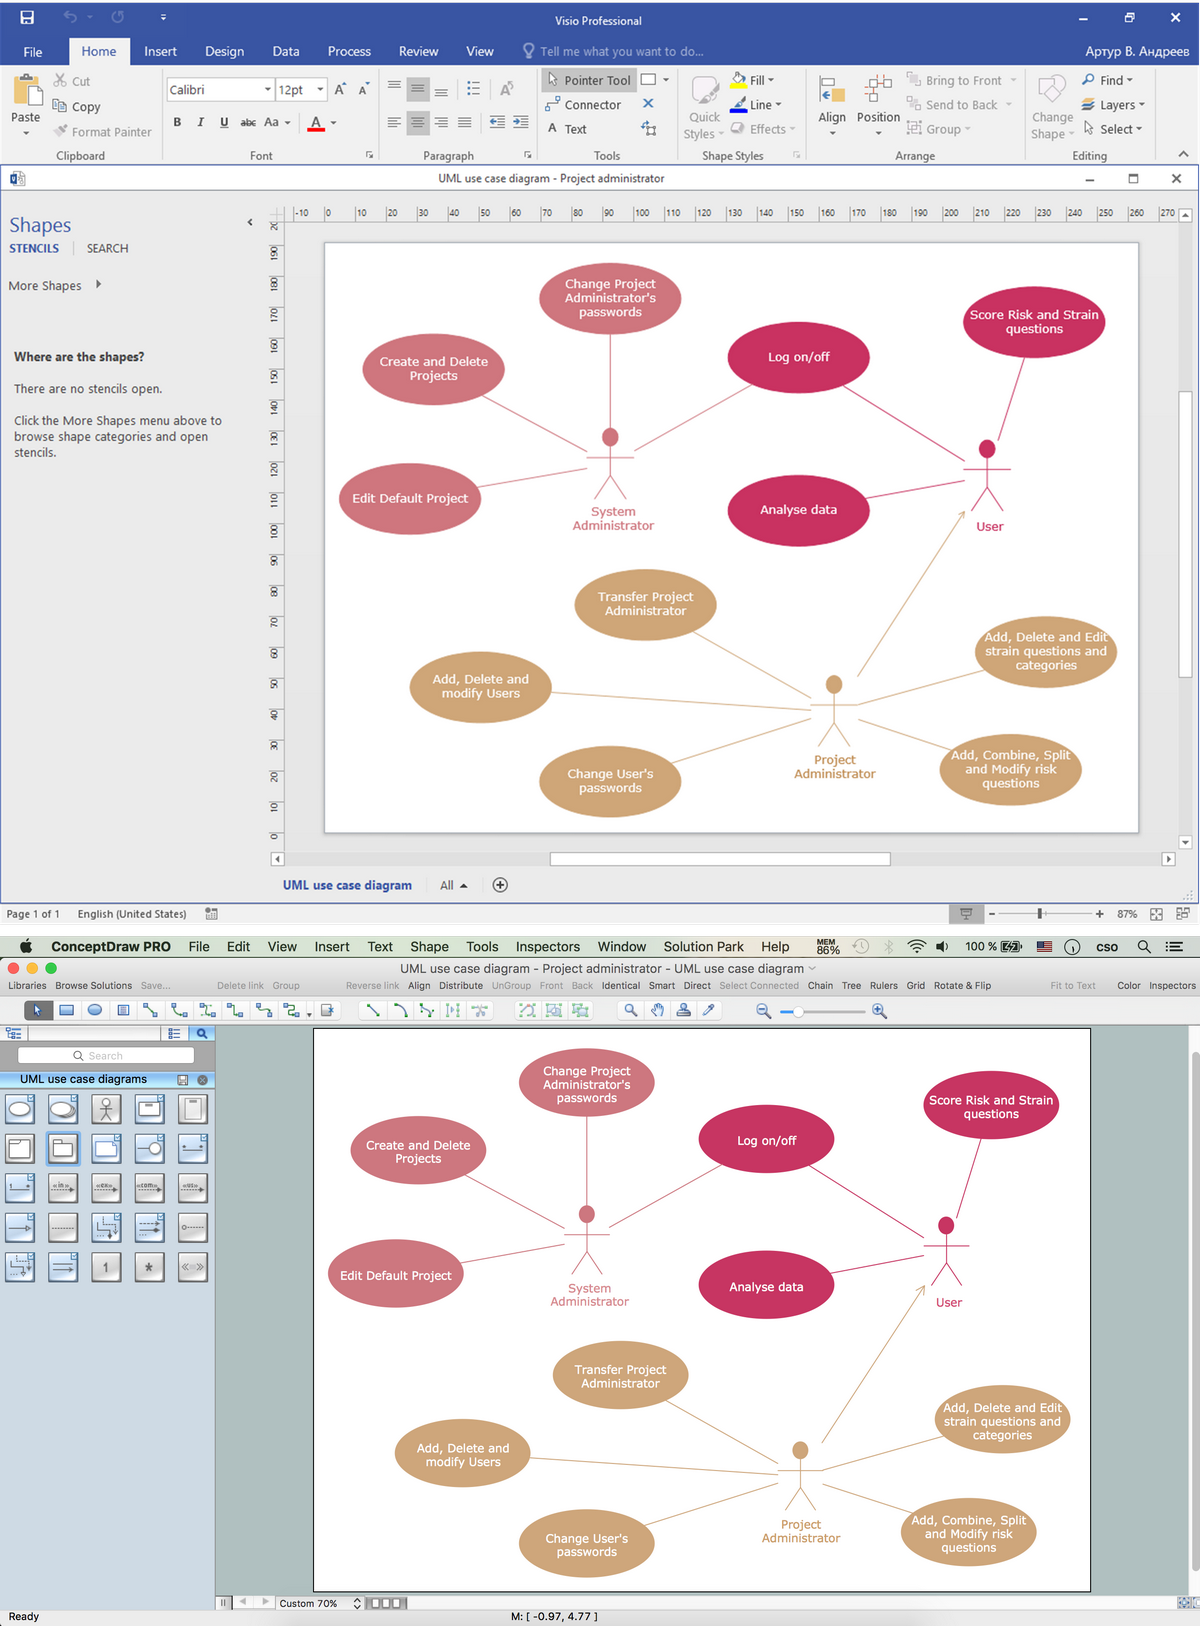
Picture: Visio Files and ConceptDraw


