Organizational Chart Templates
It is important for any organization or business to have a clear structure, that recognizes and defines employees' roles and responsibilities, and ultimately provides the framework for accomplishing the goals and aims of the company. There are a number of factors which decide how formal the structure needs to be, how complex, and which template it should follow — factors such as size and location of the company, how much management is needed, and the size and divisions of the workforce.
A diagram, with the help of which you can show the structure of your own or somebody else’s organization, including the commercial company or governmental one, as well as the relationships of this organization’s parts and people’s jobs within it, is known as an “organizational chart” or simply “org chart” (sometimes people also call it “organogram”). The term “org chart” is also used similarly to this structure diagrams for the purpose of showing the different elements of a business field of knowledge, for example.
The “org chart” is a special diagram graphically illustrating the relations of the departments as well as the co-workers to each other within a company. It can be also used for showing the relation of one function of a company to another (or others). Such an “organizational chart” enables us to visualize a complete organizational structure in a way of a drawing in order to simplify the description of it.
For example, if you decide to make your own company's organizational chart, you will have to illustrate the relations between all or just some (usually so-called “key workers”) people within your organization. The describing relations may be between the managers and their sub-workers, between the directors and managing directors, chief executive officers with various departments and so people working in them. In case your organization is too large, then the “organizational chart” can be split into smaller charts, describing separate departments within this organization. The different types of organization charts can include the “matrix” structure, the “flat” one (also known as the one called “horizontal”), and the one called “hierarchical”.
In order to create such an “organizational chart” you can simply put the principal officials, departments, or functions first on the top of this diagram and then draw all of the rest departments and workers depending on their rank. The officials’ titles, including their names, are usually represented in a way of the boxes, but there can be used circles instead. The lines are generally drawn from one box or circle to another showing the relation of one official or department to the others.
Daniel McCallum was the first one who created the first organizational charts of American business in 1854 and since then such chart became popular in use for the different organizations, especially the large ones.
The term "organization chart" came into use at the beginning of the 20th century. They became an excellent example of the division of a total quantity of people and departments into its components. In the 1920s there was a survey revealing that organizational charts were still not common among ordinary business concerns, but they were about to find their way into business and administrative enterprises.
There are a few limitations for creating an organizational chart, such as they only illustrate the “formal relationship”, but the pattern of human (social) relationships that are being developed. The organizational charts also often do not show the horizontal relationships, but mainly vertical. In order to have them relevant, you have to be updating the organizational charts manually every time they need to be updated, as they can very quickly become “out-of-date”. It is a very common problem for large organizations to have so many changes in their structures every day and so to have to edit the charts almost every time there are changes taking place, as such companies have their staff changing on a regular basis.
As it was mentioned before, the organizational charts only show the so-called "formal relationships" and provide only a little information about the managerial style adopted, such as “democratic”, “autocratic” or an “intermediate” style.
In case you want to show the non-linear and non-hierarchical relationships, having them in your organization, then you can draw an org chart so it is obvious for everyone looking at it what kind of relationships there are in your company, although such charts do not include the customers of the organization and you cannot mention any other structures, but your company’s. A "line relationship" org chart can look between the two colonels and the general structure - the colonels are directly responsible to the general. The one, representing the "lateral relationship" organization, would be between a "co-worker A" and "co-worker B", who both work on the same level and both report to the "Boss B".
You can use many different shapes for your organization chart, for example, rectangles, triangles, squares, and circles, indicating the different roles within one organization. Colour can be used for these shapes (borders and the shapes themselves) and for the connection lines in order to indicate the differences in responsibilities among the employers and employees. There are usually links, which can be informal, formal, and advisory ones between people working for the same organization. You can mention the departments and positions, which both have to be created or are currently vacant, but those vacant can be shown as a shape with a dotted outline or allotted in some other way. The importance of each of the positions may be also shown both with a unique feature, such as with a change of the shape’s size, additionally to its vertical placement on the org chart.
Having to create such a chart, it is always better to make any needed with professional software, and the best one for such purpose can be ConceptDraw DIAGRAM as this application was developed especially for a reason of simplifying users’ work with drawing different charts, including the organizational one. If you have ConceptDraw DIAGRAM already downloaded, you can get an “Organizational Charts Solution” as well from the “Management Area” of ConceptDraw Solution Park on this site and so to use it for making the professionally and smart-looking org charts.
Open ConceptDraw STORE to see the solution's capabilities and the professional results you can achieve quick and easy.

Example 1. Organizational Charts Solution in ConceptDraw STORE
The use of predesigned templates of different organizational chart types is the easiest and time-saving way to depict the organizational structure of your business.

Organizational Chart Template

Divisional Organizational Chart Template

Department Organizational Chart Template

Company Organizational Chart Template
Open the desired template from the ConceptDraw STORE and modify it for your own organizational chart designs.
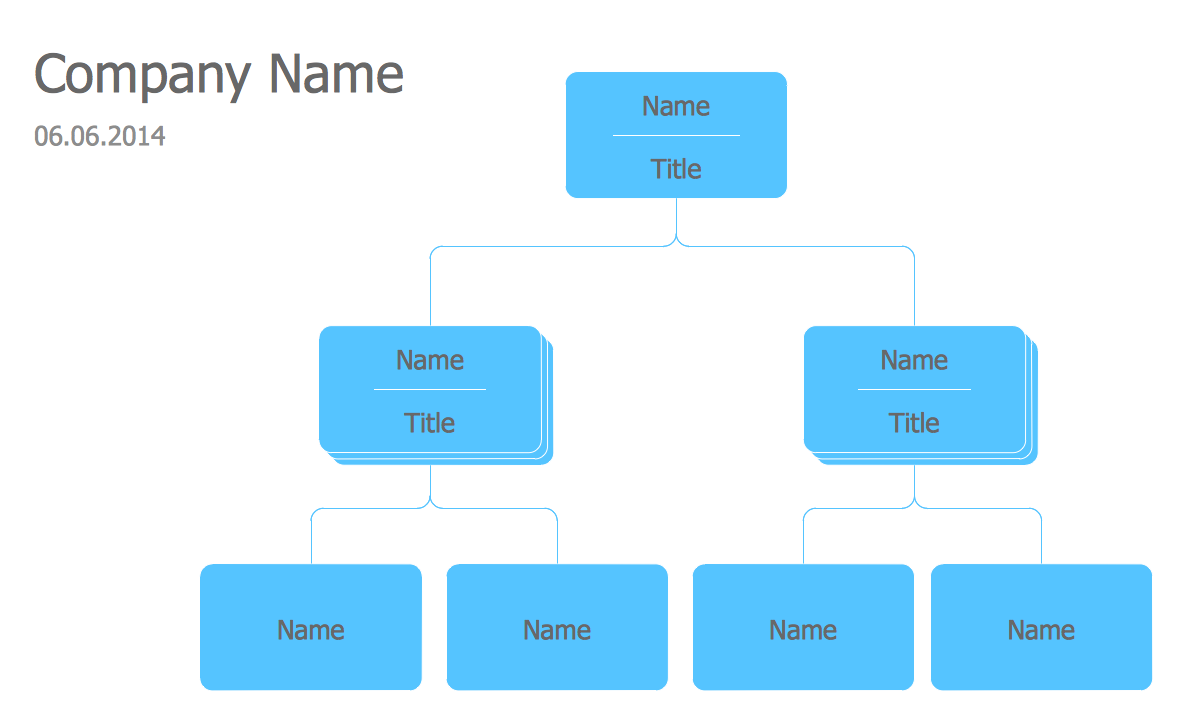
Example 2. Organizational Chart Template
This organizational chart template was created in ConceptDraw DIAGRAM diagramming software using the Organizational Charts Solution from ConceptDraw Solution Park. An experienced user spent 5 minutes creating this template.
Use the Organizational Charts Solution for ConceptDraw DIAGRAM to create your own Organizational Charts of any complexity quick, easy and effective.
The Organizational Charts designed with ConceptDraw DIAGRAM are vector graphic documents and are available for reviewing, modifying, converting to a variety of formats (image, HTML, PDF file, MS PowerPoint Presentation, Adobe Flash or MS Visio), printing and send via e-mail in one moment.
TEN RELATED HOW TO's:
An orgchart shows how the responsibilities are divided between departments. It’s enough to have just one look on a proper organizational chart template to understand the idea and how it works. To understand how it’s made you should use a diagramming software.
This organizational diagram illustrates the possibilities of using ConceptDraw DIAGRAM to create orgcharts. This sample represents the common project management company. The chart shows the structure of devisions in the company, and the interaction between them. Communication between departments imply a certain structure affiliation and reporting. At the head of the company - President. This diagram was created using ConceptDraw solution for designing Organizational charts of any structure and complexity.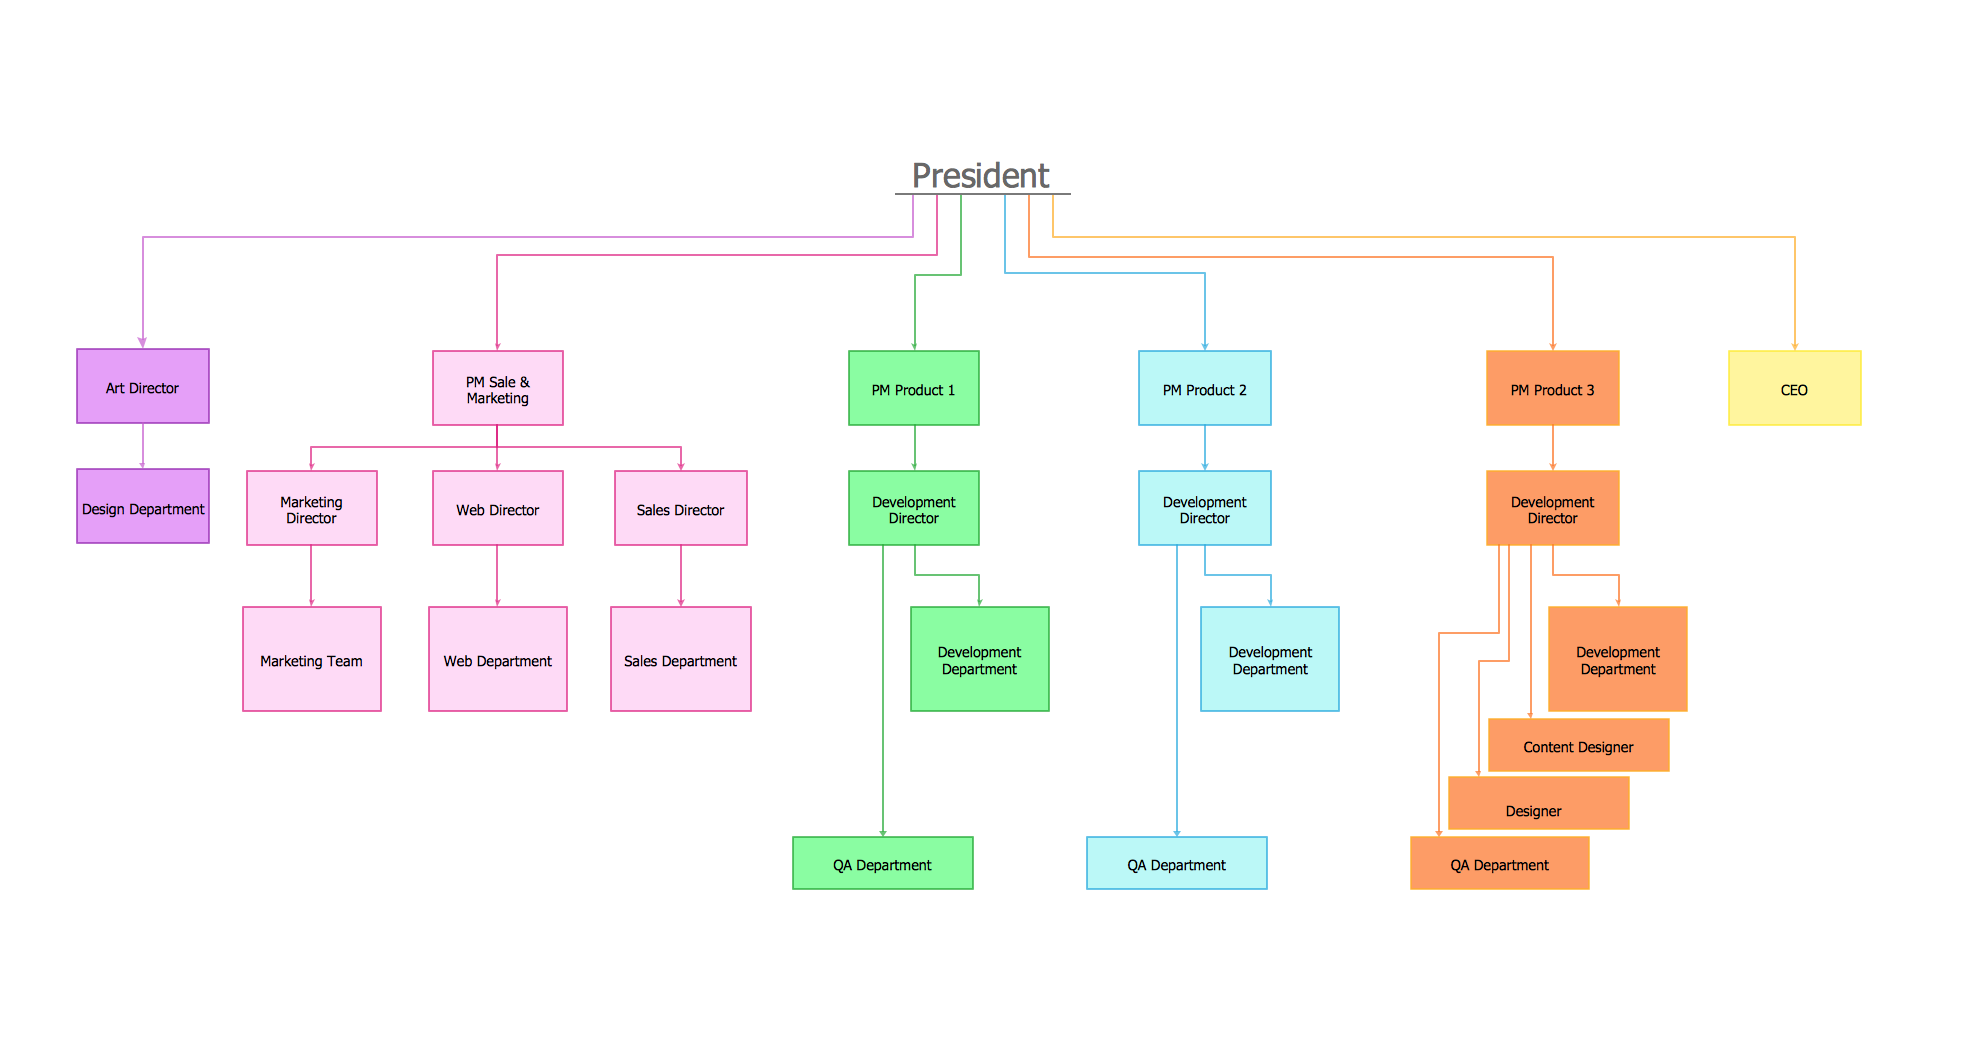
Picture: Organizational Chart Template
Related Solution:
If you have a premise, or a studio and you want to start your own business, catering might be perfect for you. You can see a cafe floor plan as an example of possible usages of the free space on the floor. Obviously, you can rearrange it in any plausible way.
This cafe floor plan was created with a help of ConceptDraw solution for Cafe and Restaurant Floor Plans. Working under the design of interiors plans for cafe, commonly cause various creative and architectural issues. Primarily, cafe floor plan and interior design must be nice and at the same time comfortable for customers. Developing a floor plan and interior conception for cafe involve various elements that can be found out in the ConceptDraw Cafe and Restaurant Floor Plan solution. This sample drawing may be used as a template while proceeding to design a particular cafe. This sample plan can help to select furniture most suitable for cafe's guest rooms or cuisine. Also, this drawing may be handy as a requirements list of a furnishing and accessories necessary for the new cafe.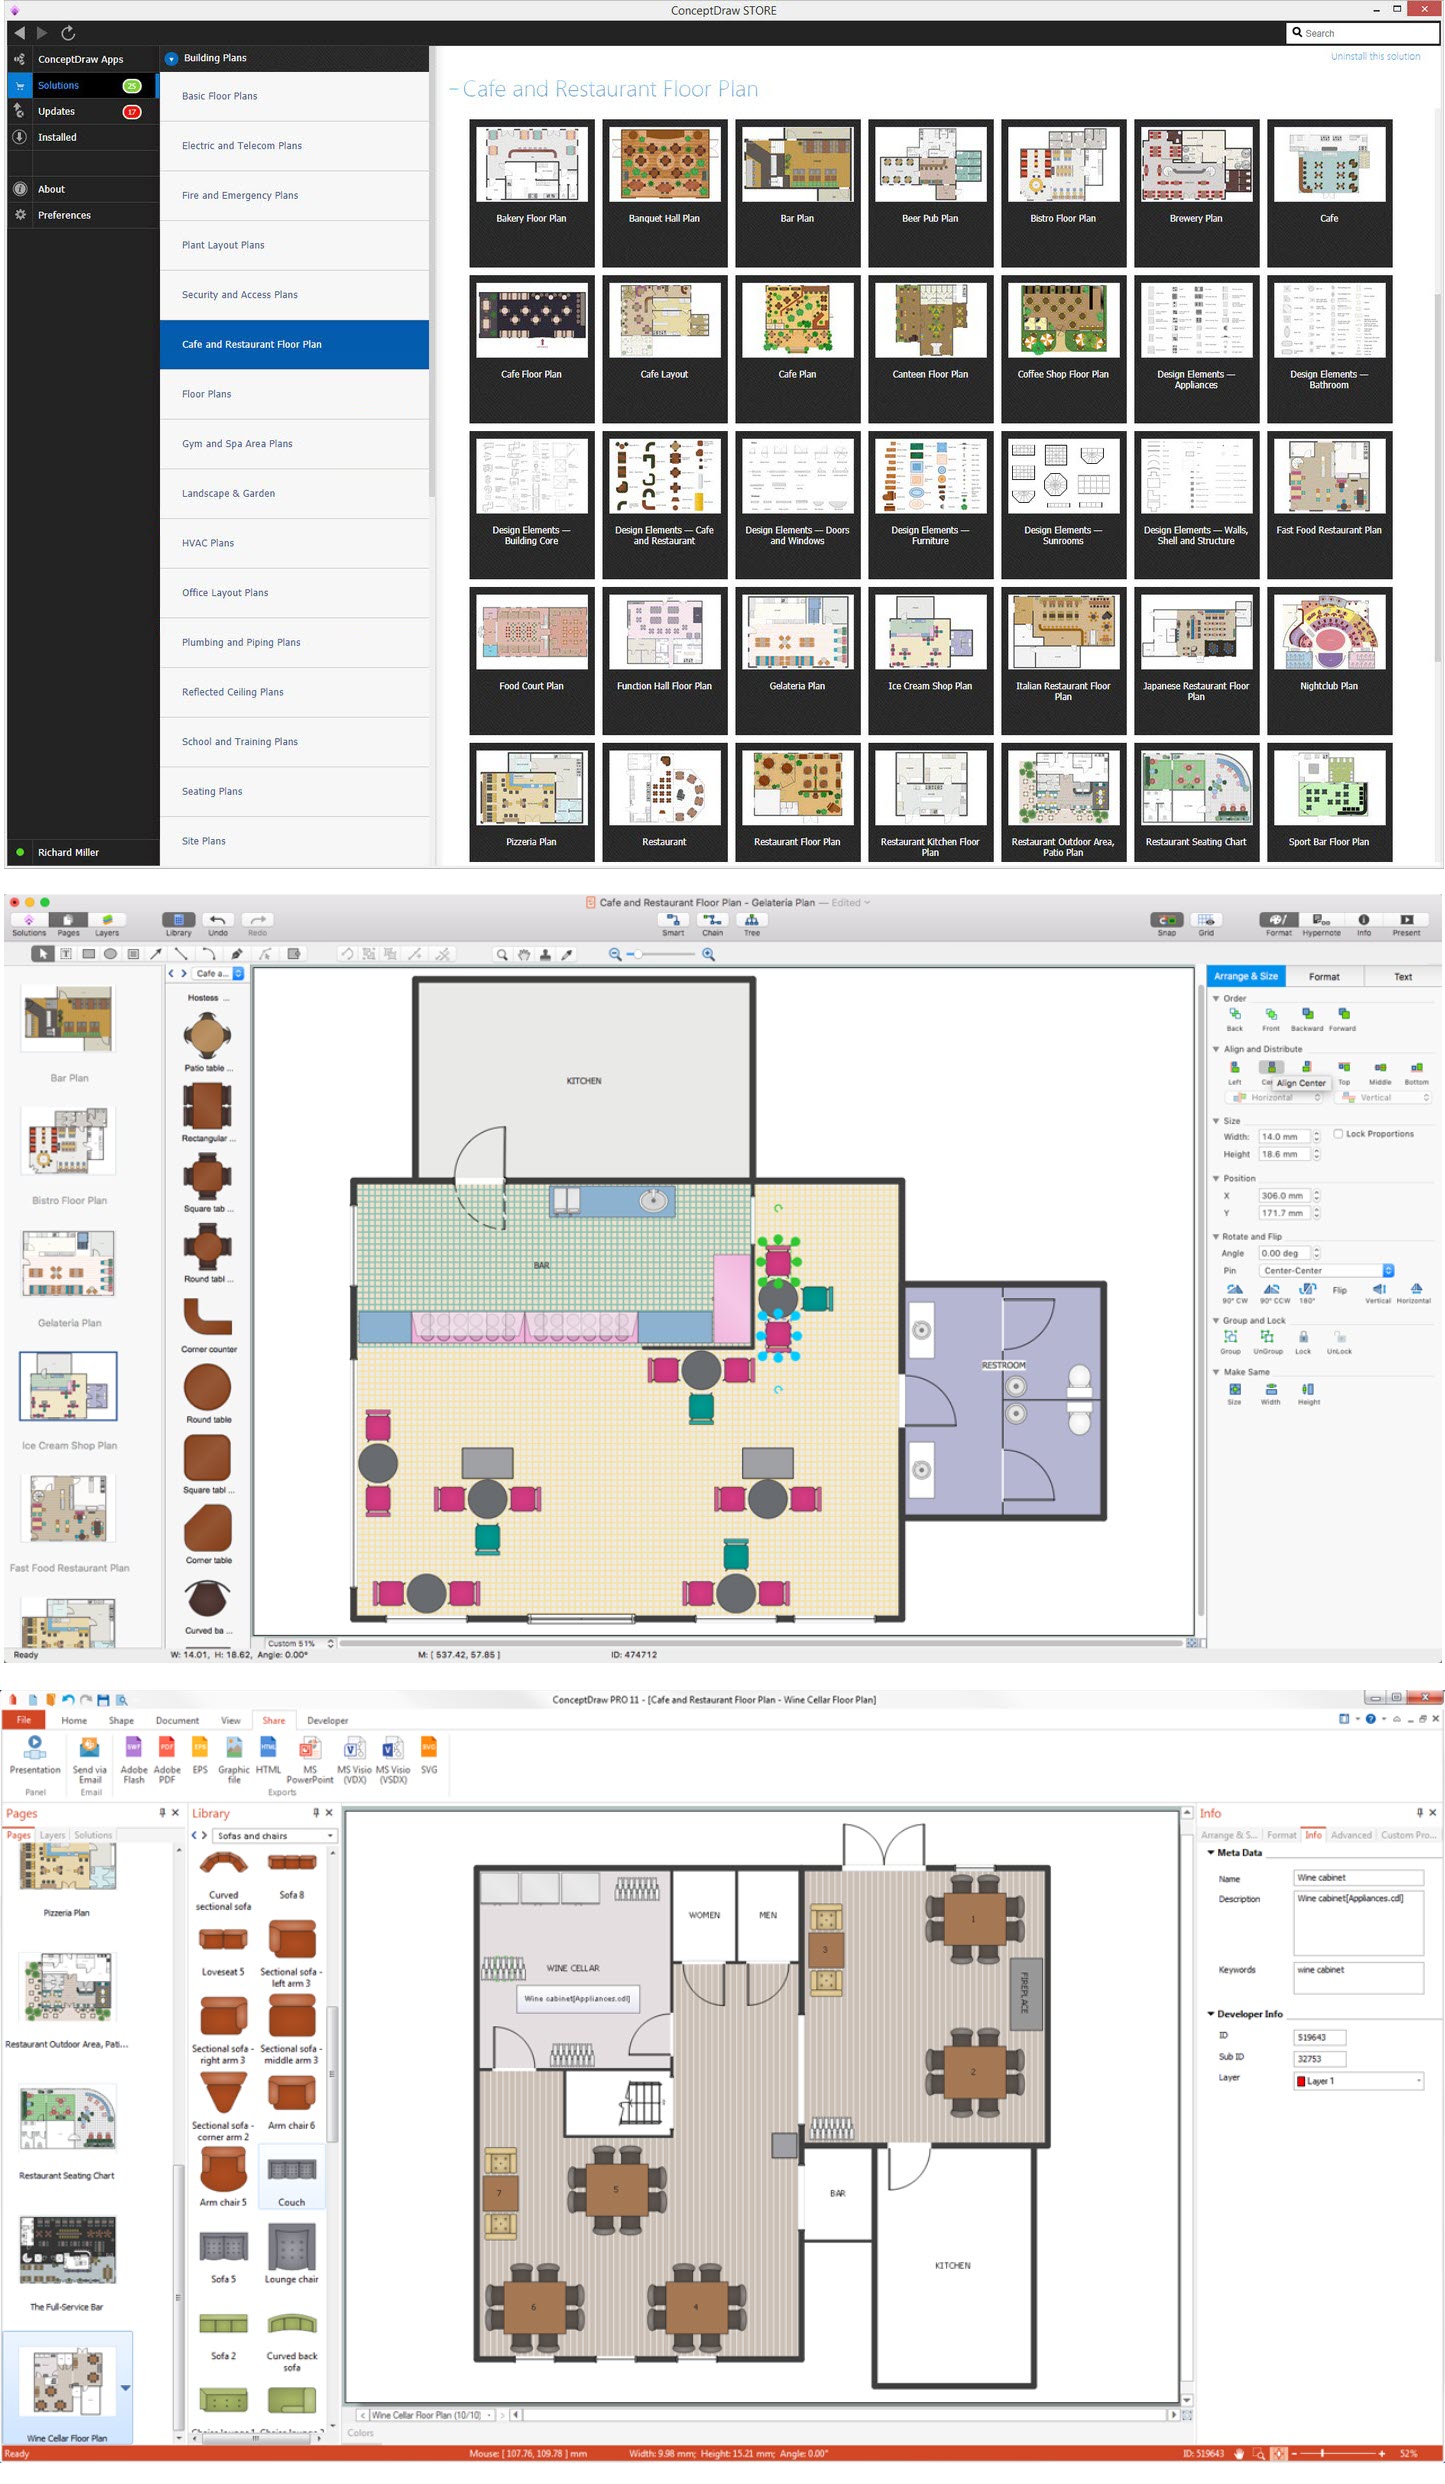
Picture: Café Floor Plan Example
Related Solution:
If you want to find a way to understand complex things in minutes, you should try to visualize data. One of the most useful tool for this is creating a flowchart, which is a diagram representing stages of some process in sequential order. There are so many possible uses of flowcharts and you can find tons of flow charts examples and predesigned templates on the Internet. Warehouse flowchart is often used for describing workflow and business process mapping. Using your imagination, you can simplify your job or daily routine with flowcharts.
Warehouse flowcharts are used to document product and information flow between sources of supply and consumers. The flowchart provides the staged guidance on how to manage each aspect of warehousing and describes such aspects as receiving of supplies; control of quality; shipment and storage and corresponding document flow. Warehouse flowchart, being actual is a good source of information. It indicates the stepwise way to complete the warehouse and inventory management process flow. Also it can be very useful for an inventory and audit procedures.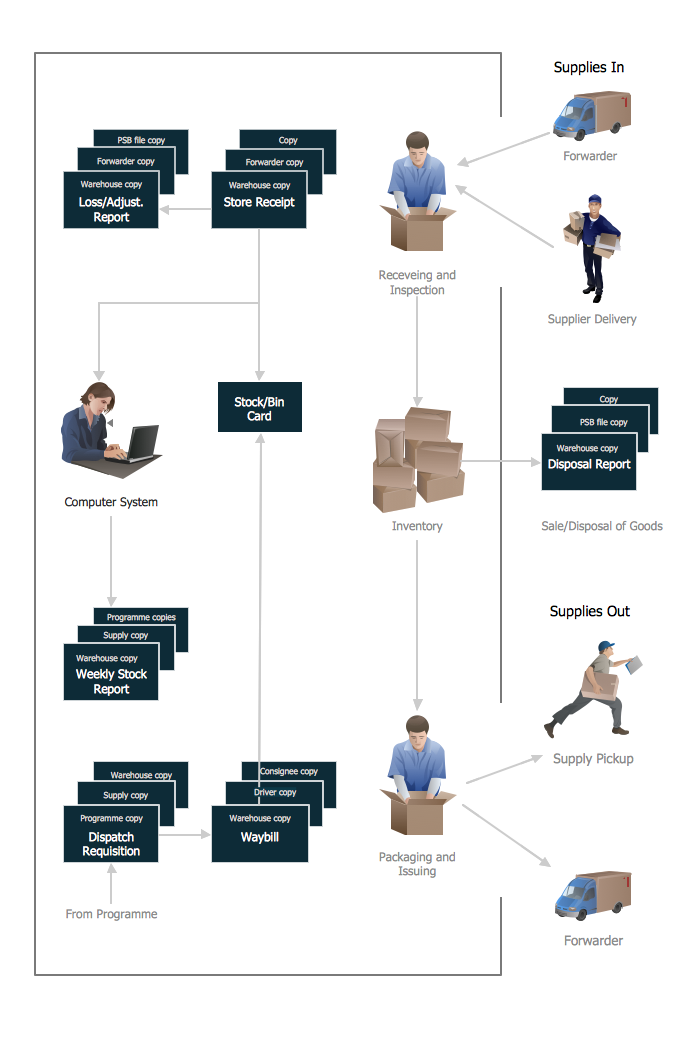
Picture:
Flow chart Example
Warehouse Flowchart
Related Solution:
There are plenty of diagramming tools, the question is to choose the most suitable for your needs. For example, you can choose ConceptDraw DIAGRAM as organizational chart software and get fascinating results in a few minutes. An orgchart is useful for any corporation.
This is an example of a hierarchical organization scheme of the company. It has tree-like structure. Each middle manager is subordinated to a few employees, and he is accountable to one of the top managers. Every type of organizational composition of businesses may be presented in the view of an organizational chart that is supported by ConceptDraw Organisational Charts solution. There are number of ways of building a structure of business organization, establishing how it should function.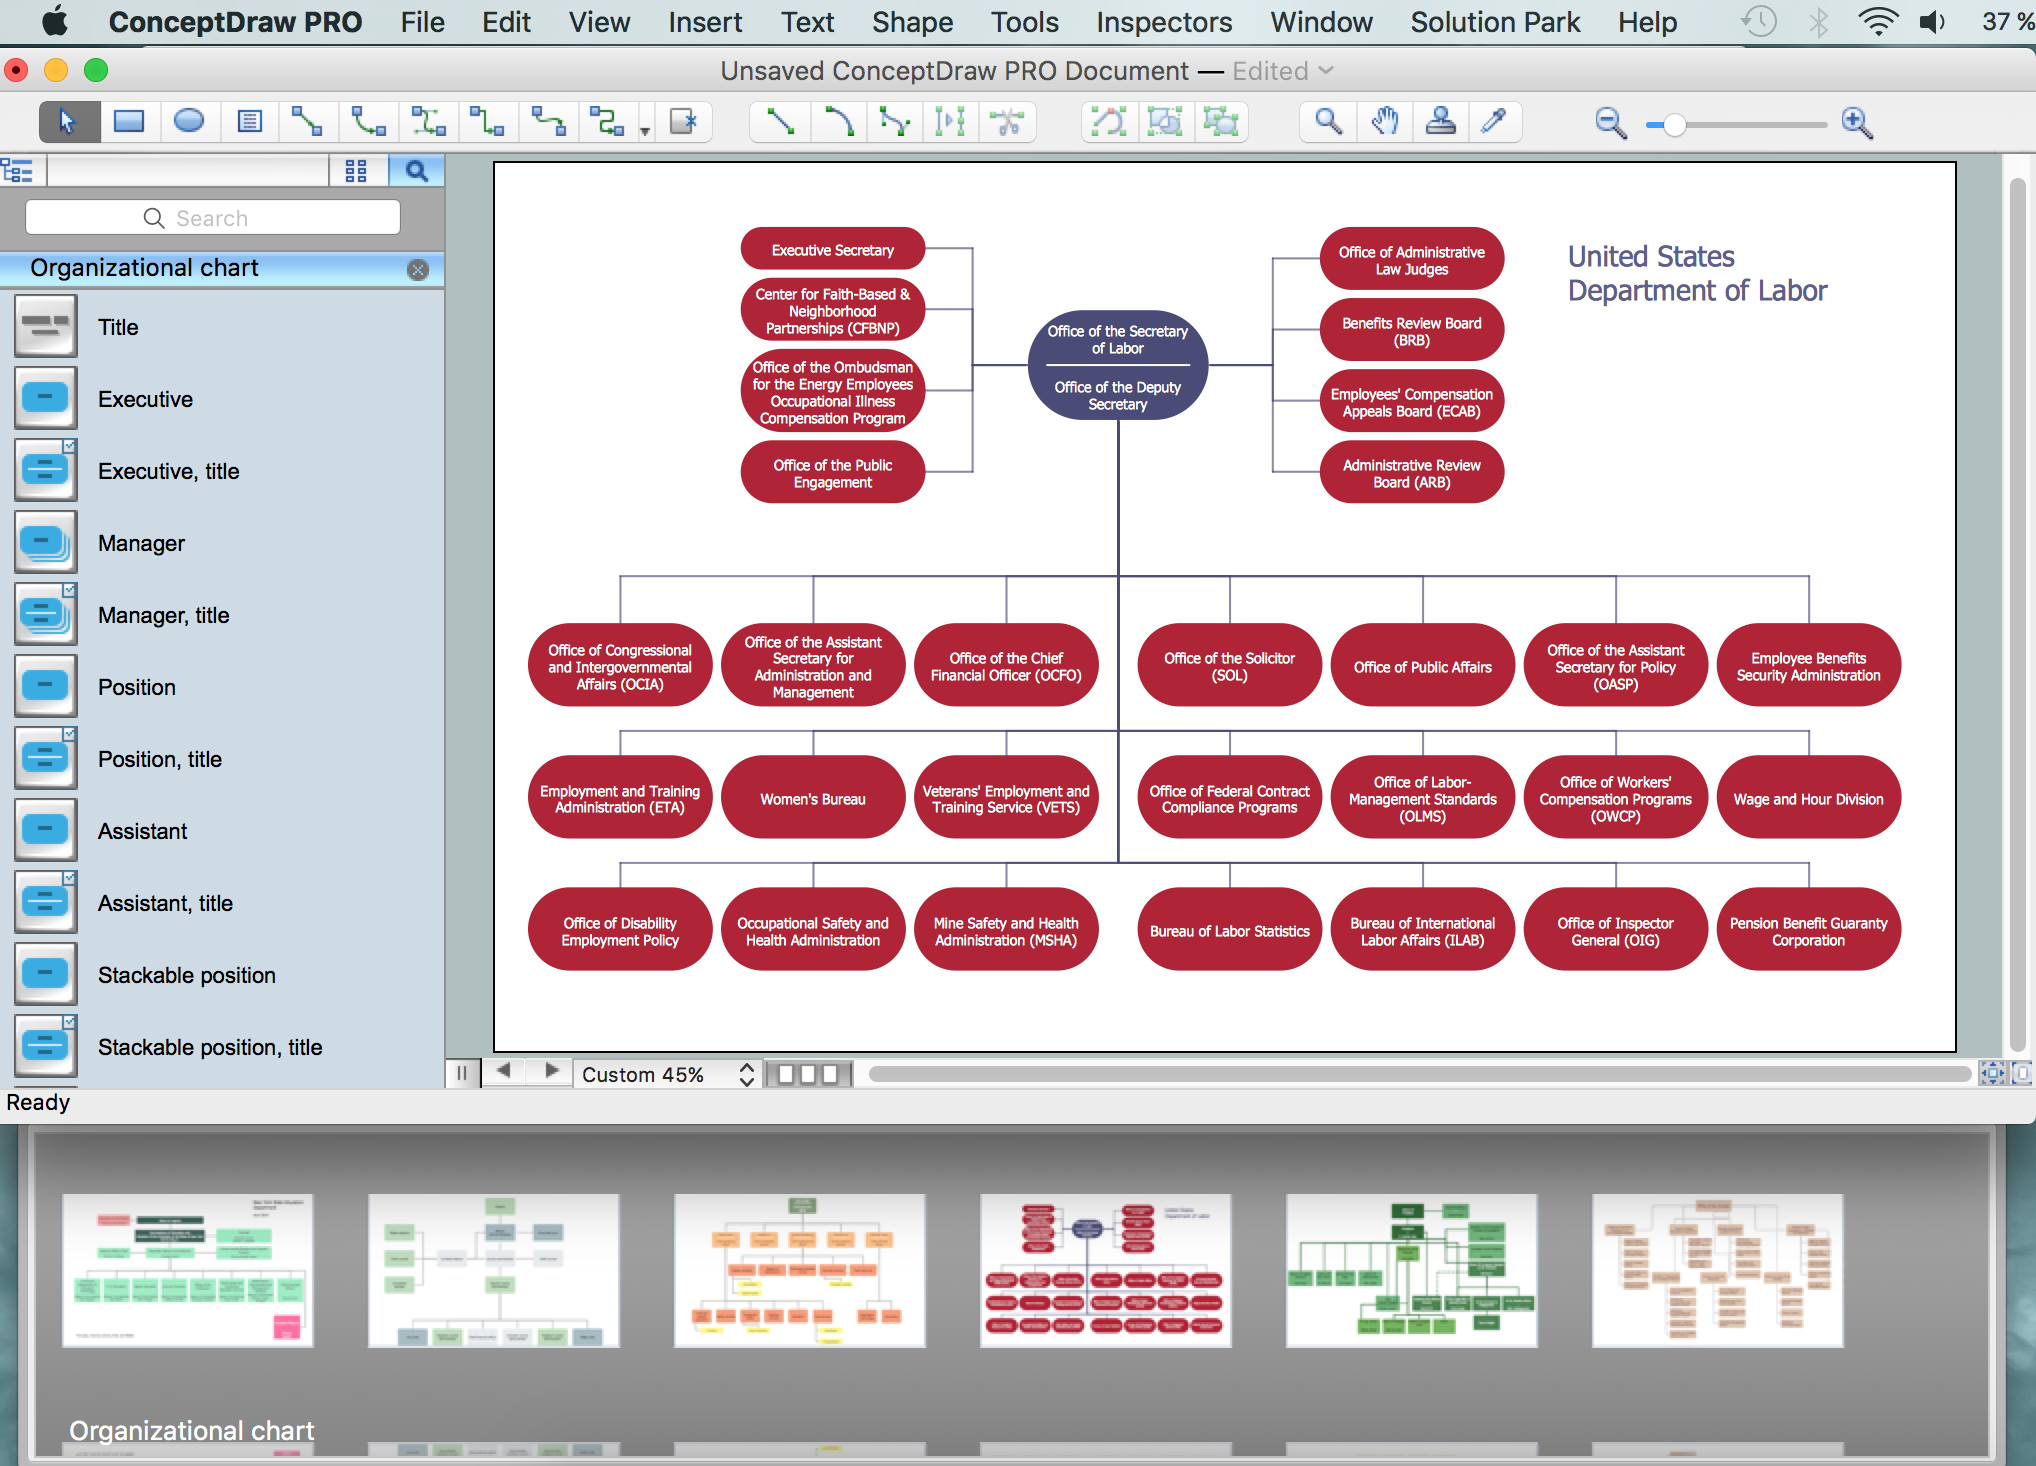
Picture: ConceptDraw DIAGRAM - Organizational chart software
Related Solution:
When trying to figure out the nature of the problems occurring within a project, there are many ways to develop such understanding. One of the most common ways to document processes for further improvement is to draw a process flowchart, which depicts the activities of the process arranged in sequential order — this is business process management. ConceptDraw DIAGRAM is business process mapping software with impressive range of productivity features for business process management and classic project management. This business process management software is helpful for many purposes from different payment processes, or manufacturing processes to chemical processes. Business process mapping flowcharts helps clarify the actual workflow of different people engaged in the same process. This samples were made with ConceptDraw DIAGRAM — business process mapping software for flowcharting and used as classic visio alternative because its briefly named "visio for mac" and for windows, this sort of software named the business process management tools.
This flowchart diagram shows a process flow of project management. The diagram that is presented here depicts the project life cycle that is basic for the most of project management methods. Breaking a project into phases allows to track it in the proper manner. Through separation on phases, the total workflow of a project is divided into some foreseeable components, thus making it easier to follow the project status. A project life cycle commonly includes: initiation, definition, design, development and implementation phases. Distinguished method to show parallel and interdependent processes, as well as project life cycle relationships. A flowchart diagram is often used as visual guide to project. For instance, it used by marketing project management software for visualizing stages of marketing activities or as project management workflow tools. Created with ConceptDraw DIAGRAM — business process mapping software which is flowcharting visio alternative or shortly its visio for mac, this sort of software platform often named the business process management tools.
Picture: Process Flowchart
Related Solution:
There are numerous articles about the advantages of flowcharting, creating business graphics and developing different charts. Nevertheless, these articles are almost useless without the main component - the examples of flowcharts, org charts and without a fine example, it is difficult to get all the conveniences of creating diagrams. You can find tons of templates and vivid examples on Solution Park.
This illustration shows a variety of business diagrams that can be created using ConceptDraw DIAGRAM. It comprises a different fields of business activities: management, marketing, networking, software and database development along with design of infographics and business illustrations. ConceptDraw DIAGRAM provides a huge set of sample drawings including business process modeling diagrams,, network diagrams, UML diagrams, orgcharts, DFD, flowcharts, ERD, geographical maps and more.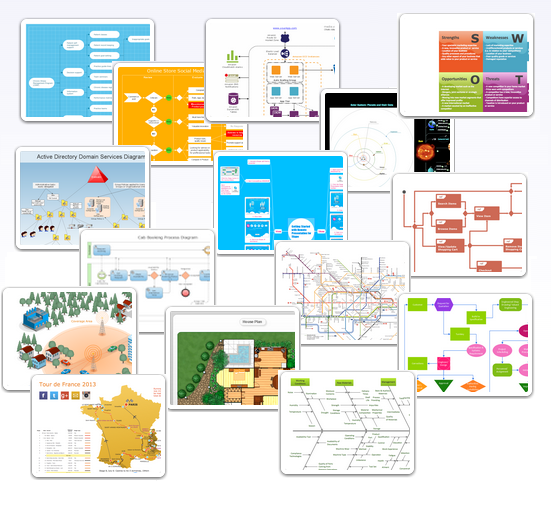
Picture: Examples of Flowcharts, Org Charts and More
Related Solution:
If your company is in chaos in clutter and no one understands their rights and responsibilities, maybe it's time to change that. One of the ways to put the company in order is to draw an organization chart that would reflect the structure and show the relationships among departments and positions. This is a very useful and easy to understand scheme.
This is example of the one of the most typical kind of organizational chart. It depicts an organizational structure of the hierarchical type. Its construction is similarv to pyramid. The single main position on the top - in this case, the mayor's position followed by sub-levels of authority in his command. Each position in the pyramid reports only to his supervisor, and takes only a report of direct subordinates. Such scheme limits the number of communications. This organizational structure is effectively used in public organizations. Also it is suitable for any organization with the need for multiple levels of middle managers. The ability to create organizational charts of different types is supplied with ConceptDraw Ogrcharts solutions.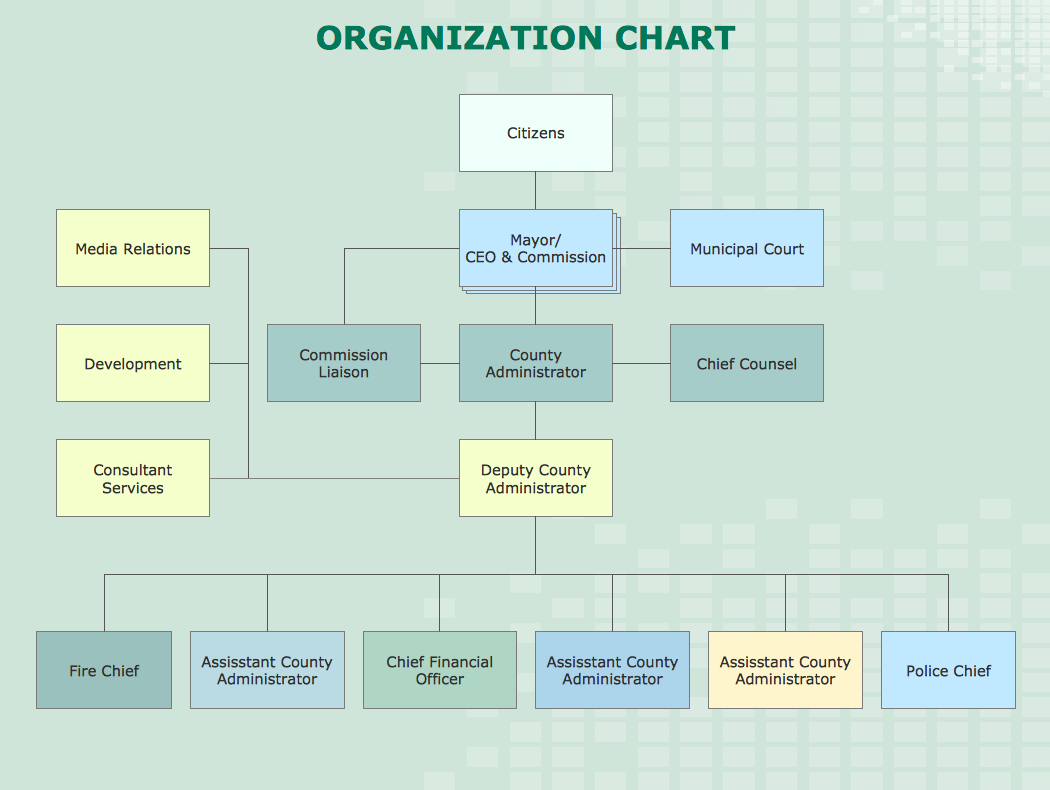
Picture: How to Draw an Organizational Chart
Related Solution:
Organization Chart Templates - Organizational Charts Solution from the Management Area of ConceptDraw Solution Park provides a wide collection of predesigned templates and samples that will help you create the Organizational Charts of any complexity in one moment.
Picture: Organization Chart Templates
Related Solution:
My friend works as a marketologist. Once he asked me about Marketing and Sales Organization chart, as it was new for him. Luckily, ConceptDraw Solution Park has tons of examples to show to an unexperienced user.
This organizational chart was designed with ConceptDraw DIAGRAM and its Organizational Charts solution, that can be find in the Management section of Solution Park. This solution offers a vector objects library and a set of samples and templates. The vector library contains symbols and icons that provide you with possibility to show the organizational structure of your organization at a glance. It allows to depict the interrelations of authority and responsibility between positions in an organization. Organizational charts provide both employers and employees a clear view of the sale and marketing departments structure, reporting system, management levels.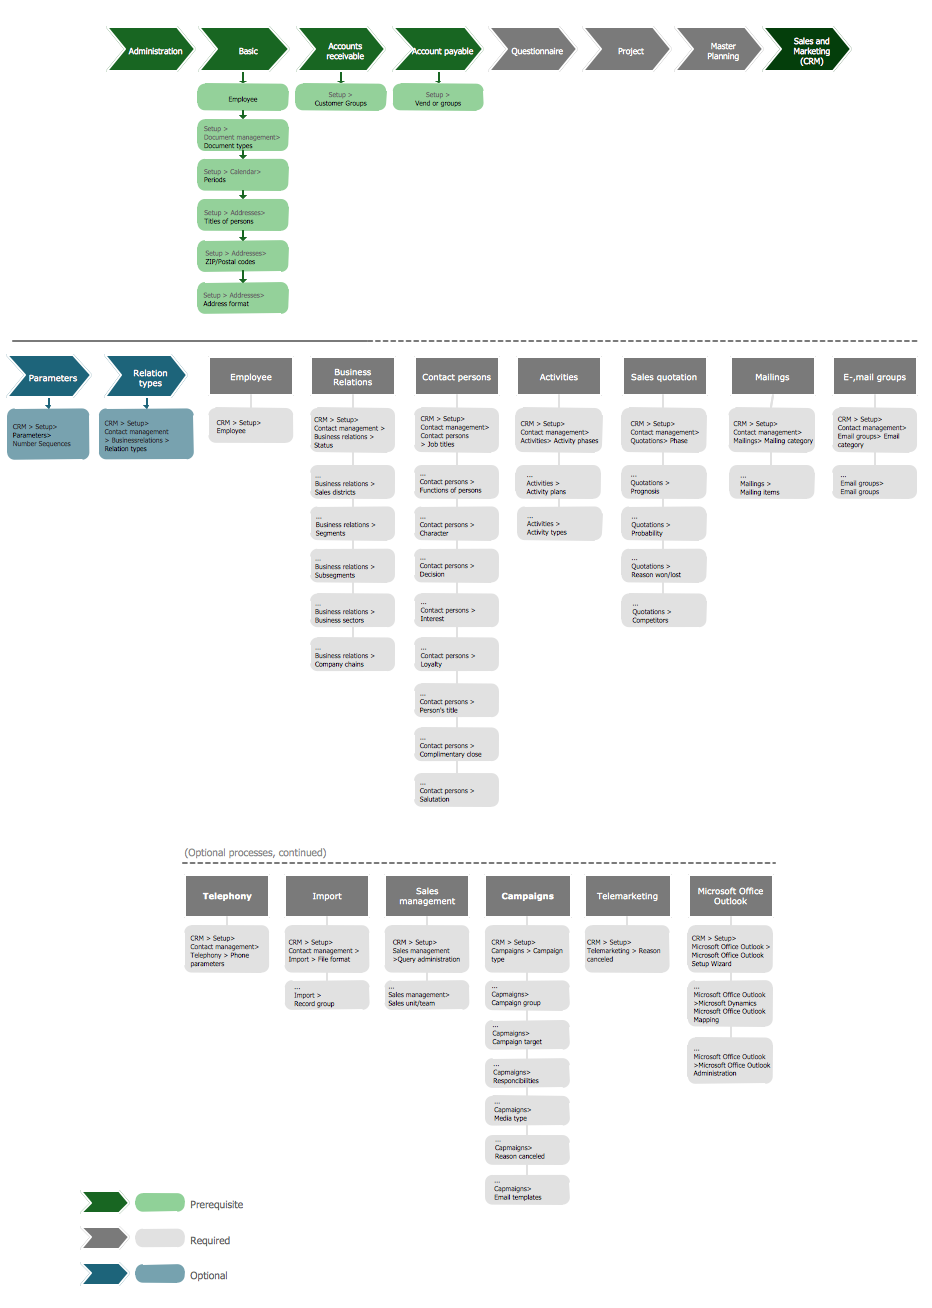
Picture: Marketing and Sales Organization chart.Organization chart Example
Related Solution:
This sample was created in ConceptDraw DIAGRAM diagramming and vector drawing software using the Line Graphs Solution from Graphs and Charts area of ConceptDraw Solution Park.
This sample shows the Line Chart of annual percentage change. The Line Chart allows you to clearly see the changes of data over the time.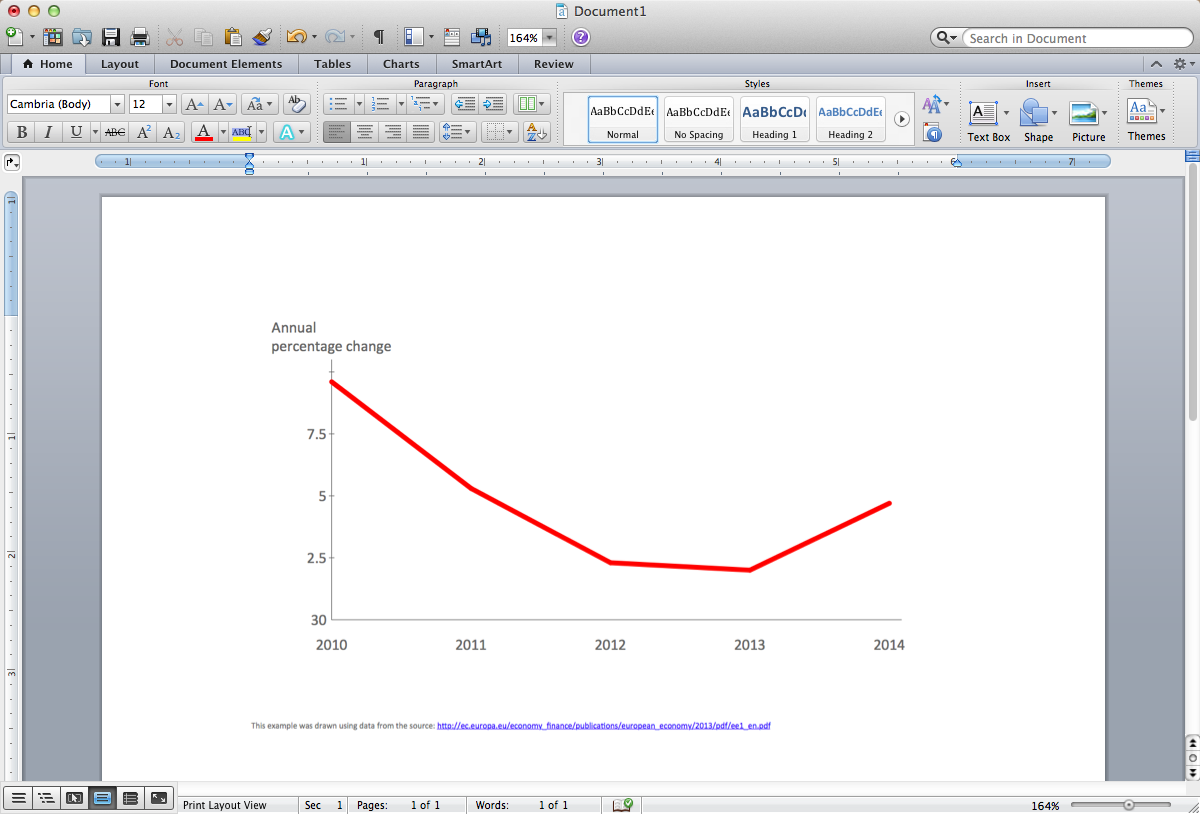
Picture: Line Chart Template for Word
Related Solution:


