Performance Indicators
One of the types of the “performance measurements”, known to be a process of both analysing and collecting, as well reporting the information regarding the performance of a group of people, some organization or an individual, or a component of a system, same as the system itself is called a “performance indicator”. A “performance indicator” can be called “KPI”, meaning the “key performance indicator”, involving analysing the studying processes as well as the strategies of the organization. It can be used in the engineering field of study, including the engineering parameters, processes and phenomena in order to see whether the output is in line with what there was intended to be achieved.
The key performance indicators evaluate the success of an organization, as well as of a particular activity, including the products, projects, programs as well as other activities, which are involved in the process. The success as a result of such analysing is meant to be the repeated achievement of some levels of the operational goal. Sometimes the success can be defined as a progress toward achieving the strategic goals. To be able to choose the right KPI depends on your own understanding of what is important to the organization, which depends on the department measuring the performance. Thus, many different techniques may be used in order to assess the present state of the business, and so its key activities. Such key activities are expected to be associated with the selection of the chosen performance indicators.
The assessment of the present state of business often leads to the identification of the potential improvements. In this case the performance indicators can be associated with the so-called “performance improvement” initiatives. The “key performance indicators” define a set of values against those which have to be measured. Thus, the raw sets of values, which are meant to be used for summarizing the information, are known to be “indicators”. They can be divided into various sub-categories, such as “qualitative indicators”. It is important to remember, that these “qualitative indicators” can't be presented as a number, but the other, the “quantitative” ones that can be.
The so-called “leading indicators” can predict the outcome of a process and “lagging” ones do present the success/failure post hoc. There are also “process” ones, representing the efficiency as well as the productivity of any process needed to be analysed and the “input indicators”, measuring the number of resources consumed during the generation of the outcome. The “output indicators” are meant to reflect the outcome as well as the results of any process activities and the “practical” ones interface with the already existing company processes.
There are a few more types of indicators, which are the “directional” ones, specifying whether an organization is getting better or not, “actionable” ones, which are sufficiently in an organization's control to effect any changes and “financial” ones, used in the previously mentioned “performance measurement”.
“Key performance indicators” are basically the objectives, which are meant to be targeted, adding the most value to the business. They can be also known as “key success indicators”. The key stages while the process of identifying the performance indicators include getting the pre-defined business process, the requirements for the business processes as well as getting the quantitative and qualitative measurements of the results, followed by making up the goals. Investigating variances as well as the tweaking processes are also a part of the process of the performance indicators identification and they are meant to take a part in order to achieve all of the short-term goals.
In order to assess the performances of any organization, any business unit as well as their divisions, departments, employees and so on, the key performance indicators (or “KPIs”) are widely used. They are nowadays the most commonly defined, being meaningful, understandable as well as very easily measurable. They can be also defined, although quite rarely, in a way of their fulfillment being hampered for a reason of the factors being seen as “non-controllable” by the organizations as well as individuals, who are simply responsible for the final result. Although, such “KPIs” are known as being ignored by organizations as well as individuals.
There are so-called “SMART criteria”, that any KPI should follow. SMART is a mnemonic acronym, giving criteria to guide in the setting of the goals and objectives in such spheres of business, such as project management, the personal development, etc. The two out of five letters, which are M and S mean “measurable” and “specific”, and the rest can be “time-bound”, “achievable” and “relevant”. Thus, “SMART criteria” phrase means the measure having a Specific purpose for the business; it is Measurable to really get a value of the KPI. The defined norms within these criteria all should be Achievable and the improvement of a KPI has to be Relevant to the successful result of the organization goals achievement. And, finally, it must be Time phased process.
All KPIs are linked to the target values, so they can be easily evaluated. In these circumstances, the value of the measure can be assessed as the one which meets the expectations or not. KPIs are known to be able to lead to so-called “unintended consequences” as well as “perverse incentives”. It happens as a result of the employees working within one organization, being adhered to the specific measurements at the expense of the quality as well as the value of their work.
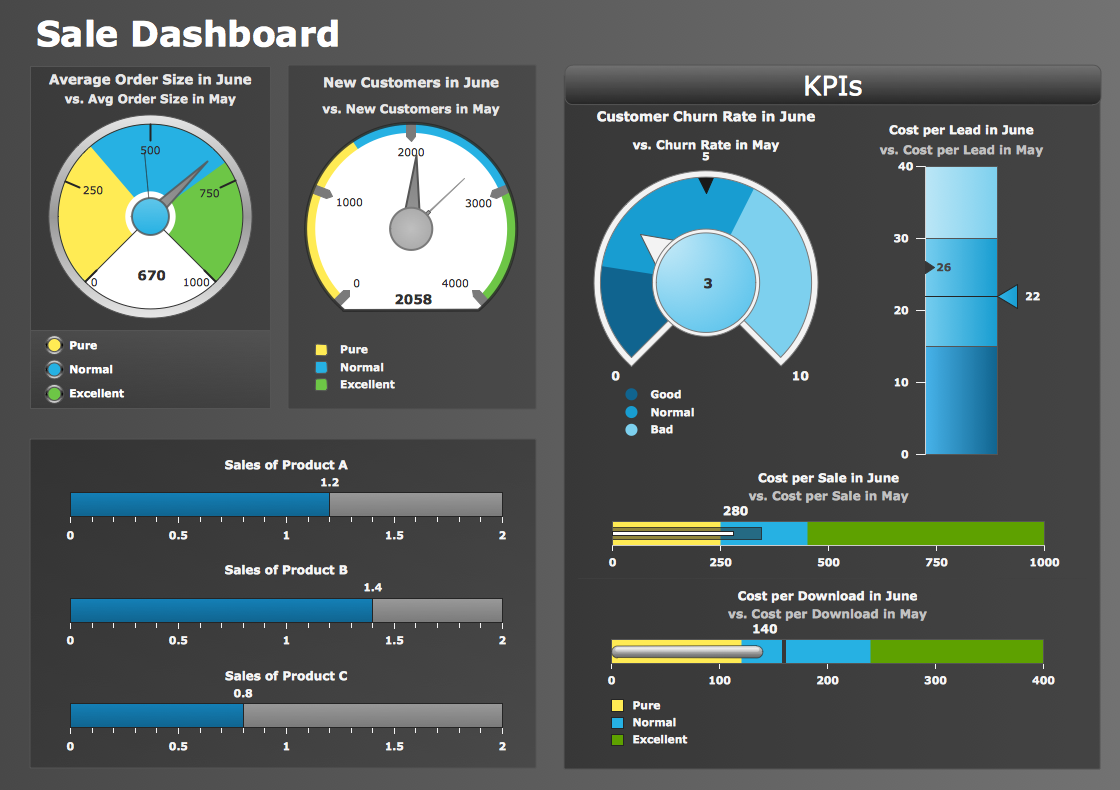
ConceptDraw DIAGRAM diagramming and vector drawing software offers the useful tools of the Sales Dashboard solution from the Marketing area for easy creating professional looking live dashboards which allow to track the business sales activity and progress thanks to representing the Key Performance Indicators (KPIs) on them.

Example 1. Performance Indicators on Sales Performance Dashboard
In order to illustrate all of the needed performance indicators within your organization or somebody else’s company, you might find it difficult to find the right tool for helping you arrange such things, although having ConceptDraw DIAGRAM software you know that ConceptDraw STORE consists of all the needed solutions, including the “Sales Dashboard” one, offering two stencil libraries with plenty of pre-designed objects of the performance indicators. All of the stencils are simple to use and in only “Sales Dashboard library” there are not more, not less, than 25 indicators. In another “Sales KPIs and Metrics library” there are 14 indicators, which can be used any time you need them, as well as all of the pre-made examples of the sales dashboards from the same solution.
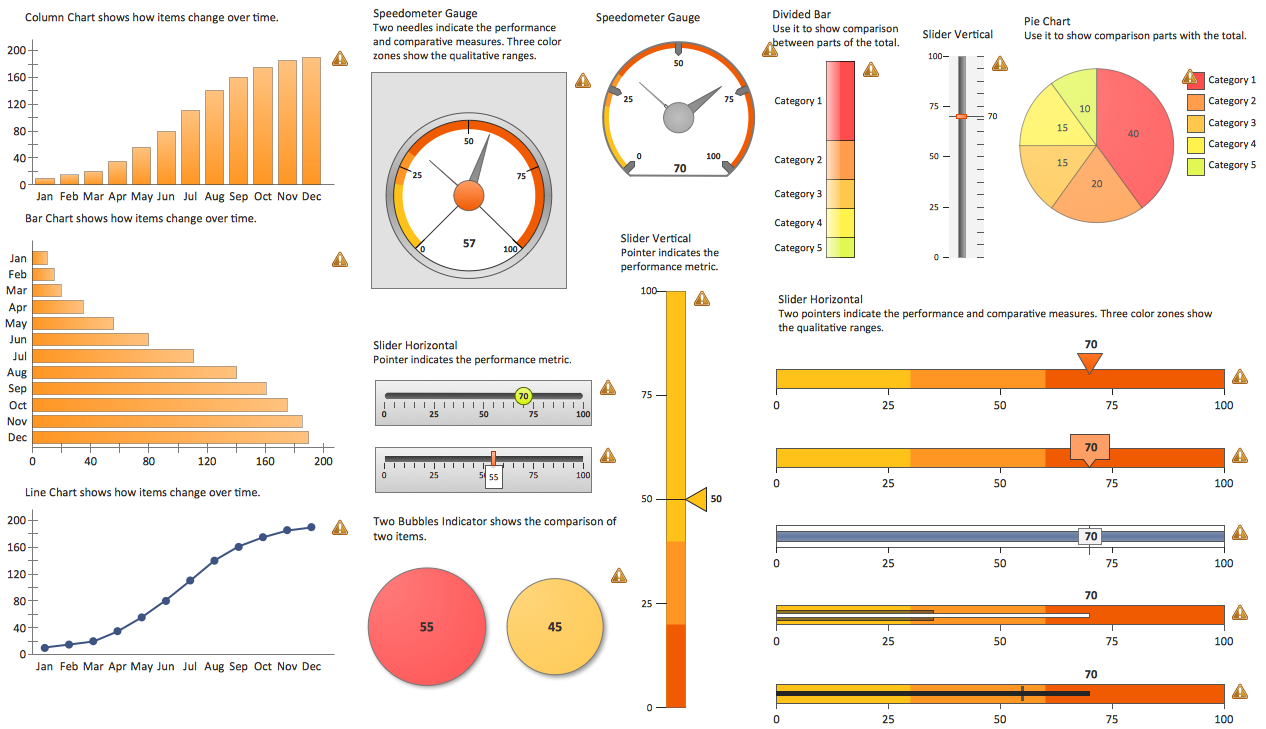
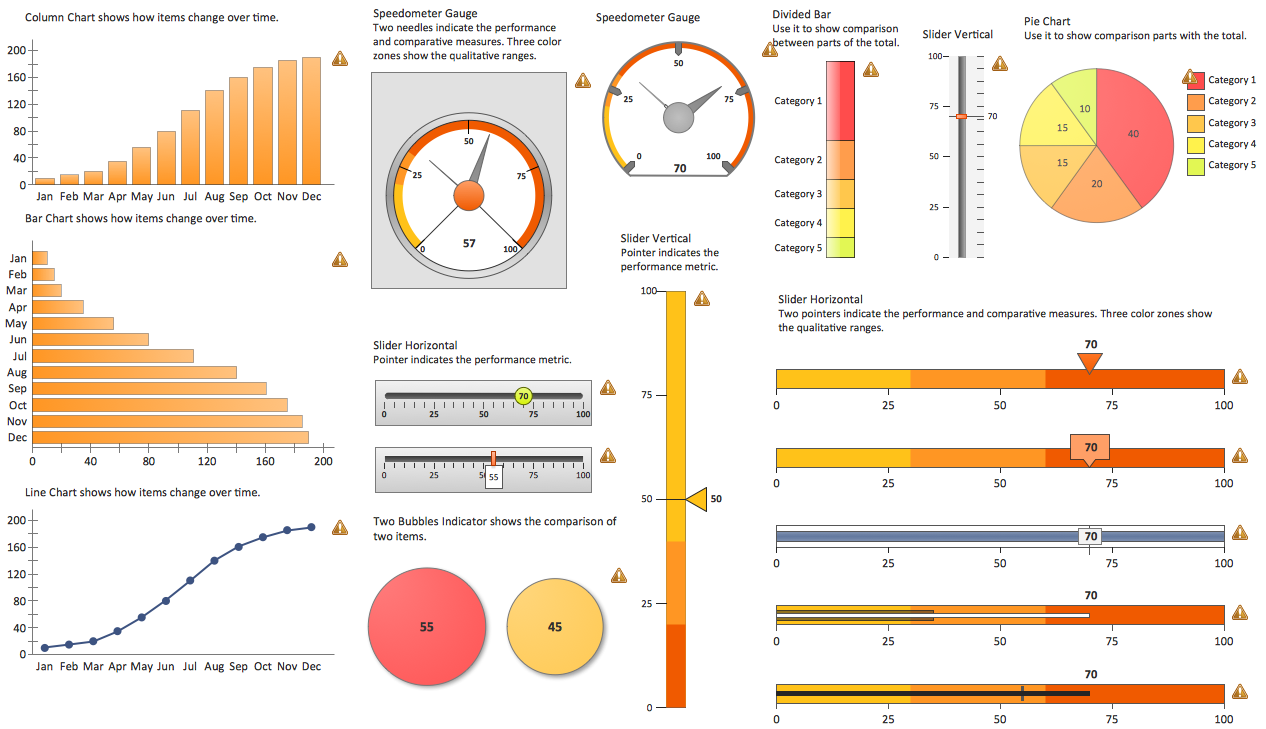
Example 2. Sales Dashboard Library Design Elements
All these objects are live and vector objects, so you can connect the data source — MS Excel or text file to any of them, and when you will make change at the source file your indicators will be automatically refreshed, the process of data refreshing occurs every 5 seconds. You can also resize these objects without loss of quality.

Example 3. Sales KPIs and Metrics Library Design Elements
You can also use the predesigned sales dashboard templates which are convenient for filling, the professional looking samples and data source files from ConceptDraw STORE. They can greatly easier the process of creating the Sales Dashboards with set of performance indicators.
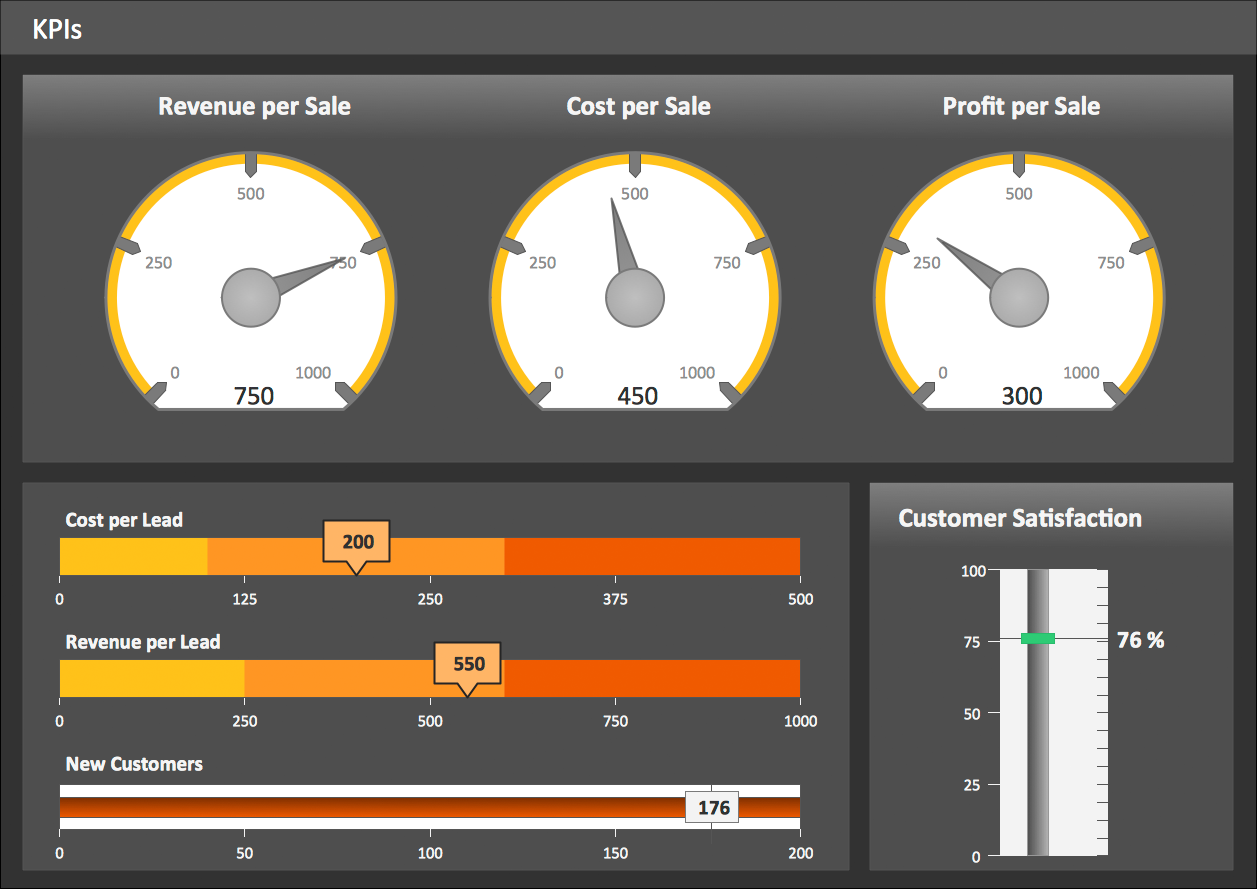
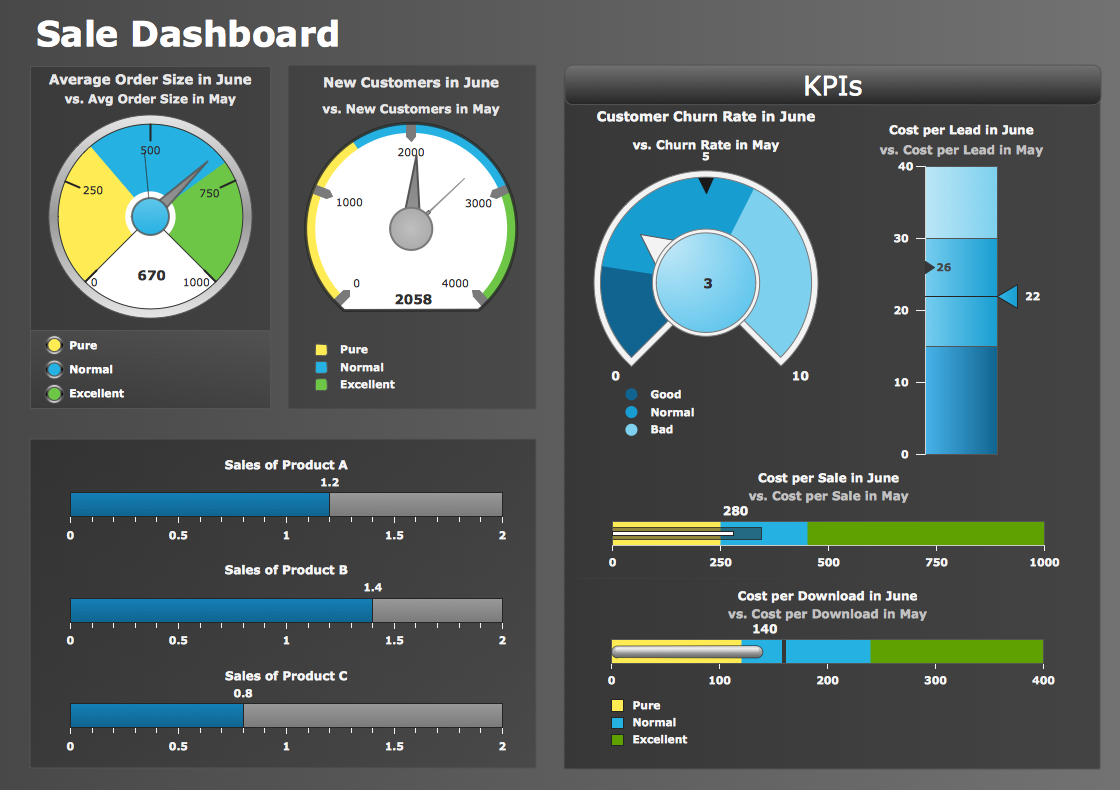
Example 4. Sales KPIs Dashboard
The samples you see on this page were created in ConceptDraw DIAGRAM software using the Sales Dashboard Solution and visually show the key performance indicators. An experienced user spent 10 minutes creating every of these samples.
Use the Sales Dashboard Solution for ConceptDraw Solution Park to represent the key performance indicators fast and easy.
All source documents are vector graphic documents. They are available for reviewing, modifying, or converting to a variety of formats (PDF file, MS PowerPoint, MS Visio, and many other graphic formats) from the ConceptDraw STORE. The Sales Dashboard Solution is available for all ConceptDraw DIAGRAM or later users.