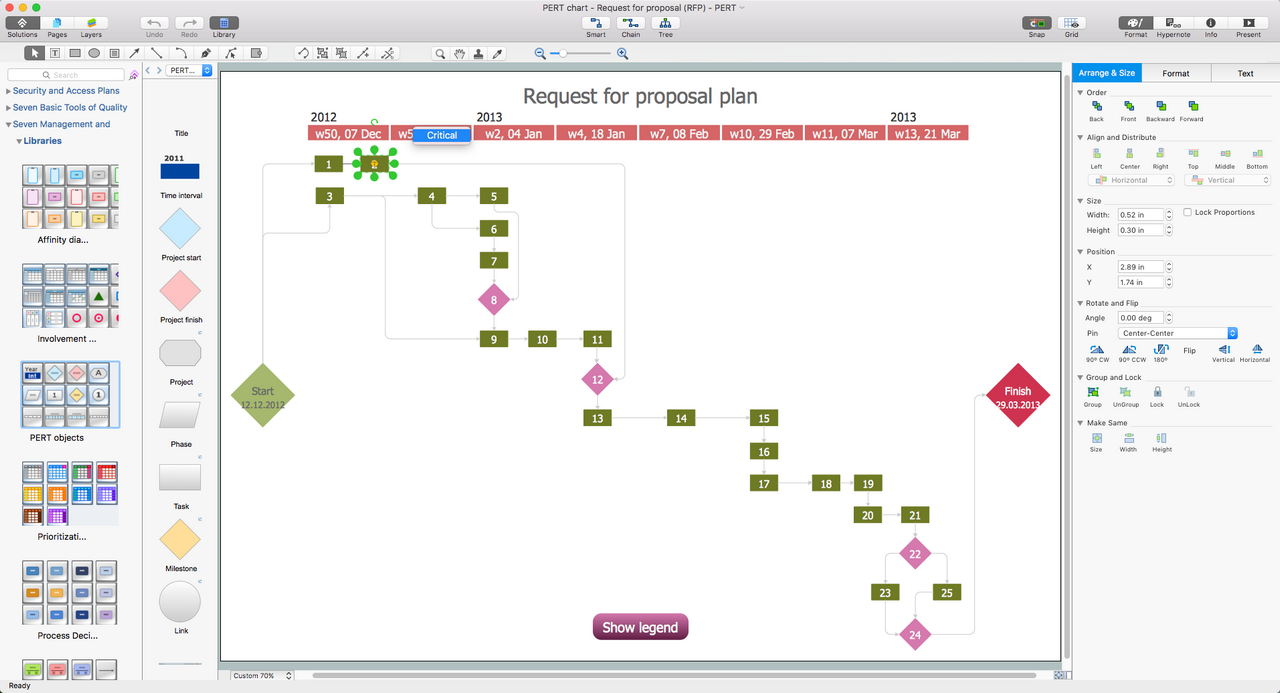
Example 1. PERT Chart Software
Seven Management and Planning Tools solution from the Management area of ConceptDraw Solution Park provides templates, samples and ready-to-use vector stencils that can help you draw the PERT chart in a few moments.

Example 2. PERT Chart Example
The PERT Charts produced with ConceptDraw DIAGRAM are vector graphic documents and are available for reviewing, modifying, and converting to a variety of formats (image, HTML, PDF file, MS PowerPoint Presentation, Adobe Flash or MS Visio).
TEN RELATED HOW TO's:
The 7 Management and Planning Tools solution implements well-known methodologies for problem analysis and solving. Different products from the ConceptDraw Office suite can be used as a complete solution for any of the methodologies in this solution. ConceptDraw Office provides visual communication during every stage of work.
Picture: 7 Management & Planning Tools
Related Solution:
ConceptDraw DIAGRAM is the best program to make workflow diagrams. With the new Arrows10 technology it brings features allow you make workflow diagrams faster then ever before. These features allow you to focus on thinking, not drawing, that makes ConceptDraw DIAGRAM the best program to make workflow diagrams.
Picture: Best Program to Make Workflow Diagrams
Related Solution:
ER-modeling nowadays is a very popular approach for database design. If you are tired of looking for a good entity relationship diagram Software for Mac, then your search is almost over. ConceptDraw DIAGRAM is a great tool for creating diagrams of any complexity with tons of editable samples and templates.
This diagram represents the vector library of the Chen’s and Crow’s Foot notation icons for drawing ERD (entity-relationships diagram). ConceptDraw Entity Relationship Diagram solution delivers the ability to visualize databases structure on both Mac and PC. The "bricks" entity-relationships models are the entity, and the relation. An entity is represented by a rectangle comprising the entity name. It means an object, information about which should be available and stored. A relation is intended to show a relations between two entities. There are several types of relations between entities. To show there are a number of different symbols for the types of relationships.
Picture: Entity Relationship Diagram Software for Mac
Related Solution:
ConceptDraw DIAGRAM diagramming and vector drawing software extended with Bar Graphs solution from the Graphs and Charts area of ConceptDraw Solution Park is ideal for drawing the Bar Charts fast and simply.
Picture: Bar Charts
Related Solution:
AWS platform is great to develop reliable applications. If you are already aware of all the benefits that Amazon Web Services diagrams bring, then you'll need also a diagramming tool for architecture to share your vision. Luckily, ConceptDraw DIAGRAM has a special AWS Diagrams solution with vector icons and templates that are easy to edit.
The AWS architecture diagram, you see on this drawing, was designed using ConceptDraw Amazon Web Services Architecture Diagrams (AWS) solution. The 14 libraries, delivered with this solution introduces near 250 vector graphic images used to draw AWS Diagrams. The AWS Architecture Diagrams solution is a valuable tool for programmers, software architects and other IT professionals. It enables them to develop reliable applications with a high stage of interaction with AWS cloud.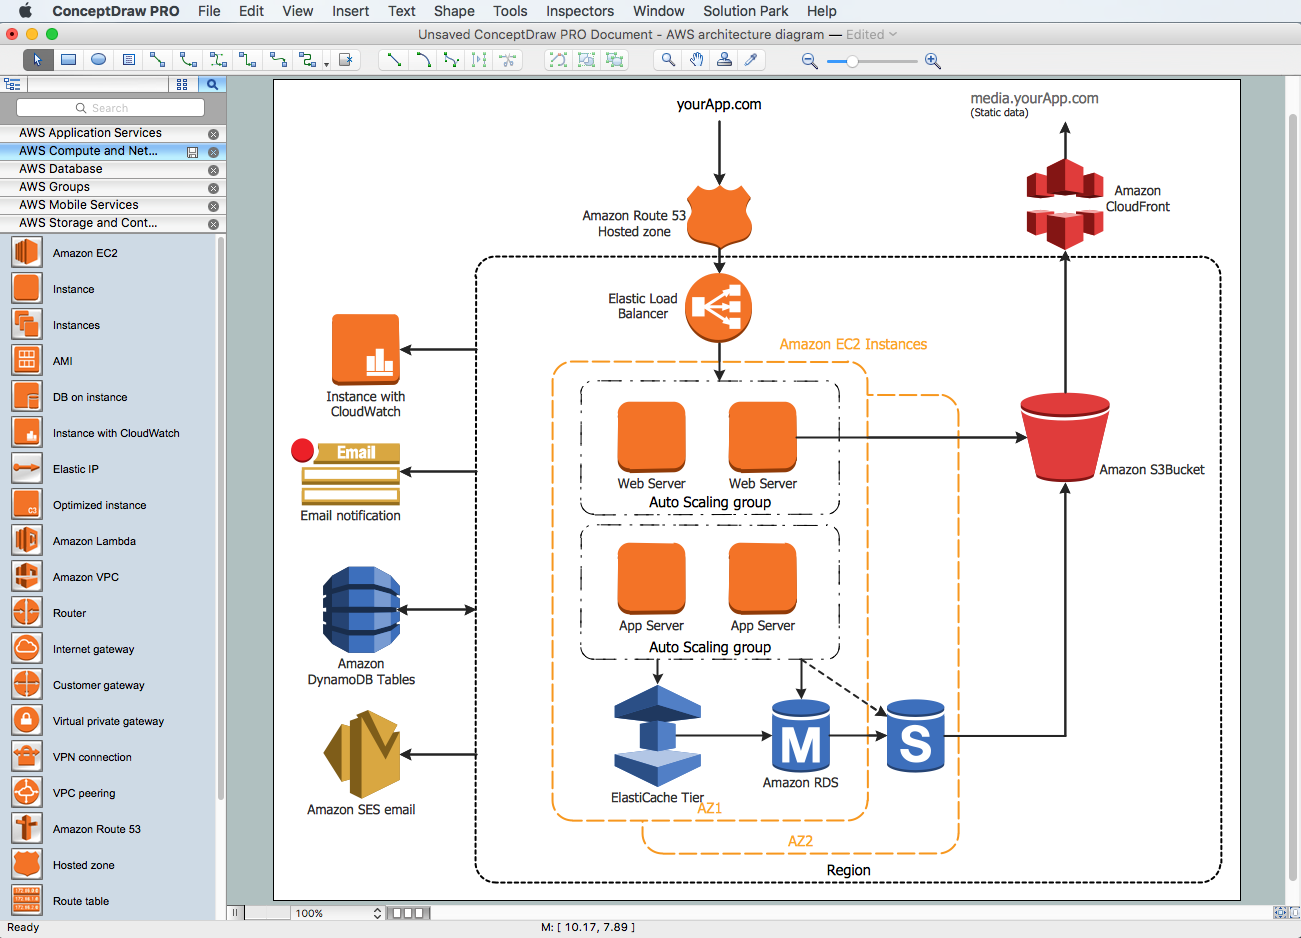
Picture: Amazon Web Services Diagrams diagramming tool for architecture
There are many tools to manage a process or to illustrate an algorithm or a workflow. Flowcharting is one of those tools. However, it may be difficult to show complex processes that require multiple attributes or several people in a simple flowchart, so a cross-functional flowchart would be a solution for that situation. To create such flowchart, group processes and steps to labeled rows or columns, and divide those groups with horizontal or vertical parallel lines. It is worth mentioning that there are different types of cross-functional flowcharts, like opportunity or deployment flowchart.
This diagram shows a cross-functional flowchart that was made for a trading process. It contains 14 processes, distributed through 5 lines depicting the participants who interact with the process. Also there are connectors that show the data flow of information between processes. The cross-functional flowchart displays a detailed model of the trading process, as well as all participants in the process and how they interact with each other. The lines in the flowchart indicates the position, department and role of the trading process participants.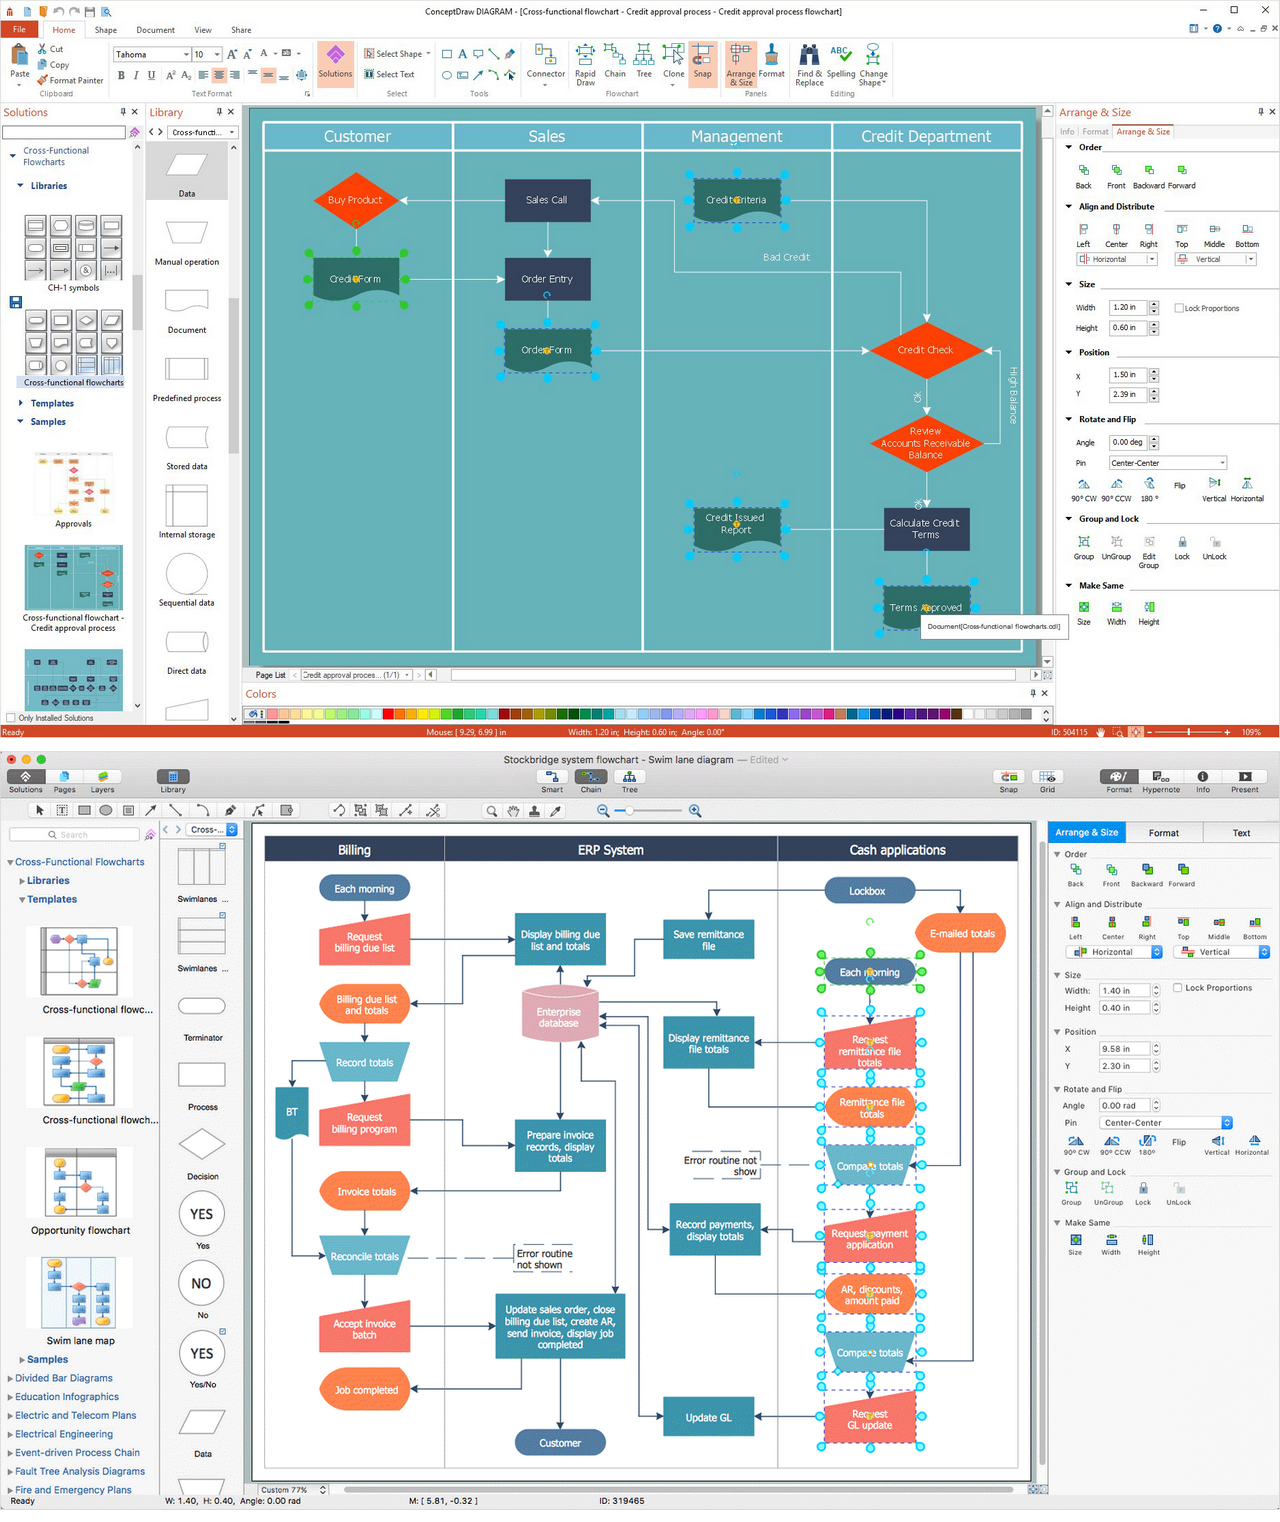
Picture: Cross-Functional Flowchart
Related Solution:
Creation of various types of Integration DEFinition (IDEF) diagrams - IDEF0, IDEF1X, IDEF2, IDEF3 and many other is a sufficiently complex process that requires powerful automated tools. ConceptDraw DIAGRAM diagramming and vector drawing software offers you such tool - IDEF Business Process Diagrams solution from the Business Processes area of ConceptDraw Solution Park.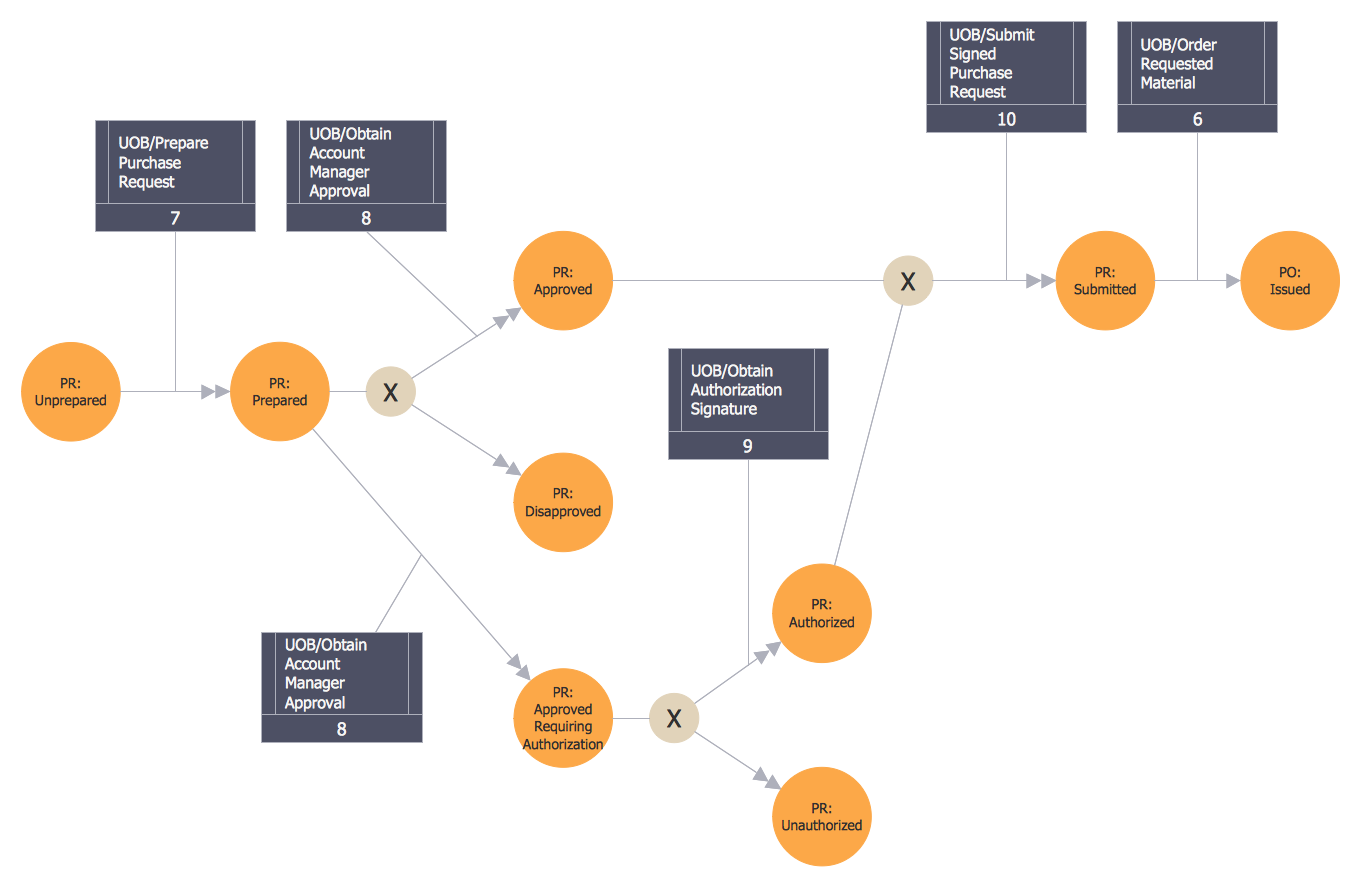
Picture: Integration Definition
Related Solution:
Business Process Modeling Notation -BPMN- is a set of standard symbols that allow you to create a graphical view of a business process. The symbols were developed to help users develop standard, unified structure of processes, and any messages shared between these processes. This is business process improvement tools.
Picture: Business Process Modeling with ConceptDraw
Related Solution:
The Seven Management and Planning Tools is a tool for Root Cause Analysis Tree Diagram drawing. This diagram is for Root Cause Analysis.
Analyze the root causes for factors that influenced the problem. This diagram is constructed separately for each highly prioritized factor. The goal of this is to find the root causes for the factor and list possible corrective action.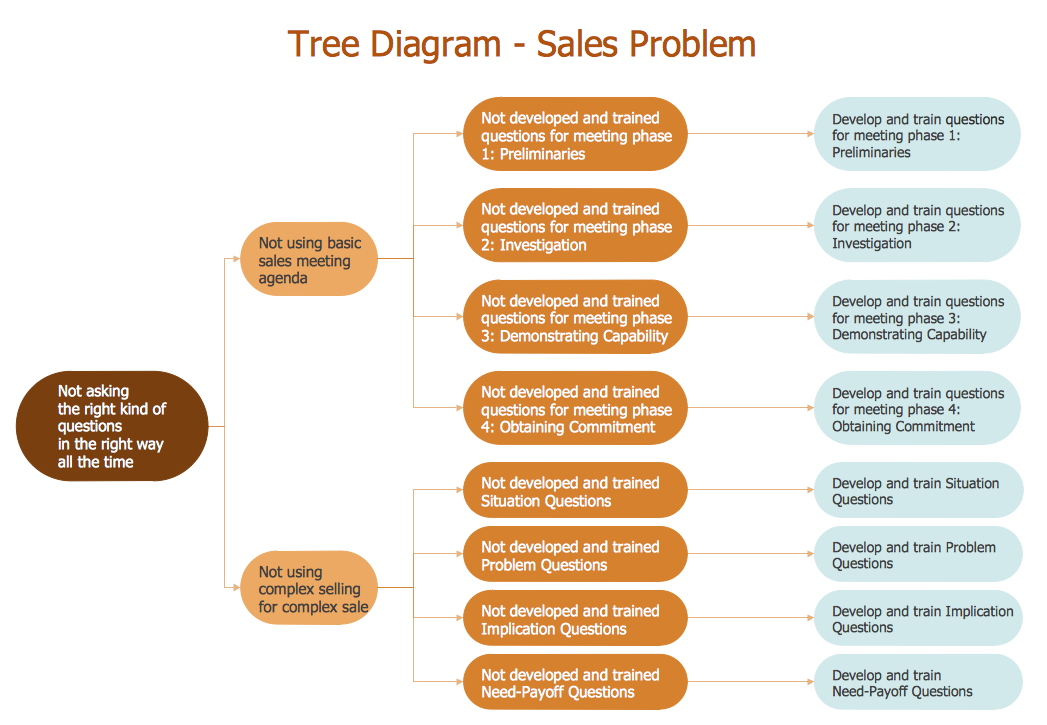
Picture: Root Cause Analysis
A computer network diagram for a large network can be complicated and difficult both to understand and to draw. To learn how to deal with complex network diagrams, start with a basic network diagram, showing only the primary network devices and the connections between them. There are software tools to help you with that, such as ConceptDraw DIAGRAM , that include templates and examples for simple and common network diagrams.
The ConceptDraw solution for making computer network diagrams delivers over a thousand of vector objects, composed into the forty vector libraries that were developed to support drawing of professional-looking computer network diagrams. This diagram of computer network can be used by system administrator as a basic template for making the custom network diagram. Since the responsibilities of network or system administrator include documenting of computer network, drawing network diagrams is an important part of their work.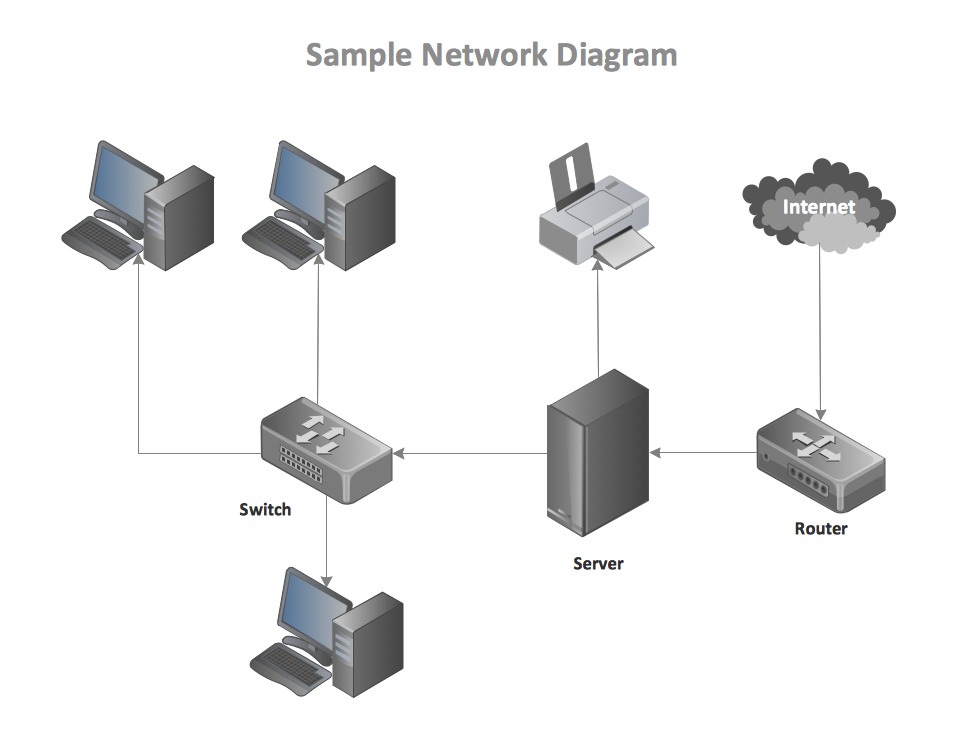
Picture: Basic Network Diagram