
Sample 1. Physics diagrams – Free Body Diagram
Physics Solution provides 3 libraries of nuclear physics, mechanics and optics vector symbols and clipart:
- Mechanics Library
- Nuclear Physics Library
- Optics Library
that will help you create your physics diagrams in few minutes.

Sample 2. Physics diagrams – The Eightfold Way
Physics solution offers also the whole collection of predesigned templates and samples of various physics diagrams that you can find in our ConceptDraw STORE. All samples and templates are available for changing and further successful using.

Sample 3. Physics diagrams – Ray Tracing Diagram for Concave Lens
The samples you see on this page were created in ConceptDraw DIAGRAM using the physics symbols and clipart from the Physics Solution for ConceptDraw DIAGRAM These samples demonstrate solution's capabilities and professional results you can achieve. An experienced user spent 5 minutes creating every of these samples.
Use the Physics Solution for ConceptDraw DIAGRAM software to create your own professional looking physics diagrams and illustrations of any complexity quick, easy and effective.
All source documents are vector graphic documents. They are available for reviewing, modifying, or converting to a variety of formats (PDF file, MS PowerPoint, MS Visio, and many other graphic formats) from the ConceptDraw STORE. The Physics Solution is available for all ConceptDraw DIAGRAM or later users.
TEN RELATED HOW TO's:
Draw Cisco Network Topology and Cisco Computer Network Diagrams, Designs, Schematics, and Network Maps using ConceptDraw in no Time!
Cisco Network Diagrams solution also provides 15 libraries of 508 Cisco symbols for network components and points, LAN and WAN, schematic and wiring drawings.
Picture: Cisco Network Topology
Related Solution:
A database is a data collection, structured into some conceptual model. Two most common approaches of developing data models are UML diagrams and ER-model diagrams. There are several notations of entity-relationship diagram symbols and their meaning is slightly different. Crow’s Foot notation is quite descriptive and easy to understand, meanwhile, the Chen notation is great for conceptual modeling.
An entity relationship diagrams look very simple to a flowcharts. The main difference is the symbols provided by specific ERD notations. There are several models applied in entity-relationship diagrams: conceptual, logical and physical. Creating an entity relationship diagram requires using a specific notation. There are five main components of common ERD notations: Entities, Actions, Attributes, Cardinality and Connections. The two of notations most widely used for creating ERD are Chen notation and Crow foot notation. By the way, the Crow foot notation originates from the Chen notation - it is an adapted version of the Chen notation.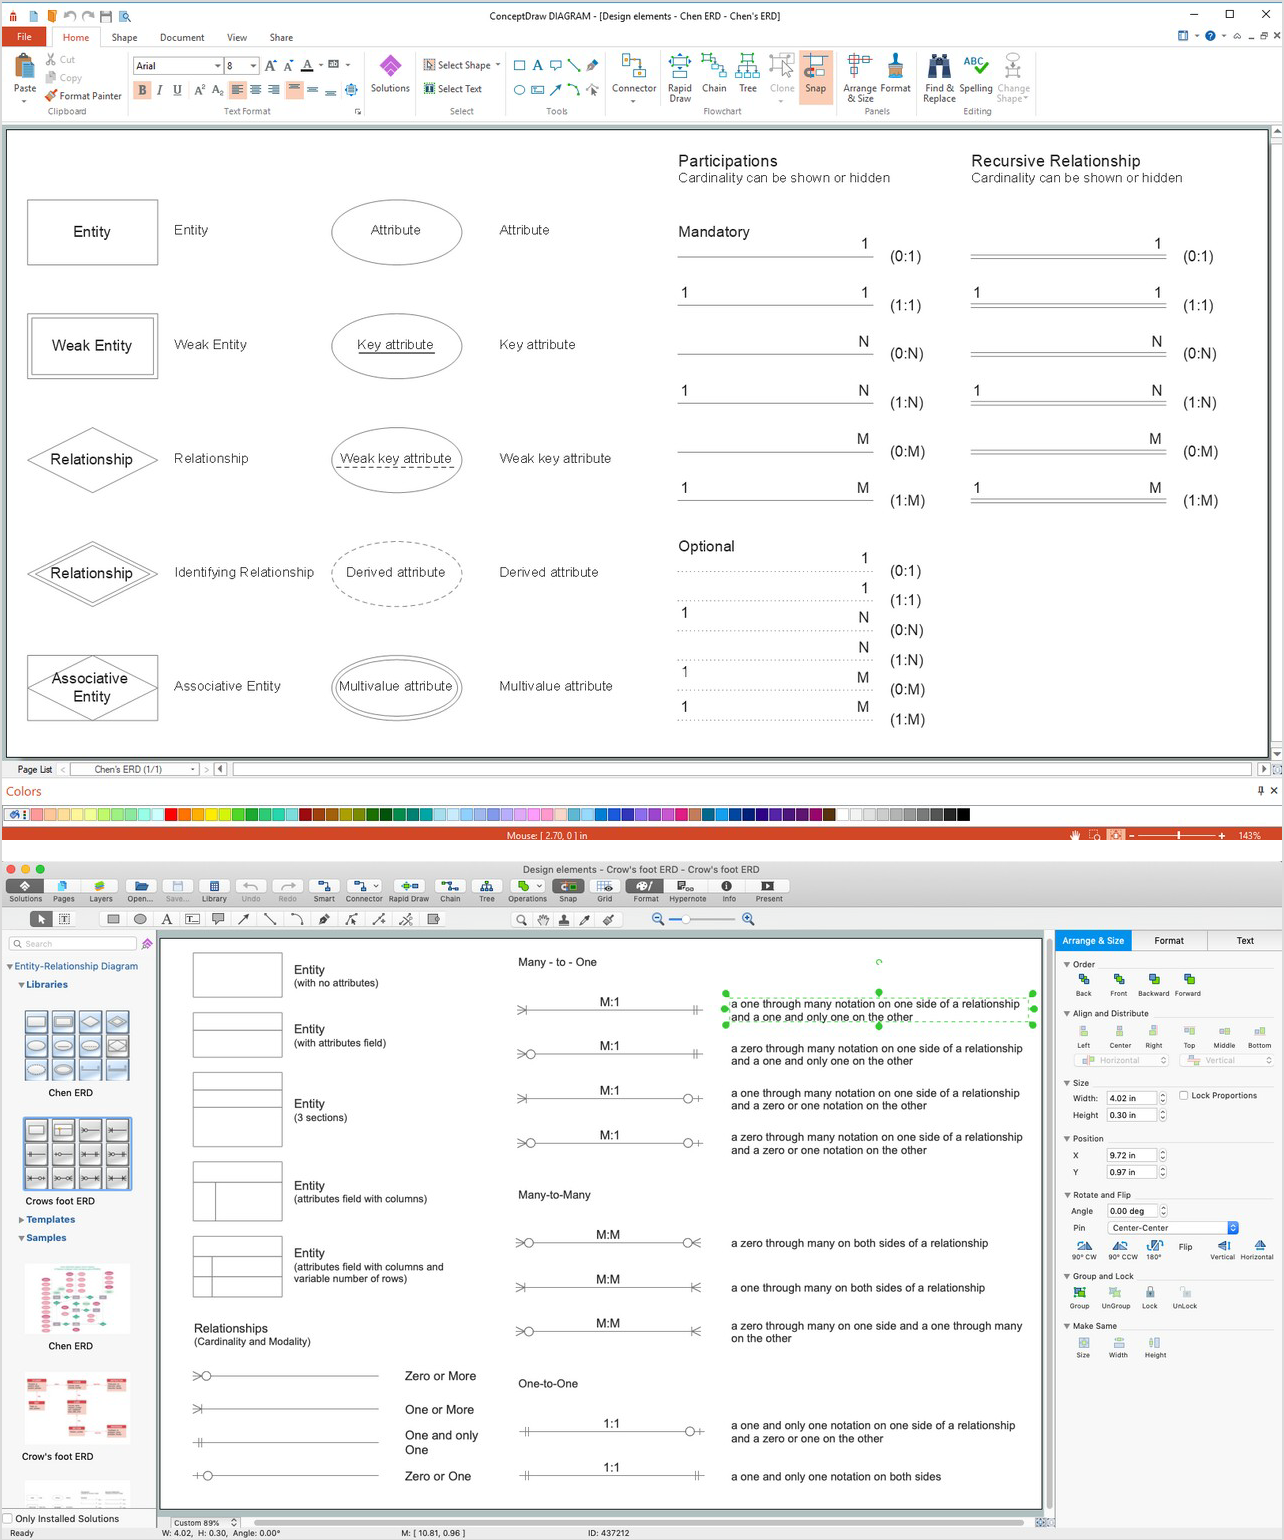
Picture: ERD Symbols and Meanings
Related Solution:
ConceptDraw DIAGRAM software is a great assistant in electrical engineering and electrical design. It is efficient in creating ✔️ complex and simple electrical designs, ✔️ power generation, transmission, and distribution electrical schematics, ✔️ transformers diagrams, ✔️ electrical schematics with transformers
Picture: Electrical Symbols — Transformers and Windings
Related Solution:
The Pie Chart visualizes the data as the proportional parts of a whole and looks like a disk divided into sectors. The pie chart is type of graph, pie chart looks as circle devided into sectors. Pie Charts are widely used in the business, statistics, analytics, mass media. It’s very effective way of displaying relative sizes of parts, the proportion of the whole thing.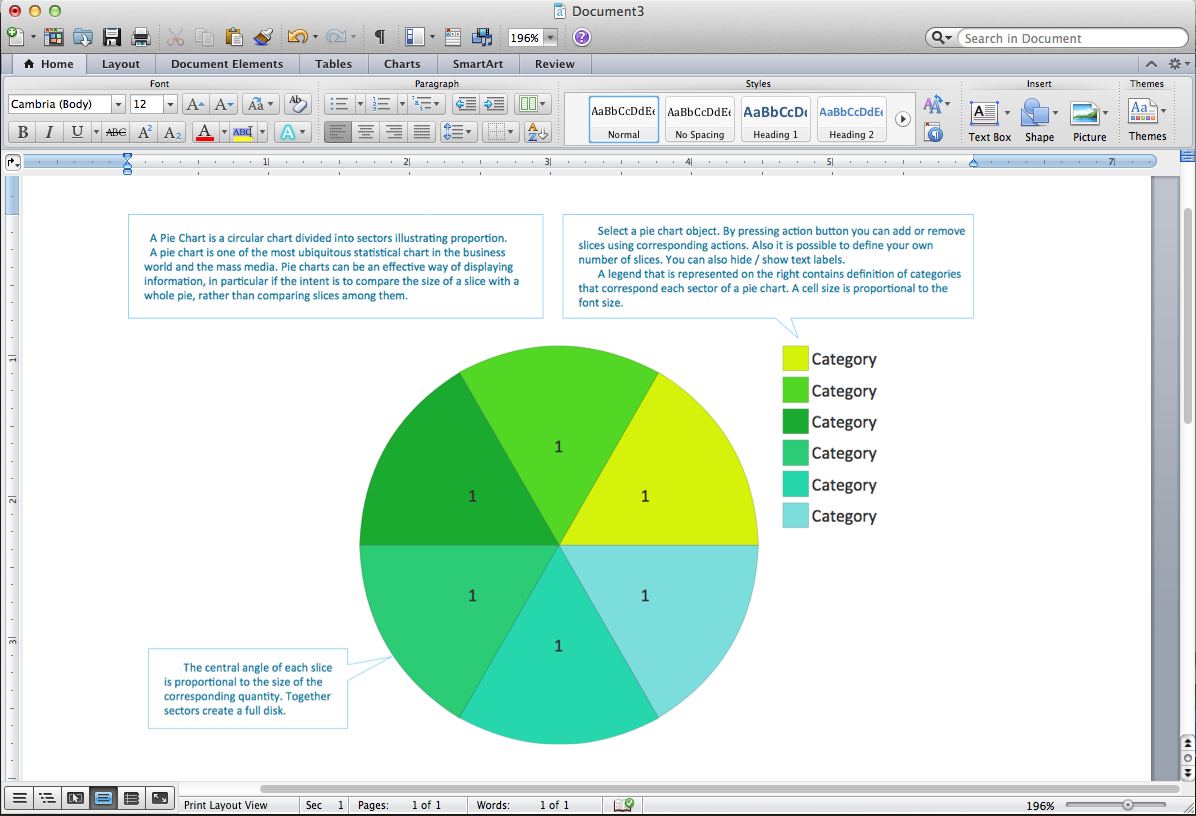
Picture: Pie Chart Word Template. Pie Chart Examples
Related Solution:
Convey complex information in a simple format, improve your productivity and creativity, and increase your potential reach by publishing infographics created in infographic project management software ConceptDraw DIAGRAM with the help of the Management Infographics solution or other solutions from the Business Infographics package or Project Management package. Use infographics as a part of your content strategy.
Picture: Infographic Project Management
Related Solution:
Bar charts represent data in different categories or groups.
Create bar graphs for visual solving your scientific problems and data comparison using the ConceptDraw DIAGRAM diagramming and vector drawing software extended with the Bar Graphs Solution from the Graphs and Charts area of ConceptDraw Solition Park.
Picture: Bar Diagrams for Problem Solving.Create space science bar charts with Bar Graphs Solution
Related Solution:
Astronomy and astrology require from the specialists permanent drawing wide variety of illustrations, sketches. It’s convenient for astronomers and astrologers to have software that will help design them quick and easy. ConceptDraw DIAGRAM diagramming and vector drawing software extended with Astronomy solution from the Science and Education area is exactly what they need.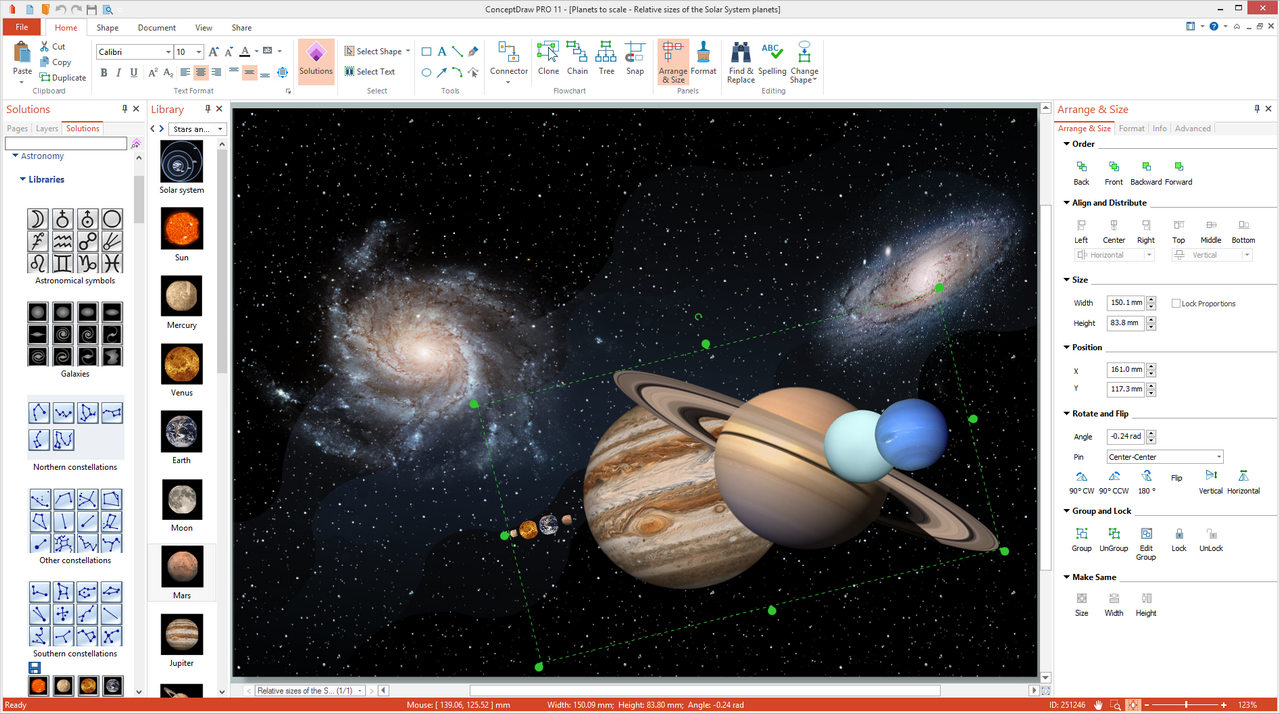
Picture: Astronomy and Astrology
Related Solution:
ConceptDraw DIAGRAM is a powerful drawing and vector diagram maker software that allows to design the professional looking Influence Diagrams quick and easy.
Picture: Influence Diagram Software
Related Solution:
ConceptDraw DIAGRAM is a software for simplу depicting the business processes based on BPMN 2.0.
Business Process Diagrams Cross-Functional-Flowcharts, Workflows, Process Charts, IDEF0 and IDEF2, Timeline, Calendars, Gantt Charts, Business Process Modeling, Audit and Opportunity Flowcharts and Mind Maps (presentations, meeting agendas).
Picture: Business Process Modeling Notation
Related Solution:
The vector stencils library Rail transport contains clipart of railway transport for ConceptDraw DIAGRAM diagramming and vector drawing software.
Use it to draw illustrations of trains and transportation of passengers and goods by railroads.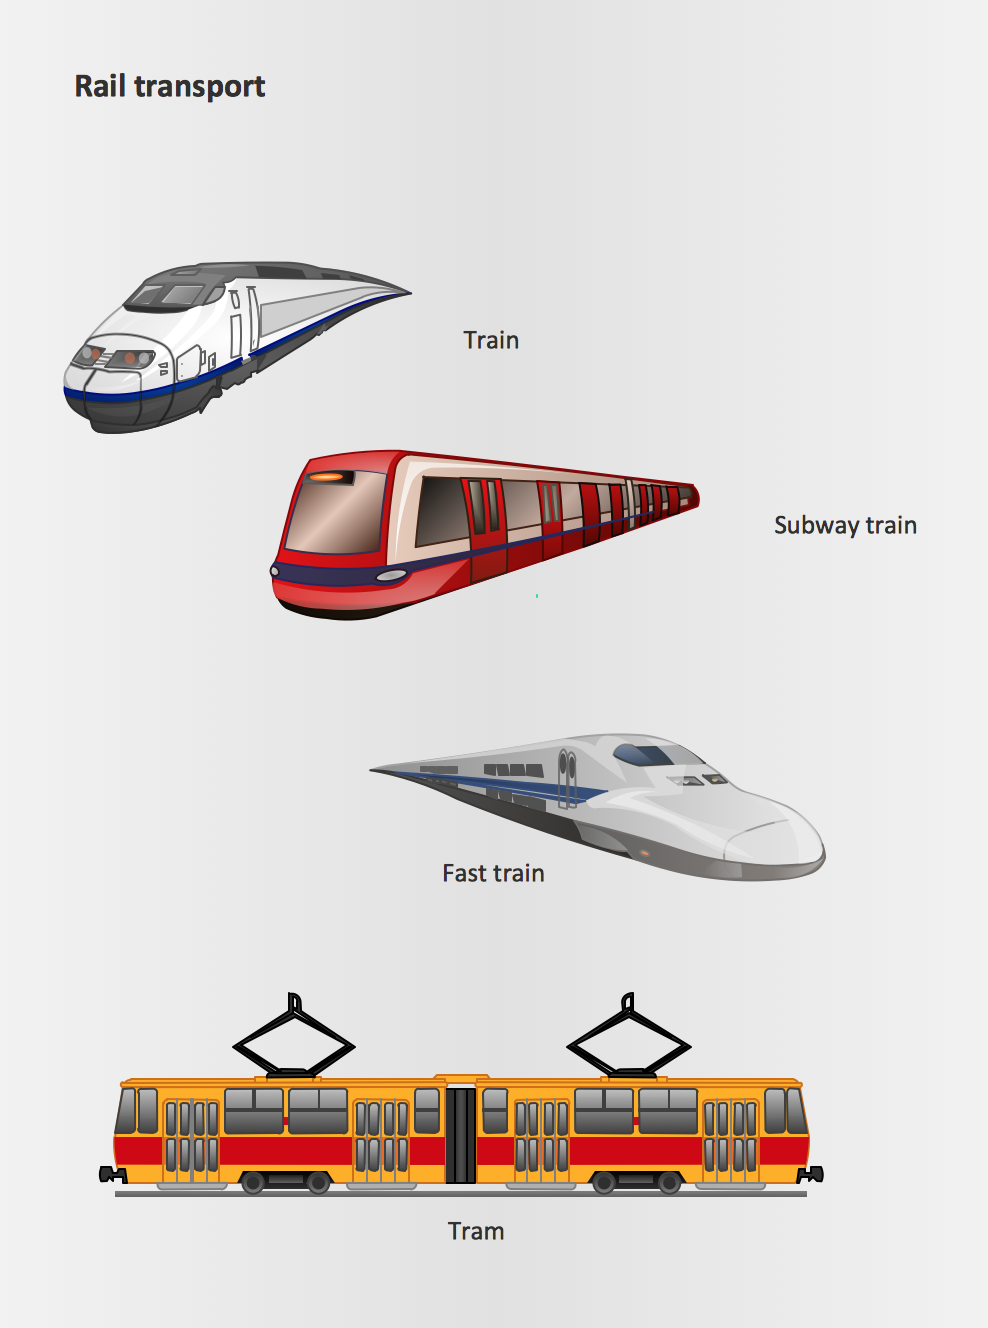
Picture: Rail transport - Design elements
Related Solution:

