Pictures of Graphs
ConceptDraw DIAGRAM software extended with Picture Graphs solution from the Graphs and Charts Area is the best choice for making professional looking pictures of graphs and colorful picture graphs.
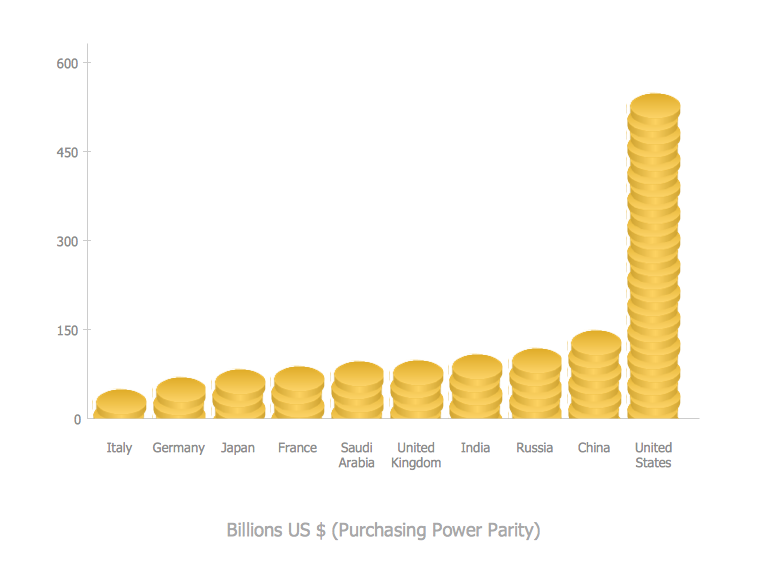
Example 1. Pictures of Graphs — 2007 top 10 countries by military expenditure PPP
Picture Graphs Solution provides collection of predesigned templates, samples, examples of the pictures of graphs which you can see in ConceptDraw STORE. They were designed specially for ConceptDraw DIAGRAM users and are available for viewing and editing.

Example 2. Pictures of Graphs - Barrie population
Picture Graphs solution includes also the Picture Graphs library with predesigned vector objects which will help you create fast and easy your own professional looking, visual, colorful pictures of graphs and then successfully use them.

Example 3. Pictures of Graphs — Population growth by continent
The pictures of graphs you see on this page were created in ConceptDraw DIAGRAM using the vector objects from the Pictures Graphs library of Pictures Graphs Solution. These samples demonstrate the solution's capabilities and the professional results you can achieve. An experienced user spent 5 minutes creating every of these samples.
All source documents are vector graphic documents. They are available for reviewing, modifying, or converting to a variety of formats (PDF file, MS PowerPoint, MS Visio, and many other graphic formats) from the ConceptDraw STORE. The Pictures Graphs Solution is available for all ConceptDraw DIAGRAM or later users.
TEN RELATED HOW TO's:
Need to draw a diagram, process chart, flowchart, organizational chart, graphic design? ConceptDraw can help you to make professional graphic documents quickly.
Picture: Best Diagramming
Related Solution:
Drawing defensive strategy diagrams using ConceptDraw DIAGRAM software extended with the Football solution saves your time, and adds more value to your work. You can easily convert vector drawing to a popular graphic format and then post it to your blog or site. There is no problem to add your logo or text copyright, or use some text comments to make your diagrams unique and recognizable.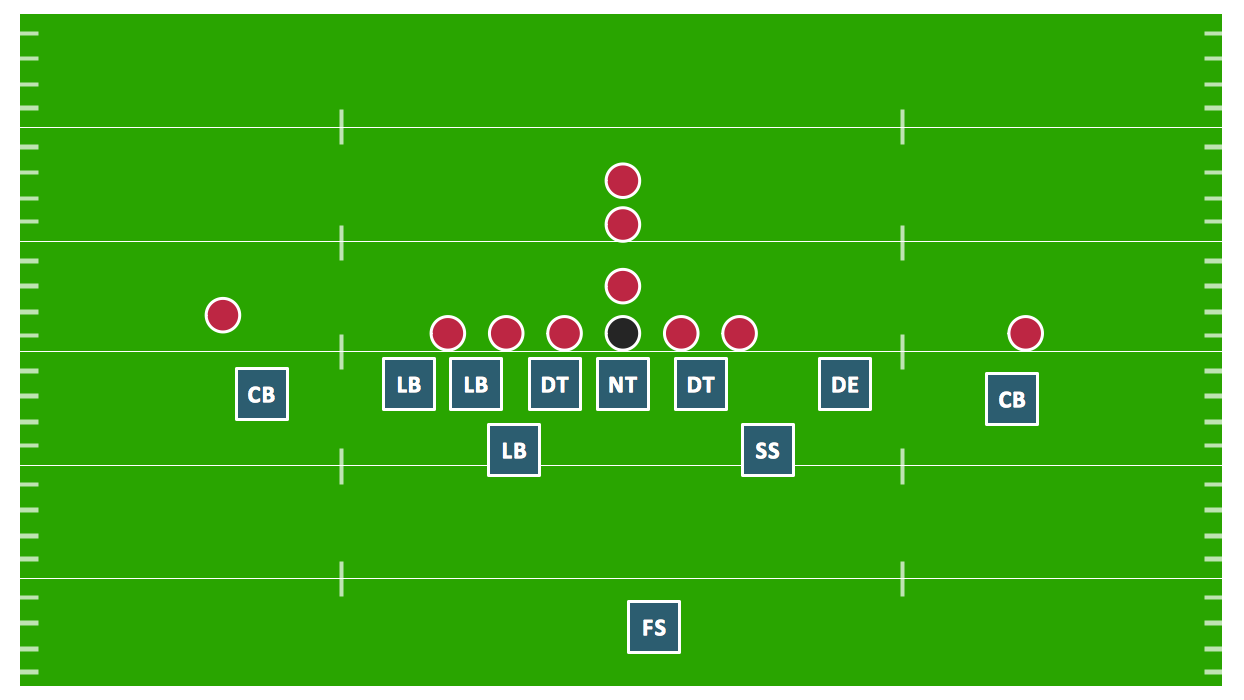
Picture: Defensive Strategy Diagram – 46 Defence
Related Solution:
This sample shows the Horizontal Bar Chart of the average monthly rainfalls.
This sample was created in ConceptDraw DIAGRAM diagramming and vector drawing software using the Bar Graphs Solution from the Graphs and Charts area of ConceptDraw Solution Park.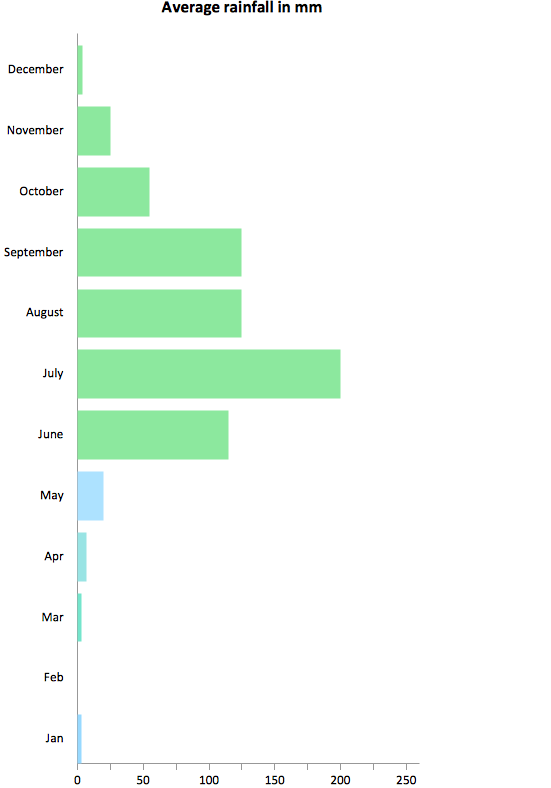
Picture: Rainfall Bar Chart
Related Solution:
Pie Graph is very popular kind of charts which is widely used in various fields of science and life activities. ConceptDraw DIAGRAM extended with Pie Charts Solution from the Graphs and Charts area is the best software for drawing the Pie Graph Worksheets.
Picture: Pie Graph Worksheets
Related Solution:
Use ConceptDraw DIAGRAM software as a powerful audit application. 🔸 Create professional Audit Workflow Diagrams and Audit Process Flowcharts to ✔️ plan and implement audit process, ✔️ enhance financial transparency, ✔️ improve financial reporting, ✔️ streamline operations, ✔️ improve business efficiency, ✔️ identify risks and issues, ✔️ prevent financial fraud, ✔️ track progress, ✔️ enhance trust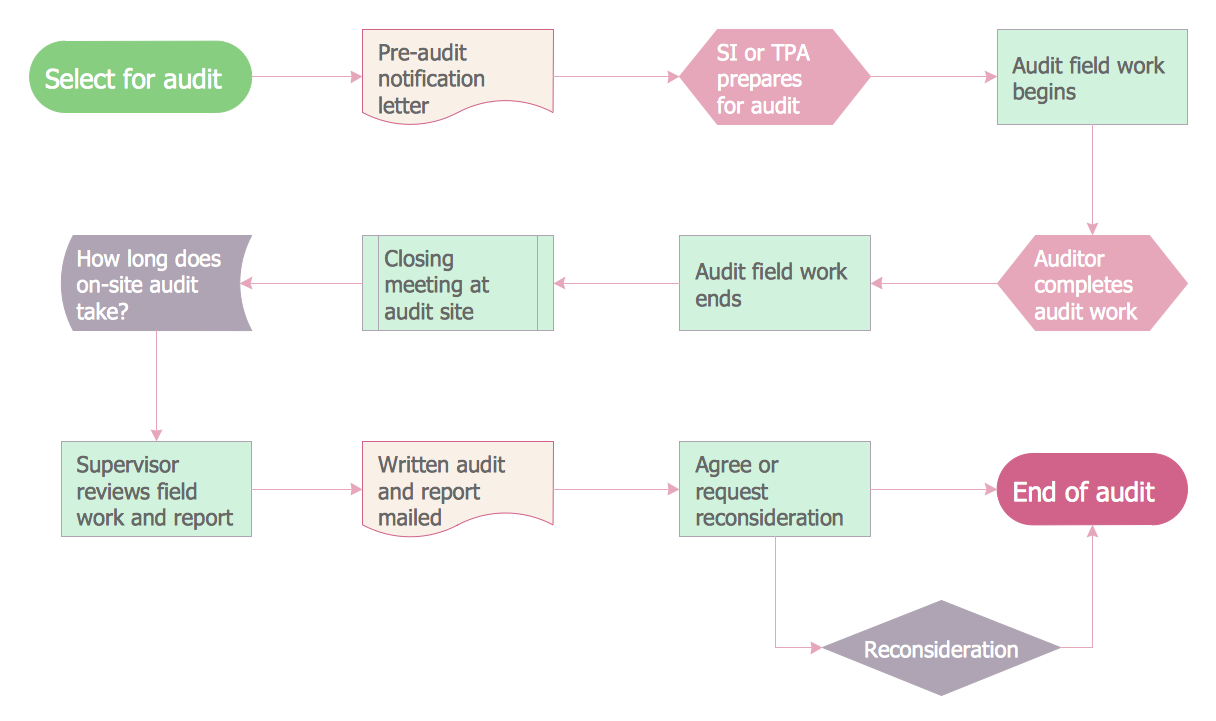
Picture: Understanding the Audit Process: A Comprehensive Guide. Audit Process Flowchart
Related Solution:
As concept map consists from conception-blocks and links between them, you can use ConceptDraw library objects and add to a document as much objects as you need. ConceptDraw tools let you to edit, group, move objects, change their appearance and add text signs and raster or vector pictures.
ConceptDraw DIAGRAM diagramming and vector drawing software extended with Concept Maps Solution from the Diagrams Area is effective tool for creating professional looking Concept Maps.
Picture: Concept Maps
Related Solution:
Florida is a state in the southeastern region of the United States, bordered to the west by the Gulf of Mexico, to the north by Alabama and Georgia, to the east by the Atlantic Ocean, and to the south by the Straits of Florida.
The vector stencils library Florida contains contours for ConceptDraw DIAGRAM diagramming and vector drawing software. This library is contained in the Continent Maps solution from Maps area of ConceptDraw Solution Park.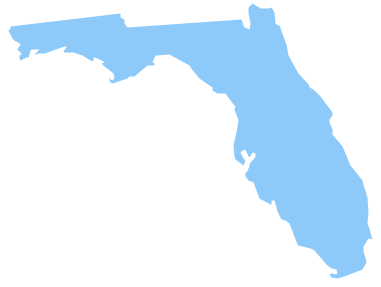
Picture: Geo Map — USA — Florida
Related Solution:
How to make histogram in ConceptDraw DIAGRAM?
Picture: How To Make Histogram in ConceptDraw DIAGRAM ?
Related Solution:
What is a Histogram Chart? It is a chart which visually displays a distribution of the data. ConceptDraw DIAGRAM for fast and simple drawing professional looking Histogram Chart.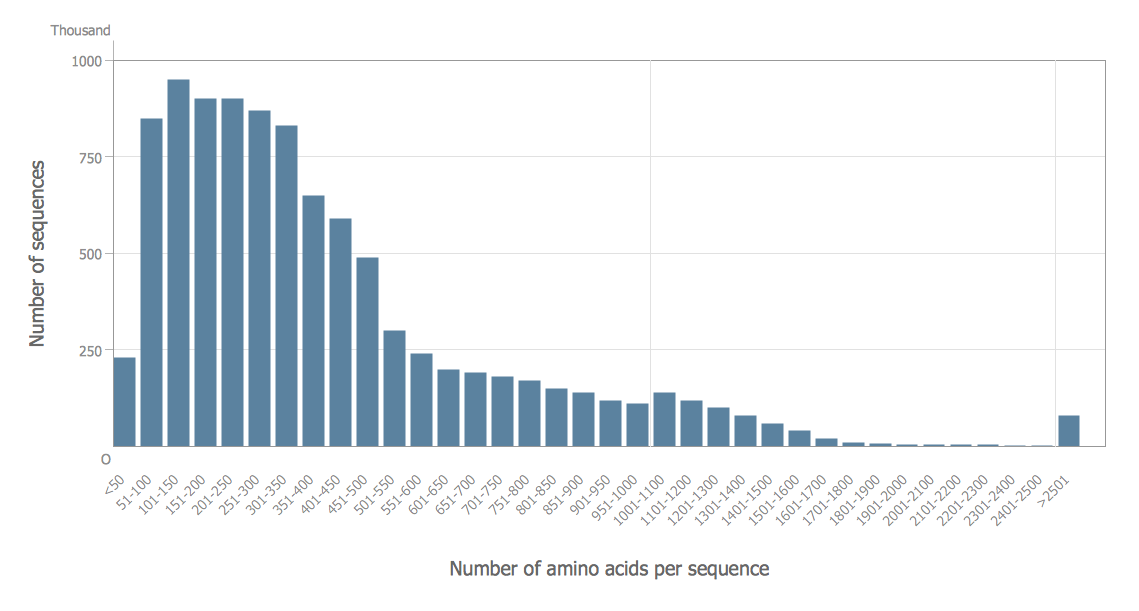
Picture: Histogram Chart
Related Solution:
Process Flow Chart is a visual diagram which shows the processes and relationships between the major components in a system, and uses for this the special process flow chart symbols: special shapes to represent different types of actions and process steps, lines and arrows to represent relationships and sequence of steps. It often named process flow diagram, it use colored flowchart symbols.
It is incredibly convenient to use the ConceptDraw DIAGRAM software extended with Flowcharts Solution from the Diagrams Area of ConceptDraw Solution Park for designing professional looking Process Flow Charts.
Picture: Process Flow Chart Symbols
Related Solution:

