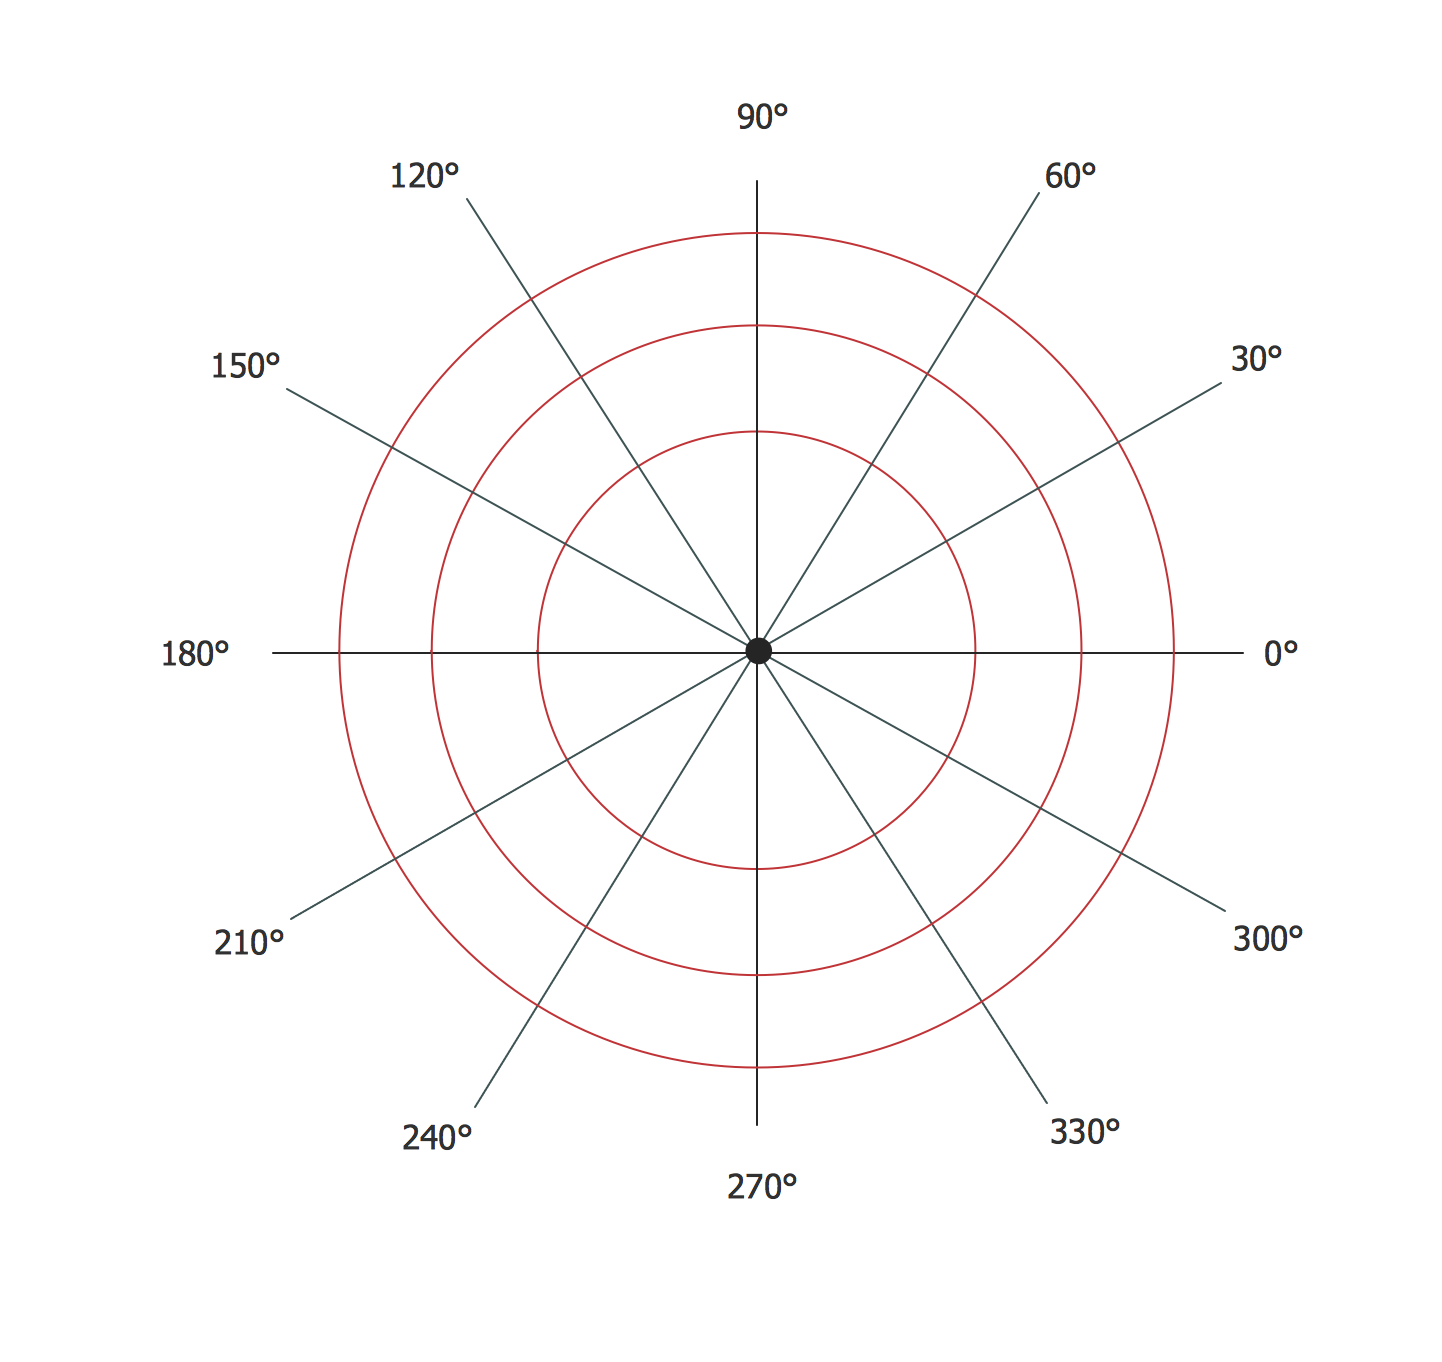
Using the ready-to-use predesigned objects from the Basic Diagramming Solution for ConceptDraw DIAGRAM you can create your own professional looking Polar Graphs quick and easy.
The Polar Graphs produced with ConceptDraw DIAGRAM are vector graphic documents and are available for reviewing, modifying, and converting to a variety of formats (image, HTML, PDF file, MS PowerPoint Presentation, Adobe Flash or MS Visio).
TEN RELATED HOW TO's:
Electrical plan is a document that is developed during the first stage of the building design. This scheme is composed of conventional images or symbols of components that operate by means of electric energy. To simplify the creation of these schemes you can use house electrical plan software, which will not require a long additional training to understand how to use it. You only need to install the necessary software ant it’s libraries and you’ll have one less problem during the building projection.
Any building contains a number of electrical systems, including switches, fixtures, outlets and other lightening equipment. All these should be depicted in a building electrical plans and included to general building documentation. This home electrical plan displays electrical and telecommunication devices placed to a home floor plan. On the plan, each electrical device is referenced with the proper symbol. Electrical symbols are used for universal recognition of the building plan by different persons who will be working on the construction. Not all possible electric symbols used on a certain plan, so the symbols used in the current home plan are included to a legend. The electrical home plan may be added as a separate document to a complete set of building plans.
Picture: How To use House Electrical Plan Software
Related Solution:
Illustrate the Asia continent and explore its parts, geographical features, resources, and economic development through 🔸 designing various kinds of colorful Asia maps and using them in ✔️ presentations, ✔️ reports, ✔️ educational materials, ✔️ websites, ✔️ business documents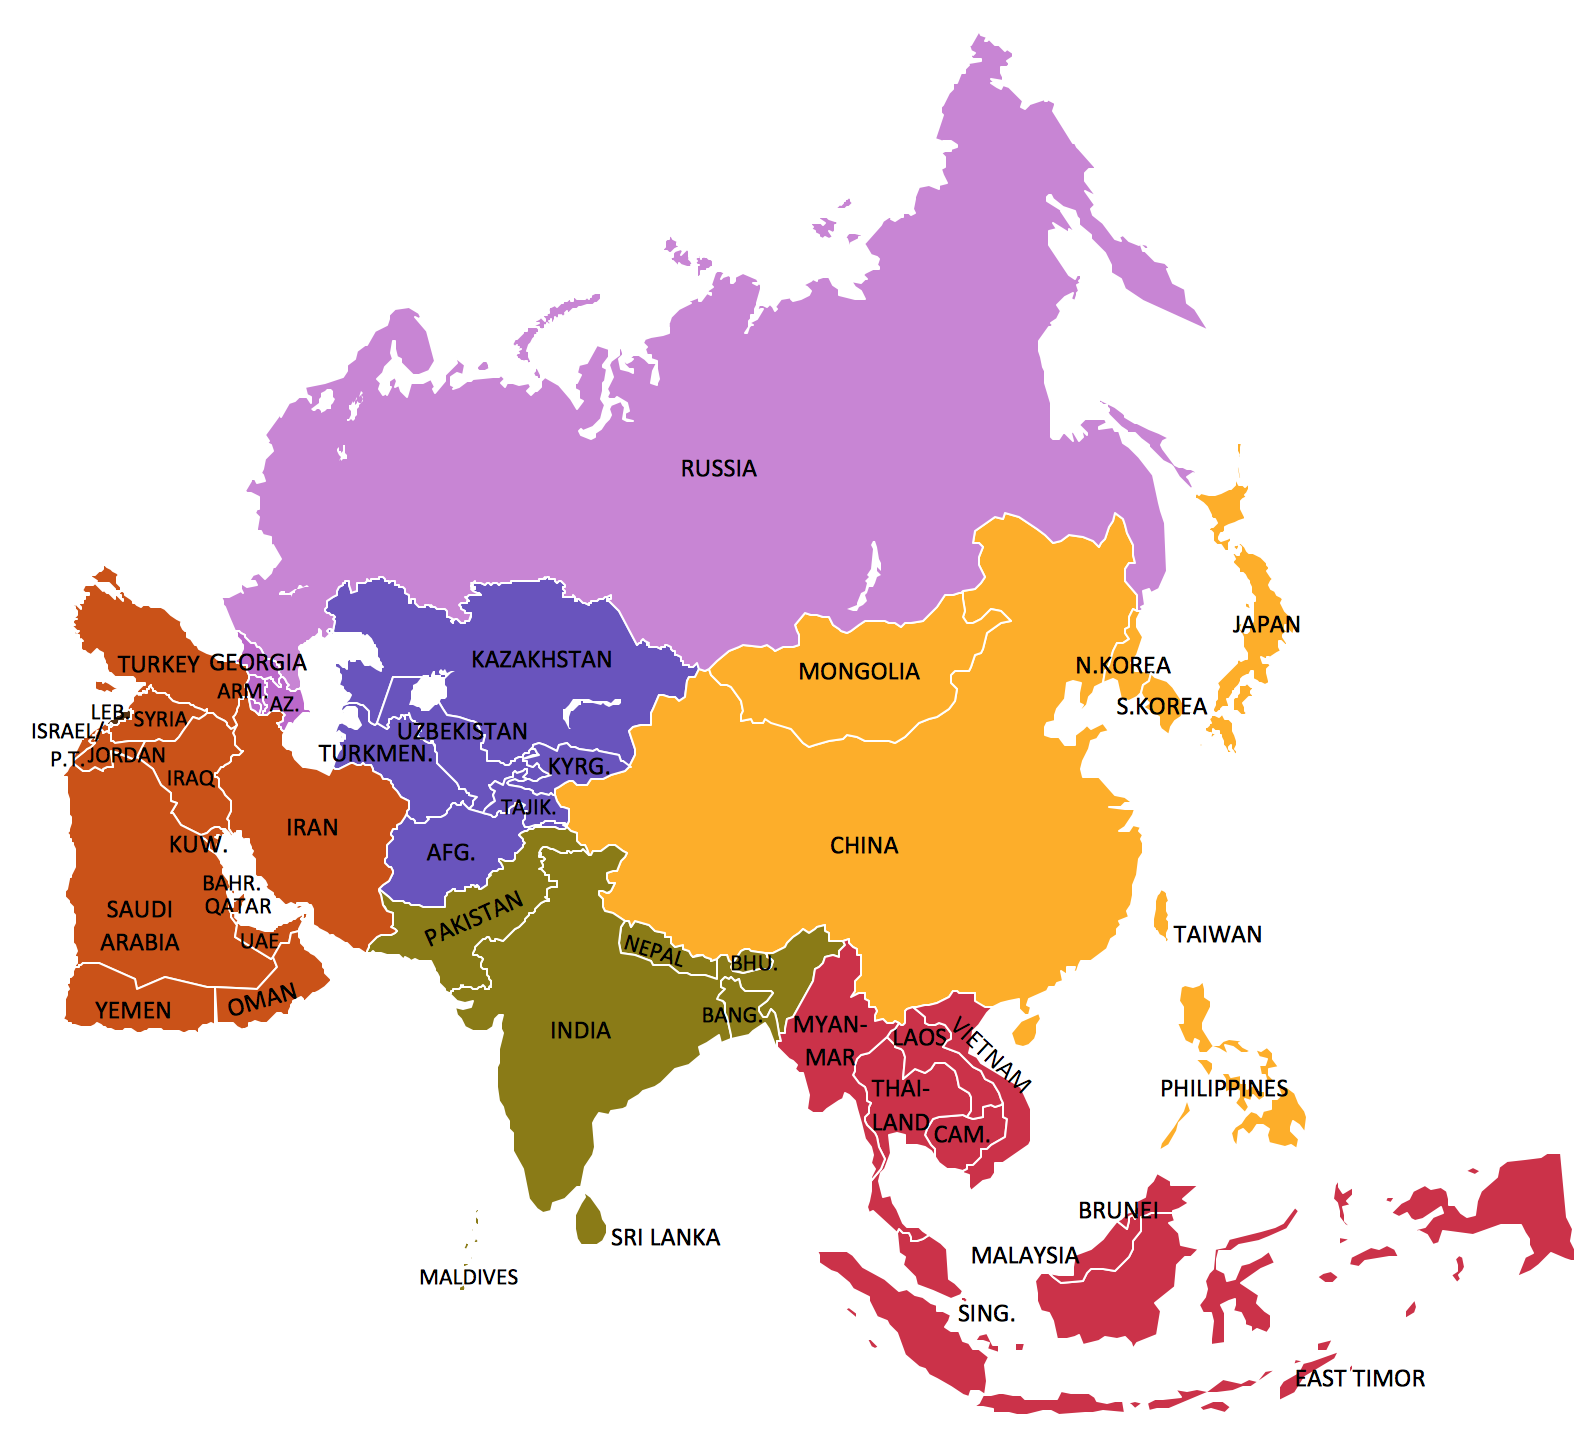
Picture: Geo Map — Asia
Related Solution:
Any bar chart can be also called as a bar graph or a column chart or graph. Being a chart or a graph that is commonly used for presenting some categorical data with the rectangular bars having their lengths or heights proportional to the values that they represent, such drawings can be made with the help of the ConceptDraw DIAGRAM diagramming and drawing software. The created bars can be plotted either vertically or horizontally and any vertical bar chart can be also sometimes called as a line graph.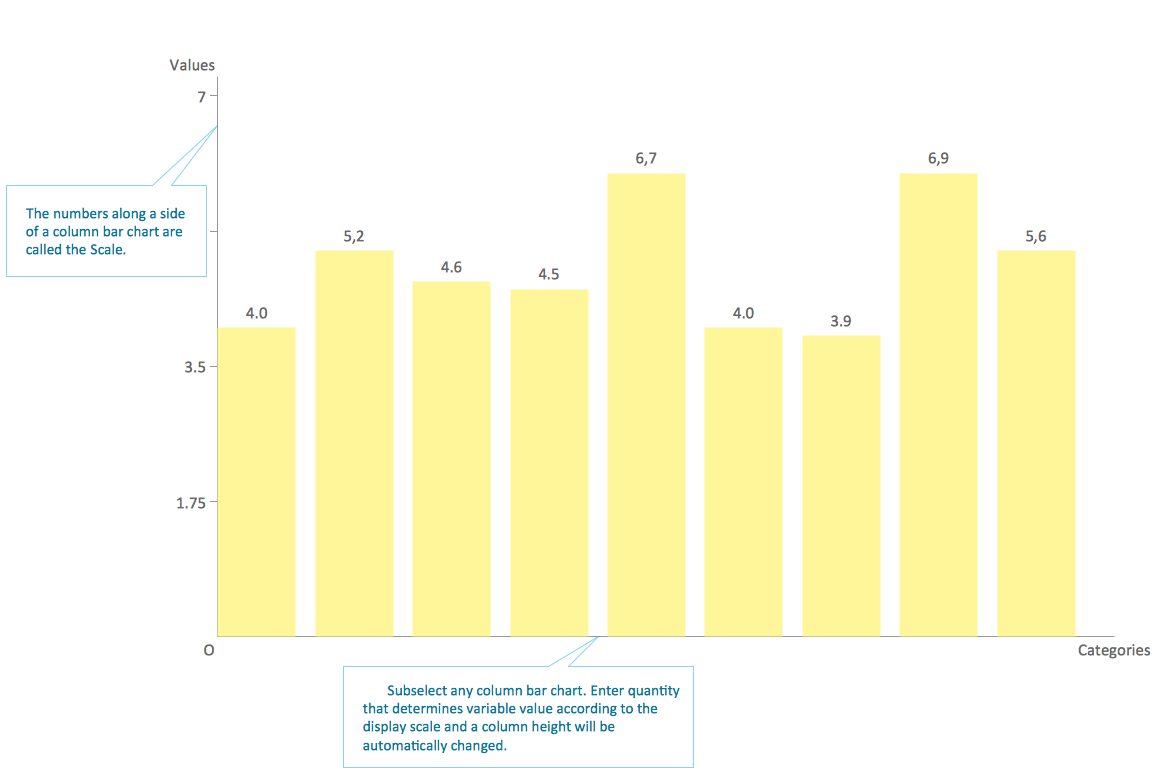
Picture: Column Chart Template
Related Solution:
This template shows the Six Markets Model Chart and was included in Marketing Diagrams Solution. It is available from ConceptDraw STORE and can be used as the base for creating your own marketing diagrams.
Picture: Six Markets Model Chart Template
Related Solution:
Learn how to use ConceptDraw MINDMAP to create a simple presentation.
Picture: Create a Basic Presentation Quickly
Related Solution:
What is a Concept Map and what software is effective for its design? A concept map or conceptual diagram is a diagram that depicts suggested relationships between concepts. As for effective software - we suggest you to pay attention for the ConceptDraw DIAGRAM diagramming and vector drawing software. Extended with Concept Maps Solution from the Diagrams Area it is a real godsend for you.
Picture: What Is a Concept Map
Related Solution:
ConceptDraw DIAGRAM is a powerful tool that helps you create professional looking cross-functional flowcharts with the well-designed objects. ConceptDraw DIAGRAM - Drawing Software for Vertical Cross Functional Flowchart. ConceptDraw allows you to focus on work, not the drawing process. ConceptDraw Arrows10 Technology allows to draw connectors with smart behavior that gives flexibility to you during work process.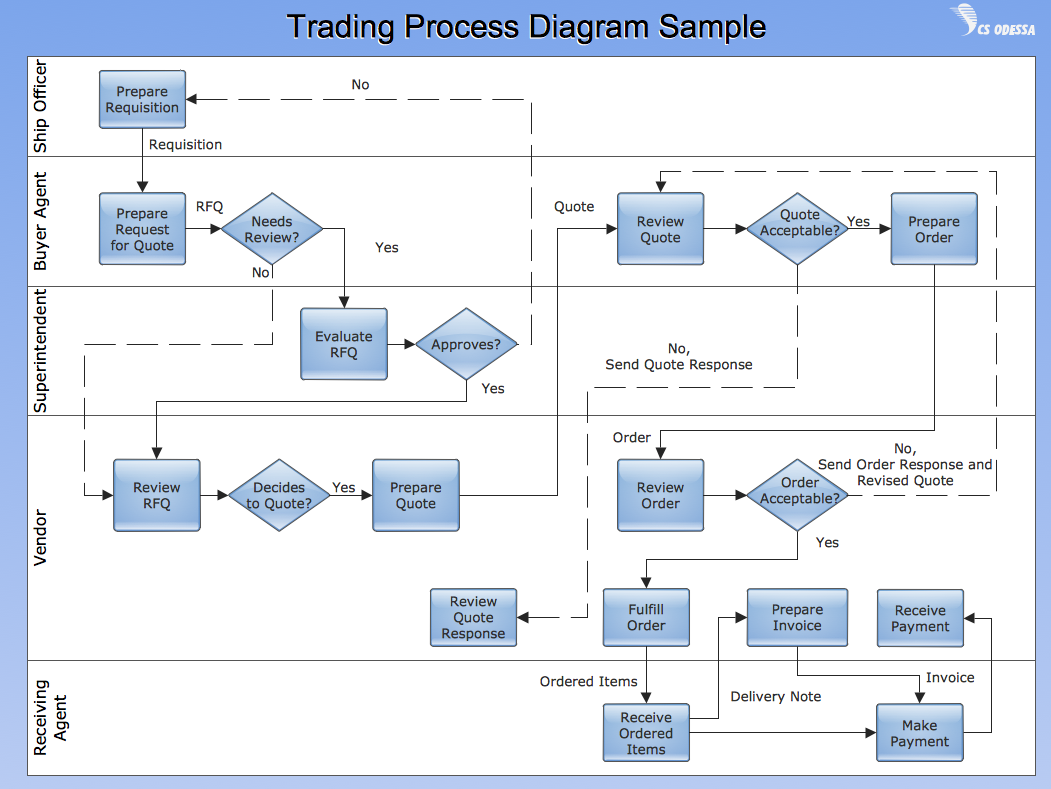
Picture: Vertical Cross Functional Flowchart
ConceptDraw DIAGRAM is the best diagramming and vector drawing software. Now, enhanced with Mechanical Engineering solution from the Engineering area of ConceptDraw Solution Park it became ideal for creating: Technical Mechanical Drawings, Mechanical Engineering Diagrams, Pneumatic Schematics, Hydraulic Schemes, etc.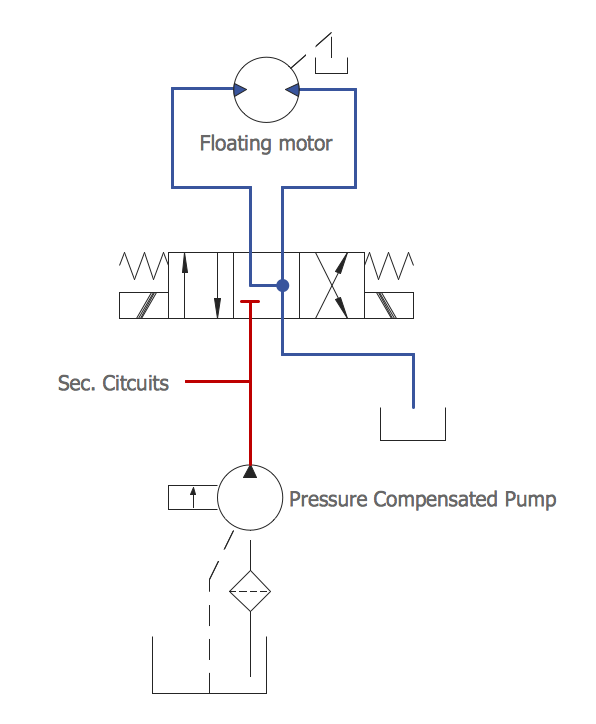
Picture: Mechanical Engineering
Related Solution:
When moving to a new apartment it is always pleasure to develop an interior design project. Nevertheless, another important part that should not be forgotten is the piping plan, because wrong piping system might ruin all the renovation. So, to avoid such problems, a stress analysis is performed.
Plumbing and piping plans should be created for any premises. They are used to trace location of pipes, fixtures and valves in the house. This diagram presents a set of certified piping plan symbols for drawing plumbing and piping floor plans, diagrams and other technical drawings. Applying standard symbols when creating a piping plan is very important for creating a valid piping plan included into the building documentation pack. It is essential for any professional to be able to read and properly interpreted any piping plan.
Picture: Interior Design. Piping Plan — Design Elements
Related Solution:
Create flowcharts, organizational charts, bar charts, line graphs, and more with ConceptDraw DIAGRAM.
Picture: Basic Diagramming
Related Solution: