Problem Analysis
Management and Planning tools
ConceptDraw OFFICE suite is a software for Problem Analysis. The Seven Management and Planning Tools are a set of such tools for investigating complex problems. These tools are exemplary at organizing research, parsing complex problems, providing a structure for the details, helping managers make decisions, and organizing effective communications in a visual manner that keeps everyone involved.
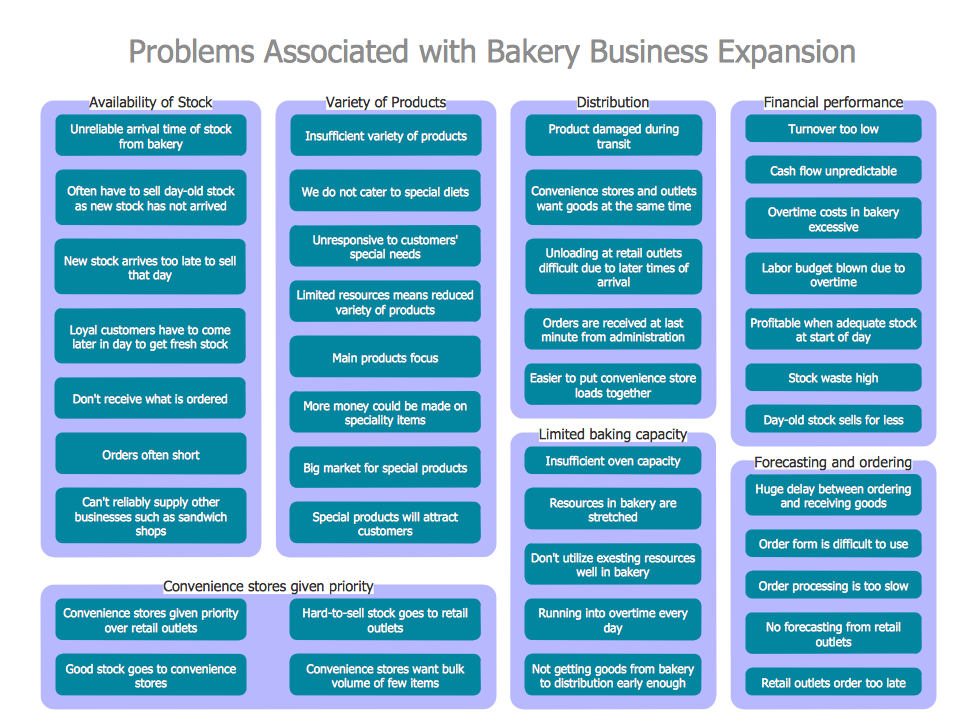
Pic.1 Problem Analysis. Affinity diagram — Business Expansion
The Affinity Diagram shows the structure of complex factors that have an influence on a problem, and then divides them up into a smaller and simpler structure. This diagram is designed to prepare the data for further analysis of the cause-effect relationships.
See also:
SEVEN RELATED HOW TO's:
Users new to ConceptDraw PROJECT will find the Basic lessons an essential platform for familiarizing themselves with the program′s functions. Learn how to assign resources to tasks in ConceptDraw PROJECT with this comprehensive video lesson.
Picture: Project — Assigning Resources
Related Solutions:
Relationships Analysis. Relations Diagram - factors analysis, factors relations. Create Relations Diagram with ConceptDraw DIAGRAM.
The Seven Management and Planning Tools is a tool for Interaction diagram drawing. This diagram identifies causal relationships. Determine what factors are causes and which factors are effects. Interaction diagram helps establish KPIs to monitor changes and the effectiveness of corrective actions in resolving the problem.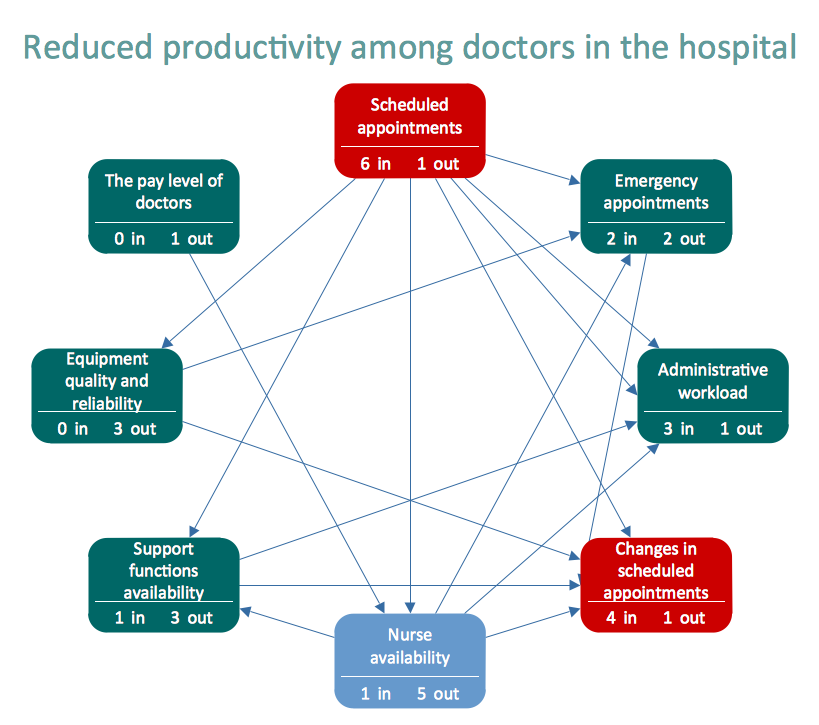
Picture: Relationships Analysis
A process flowchart is a picture of the separate steps of a process in sequential order.Use ConceptDraw DIAGRAM software and the vector stencils from object libraries are designed objects you can use adding to process flowcharts for the best result.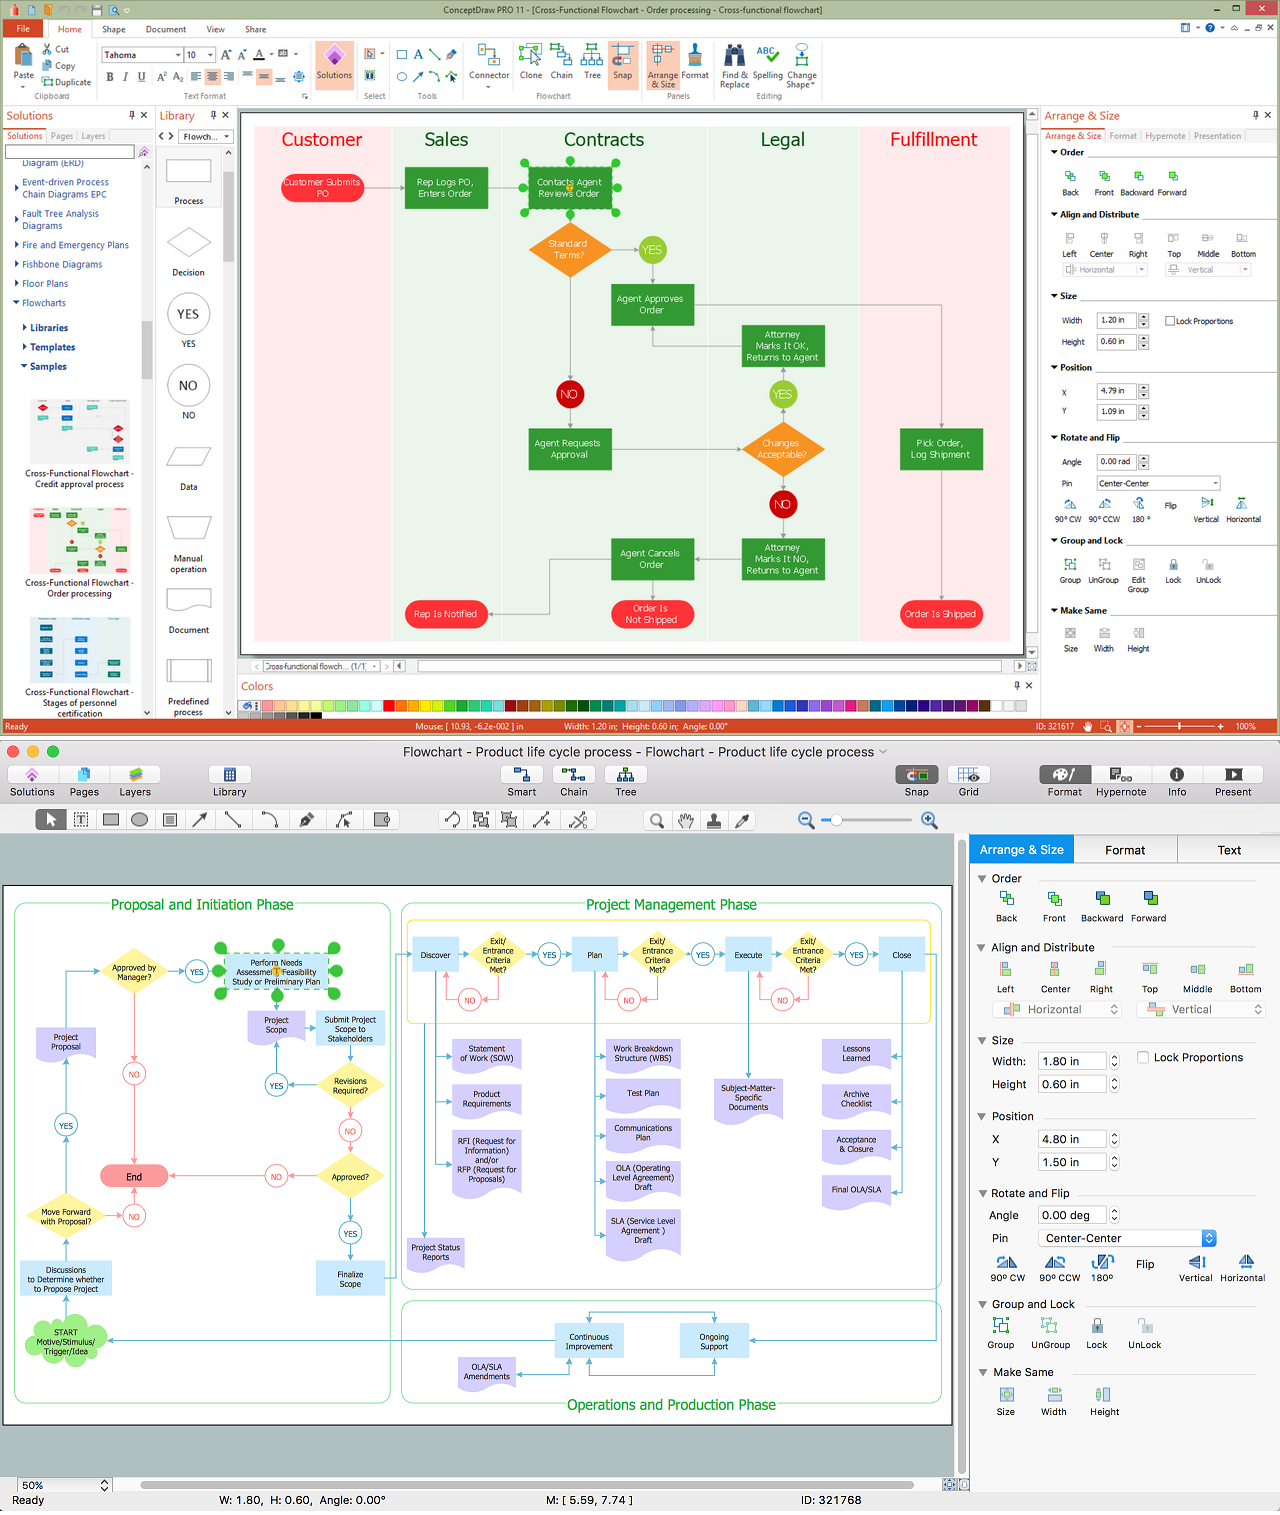
Picture: Create Process Flowcharts
Related Solution:
Identify how factors influence each other. Factors mostly influencing called “Drivers” Primarily affected factors called “Indicators”. Problem solving further focuses on changing driver factors by corrective actions. Indicator factors help establish KPI (Key Performance Indicators) to monitor changes and the effectiveness of corrective actions in resolving a problem.
Picture: Relations Diagram
Related Solution:
Use the Relations Diagram to create a relations factors map and to identify which factors are “drivers” and “indicators”. This diagram identifies causal relationships and determine what factors are causes or effects.
ConceptDraw OFFICE suite is a software for relation diagram making.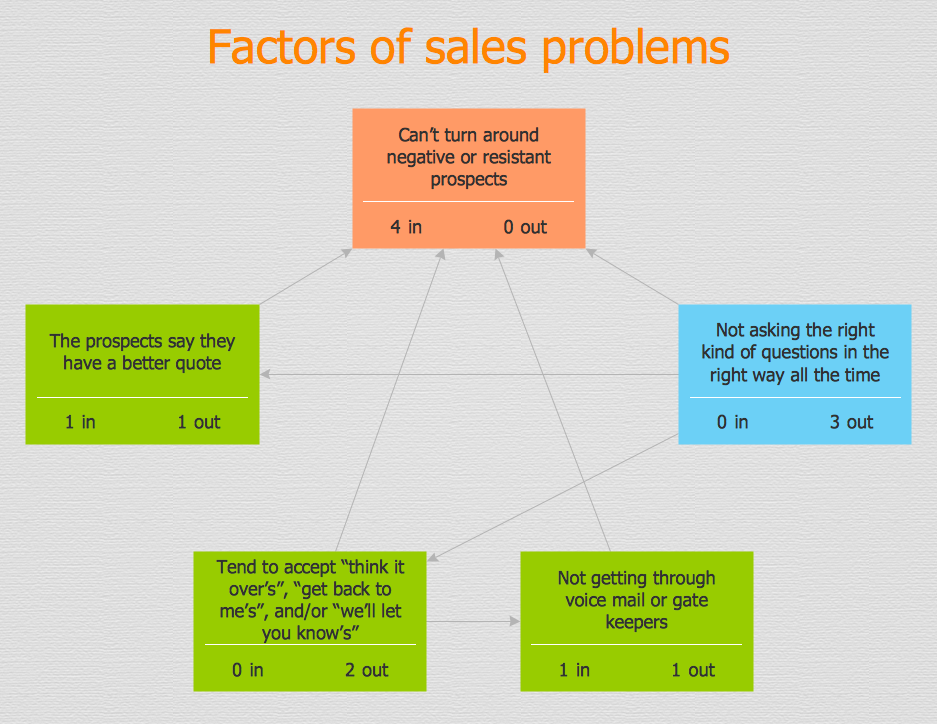
Picture: PROBLEM ANALYSIS.Relations Diagram
The innovative ConceptDraw DIAGRAM is a powerful drawing tool that changes the way diagrams are produced. While making diagrams has never been easier. This is more than enough versatility to draw any type of diagram with any degree of complexity.
Picture: Making Diagrams Has Never Been Easier
Activity Network and Project Evaluation and Review Technique, or PERT, charts are a way of documenting and analyzing the tasks in a project.
This diagram is constructed as part of the process in creating a schedule of corrective actions. The Activity Network Chart (PERT) shows the logical connections and consequence of tasks to be performed. It displays the time period for problem solving and the implementation of all activities through the critical path.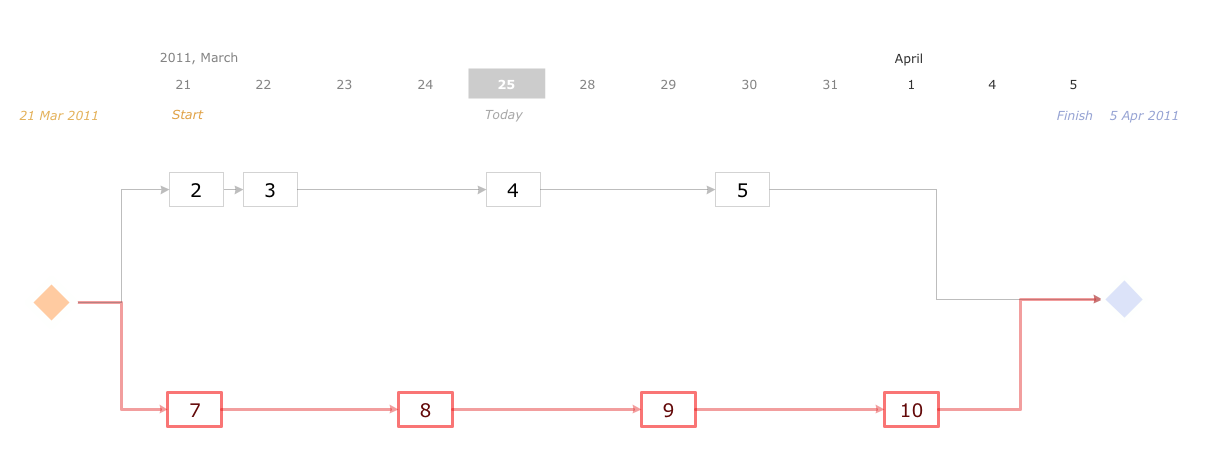
Picture: Activity Network (PERT) Chart
Related Solution:
ConceptDraw
DIAGRAM 18