CORRECTIVE ACTIONS PLANNING. Risk Diagram (PDPC)
Management and Planning tools
ConceptDraw OFFICE suite is a software for Risks Diagram making. This diagram identifies possible risks in accomplishing corrective actions.

Pic.1 Management and Planning tool
With the Risks Diagram, one analyzes each action separately in a tree of all actions and develops a preventive action in response of each potential obstacles or circumstances which may be a risk.
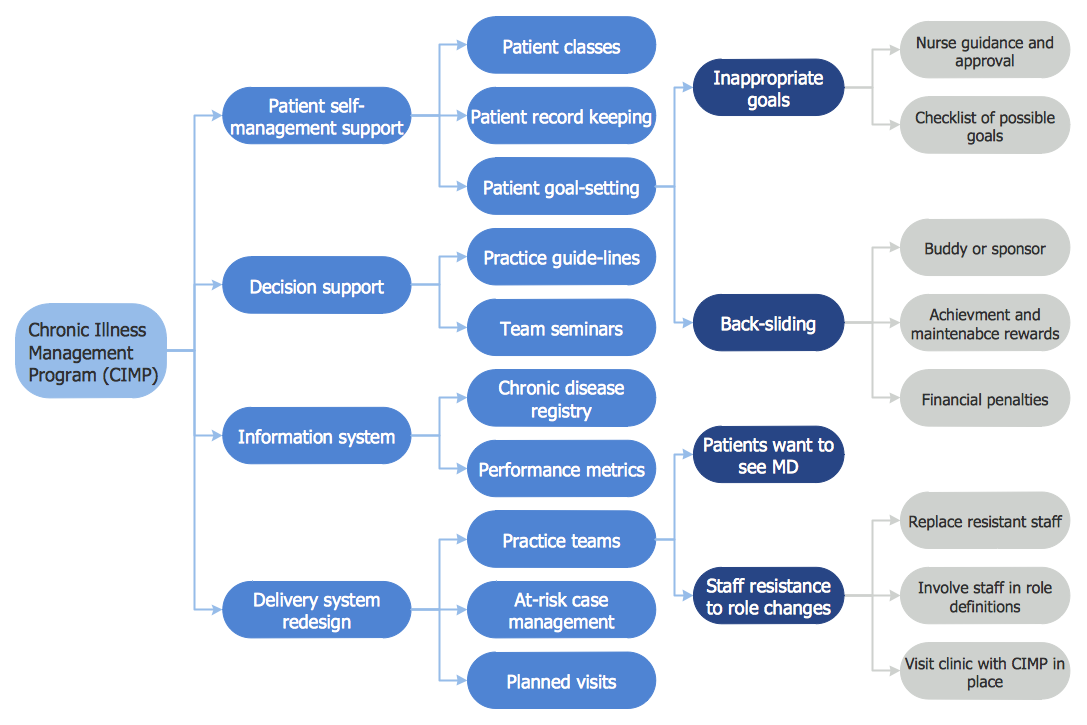
Pic.2 Risk diagram (process decision program chart, PDPC) — Health Care
The Risk diagram (Process Decision Program Chart) determines the risks when corrective action is not performed correctly. Also, it helps develop descriptions for preventive actions at the level of execution.
See also:
TEN RELATED HOW TO's:
Definition, examples, layout options, best practices, and common mistakes for cross functional flowcharts (swimlane diagrams).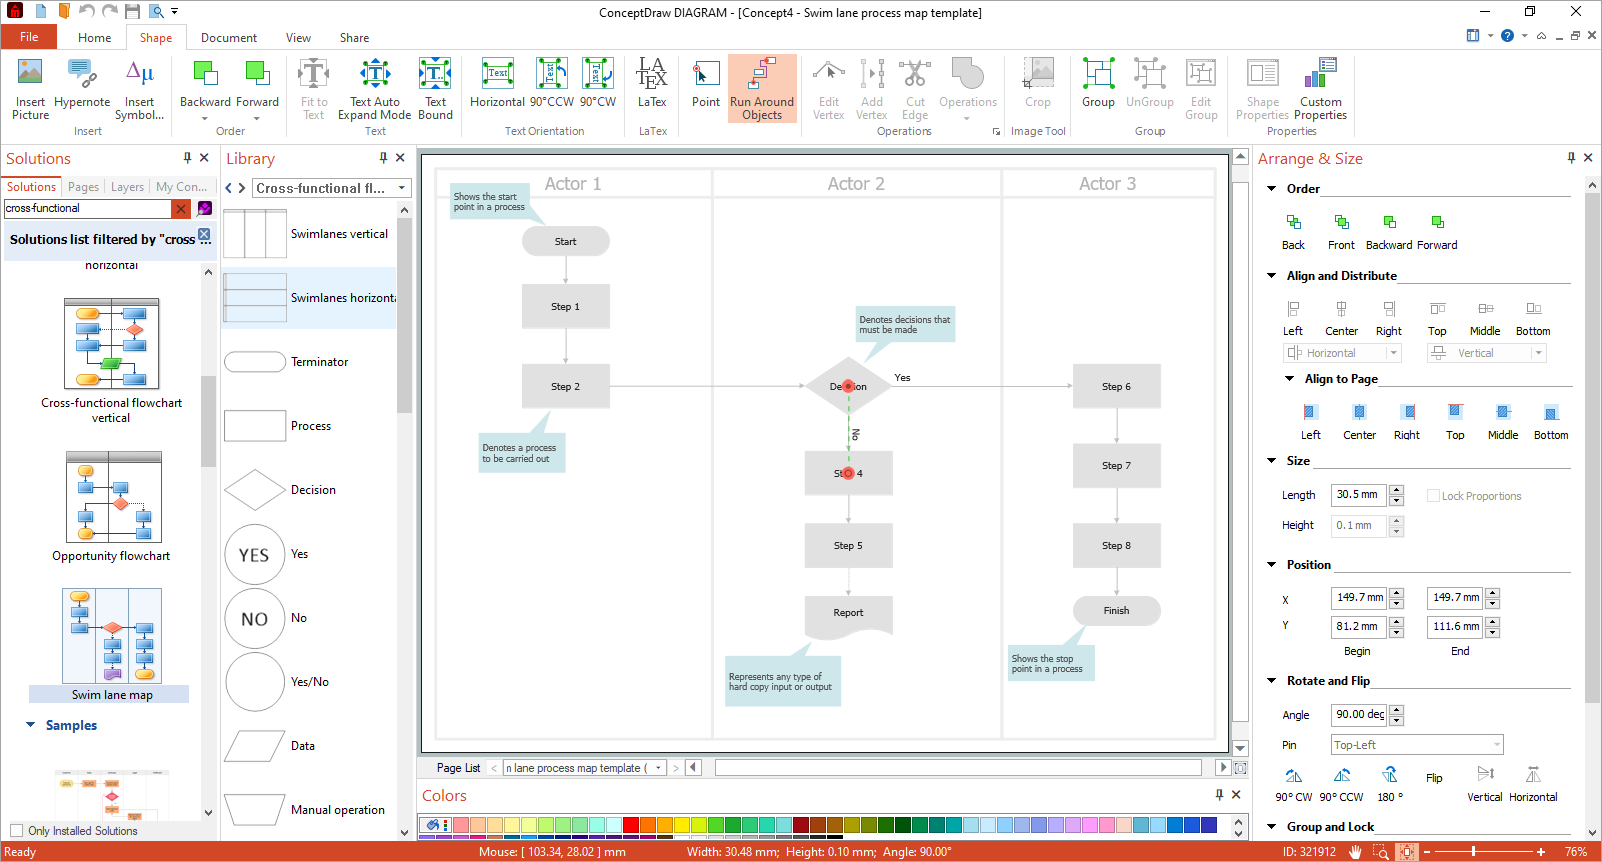
Picture: Cross Functional Flowchart
Related Solution:
Use the ConceptDraw DIAGRAM software that has vector clipart of numerous cable connectors, examples, and templates for drawing different types of audio and video connection diagrams. Paste icon of the receiver or another device to page and layout sockets and plugs. Further connect plugs with each other, and now you have well-designed connection diagram.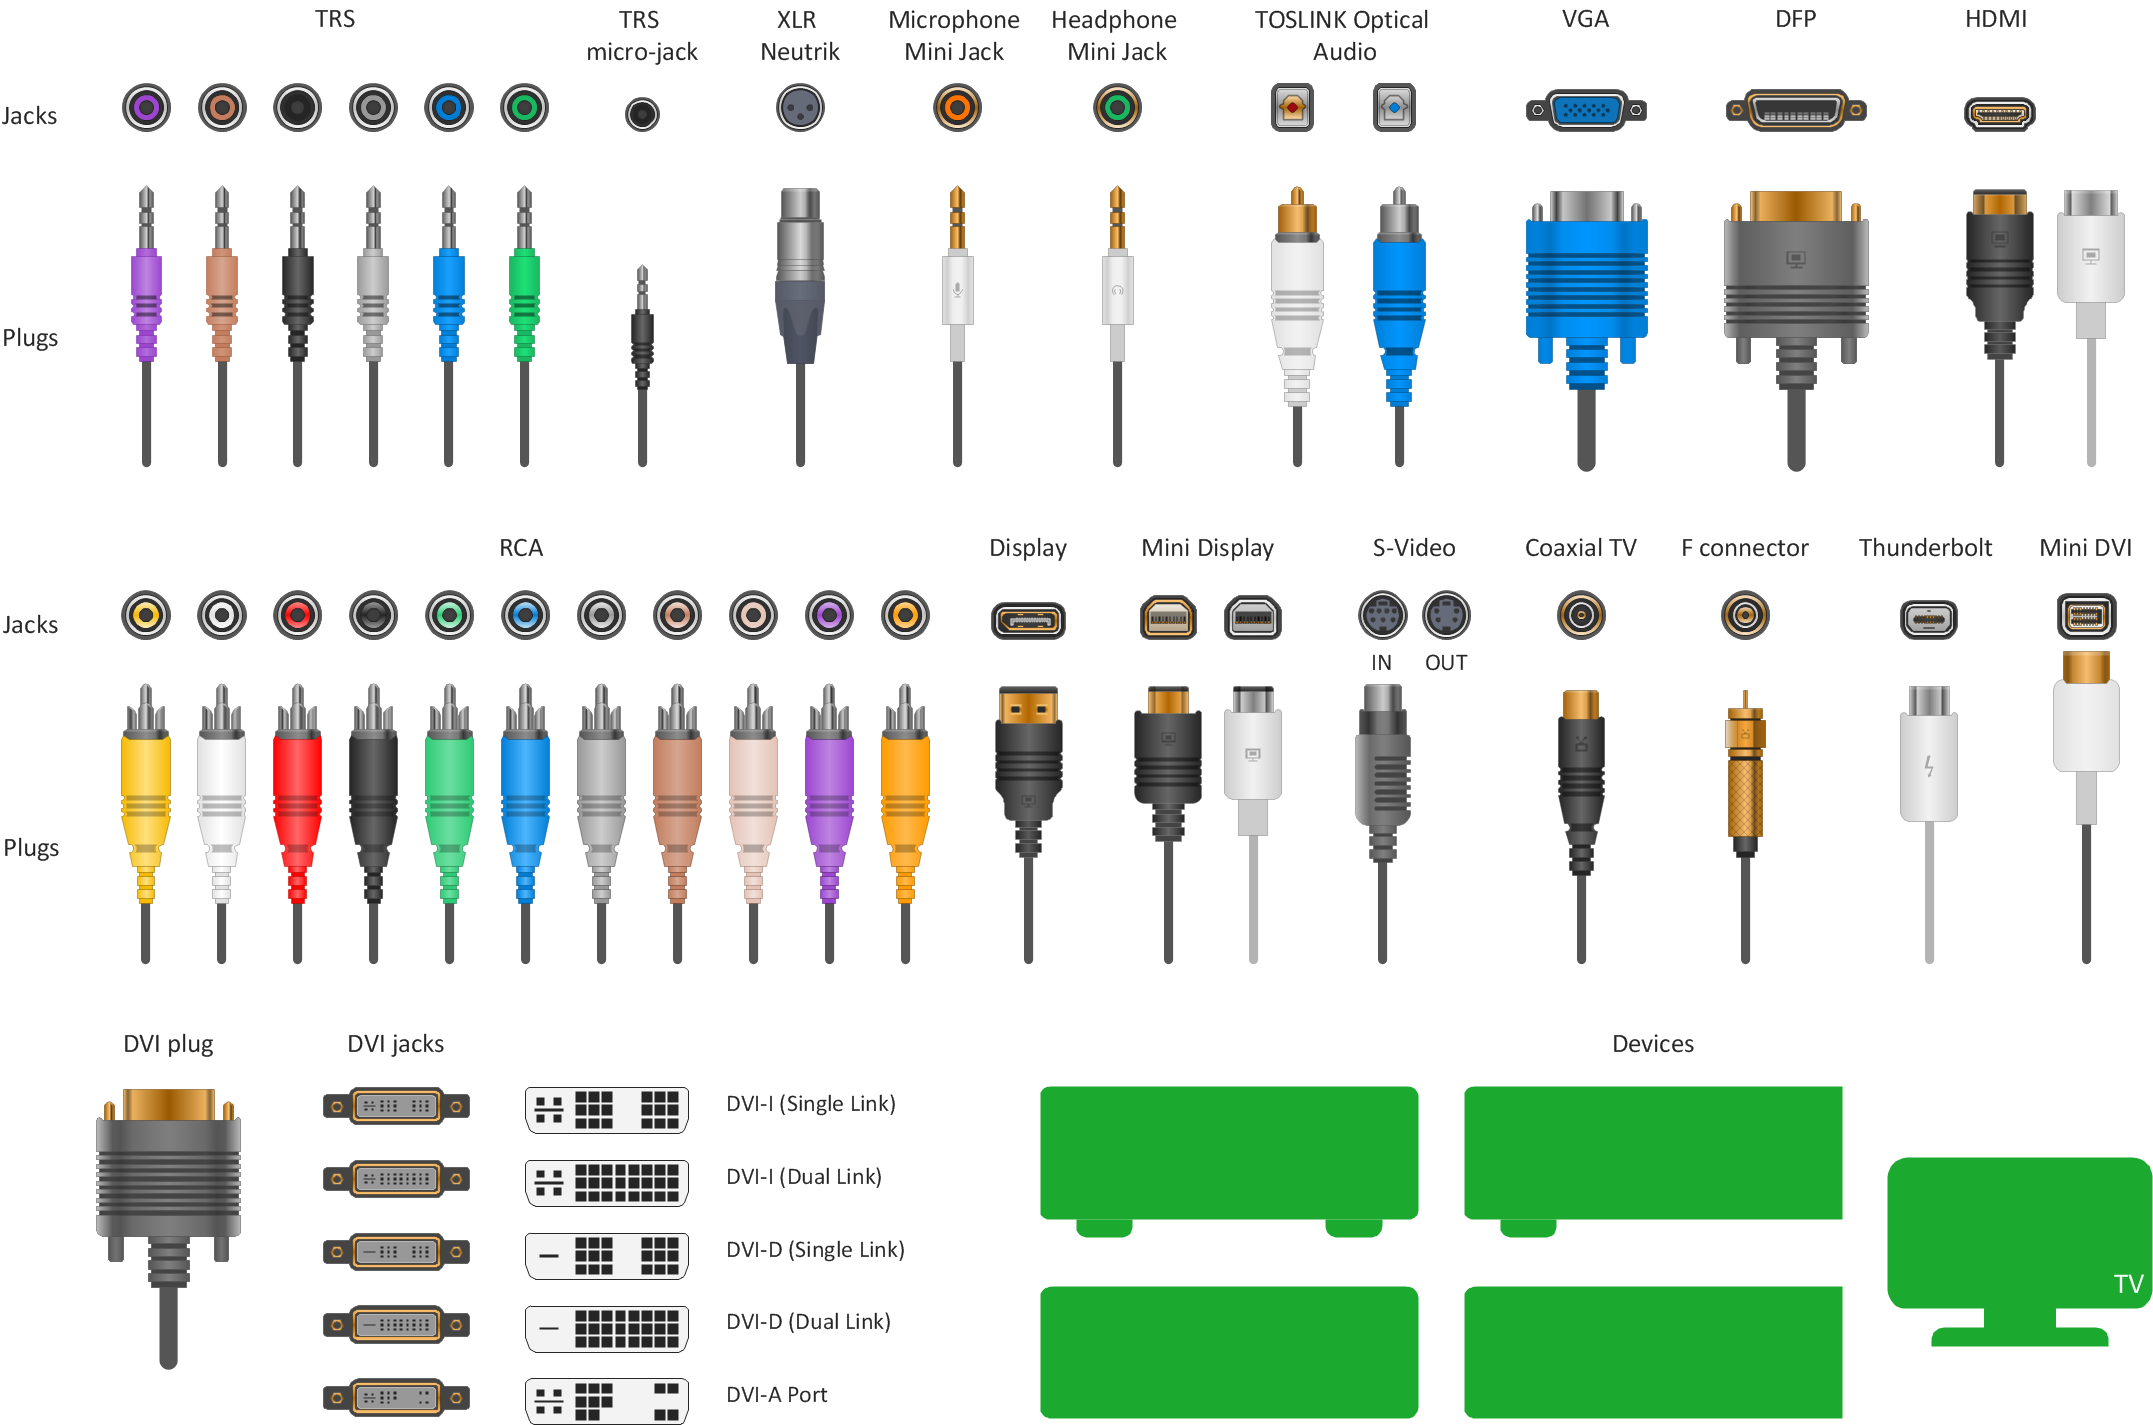
Picture: How to Make Audio and Video Connections
Related Solution:
The Total Quality Management Diagram solution helps you and your organization visualize business and industrial processes. Create Total Quality Management diagrams for business process with ConceptDraw software.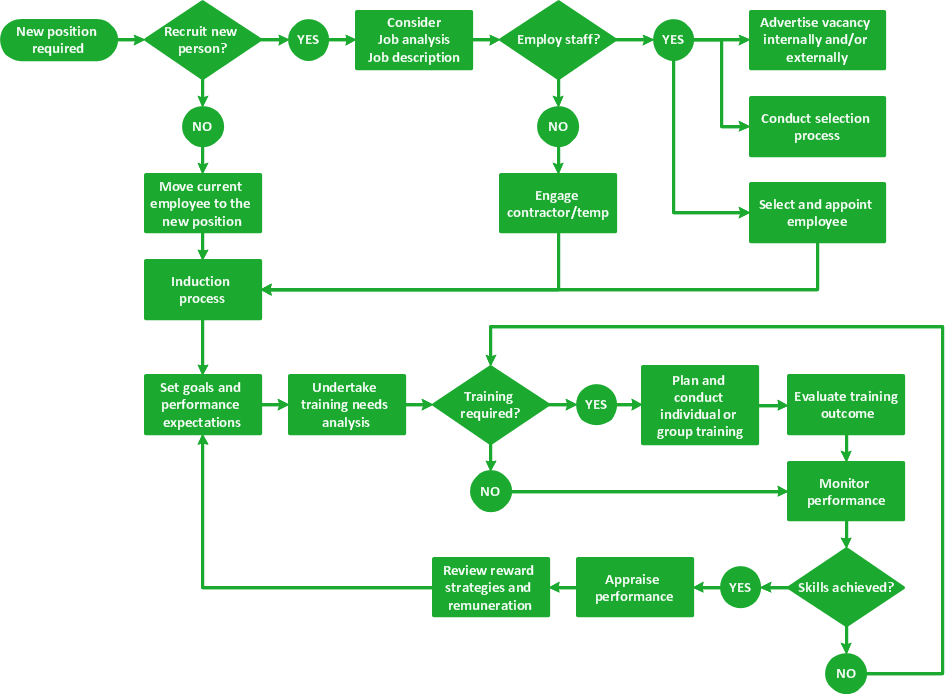
Picture: TQM Software — Build Professional TQM Diagrams
Related Solution:
Do you like the professional schemes that you can find on the Internet? Take into account that the most part of them is made using the Best Flowchart Software and Flowchart Symbols. Try you own powers in creating such diagrams!
Flowcharts are the most business diagramming tool. If you are a business manager, you can use flow chart to depict work flow in your organization, develop the effective organizational structure and present the information to investors or other stakeholders. Combining the smart management solutions with ConceptDraw DIAGRAM diagramming engine delivers the set of comprehensive flowchart tools necessary to support professionals in their creativeness and business activity.
Picture: Best Flowchart Software and Flowchart Symbols
Related Solution:
Event-Driven Process Chain Diagrams is using for improvement throughout an organisation.
ConceptDraw DIAGRAM - software that reduces the time needed to create a EPC diagrams.
Picture: The Building Blocks Used in EPC Diagrams
Related Solution:
Audit procedures are the specific tests and methods that auditor executes when gathering the evidence which are necessary for making an opinion on the financial statements of the firm. There are three types of audit procedures: data selection, reliability validation, relevance confirmation.
Thanks to the extensive drawing tools which provides the Audit Flowcharts solution from the Finance and Accounting area of ConceptDraw Solution Park, you can easy and effectively develop and realize various audit procedures.
Picture: Audit Procedures
Related Solution:
The Rapid UML Solution from the Software Development area of ConceptDraw Solution Park helps you to create the UML Class Diagrams quick and easy using ConceptDraw DIAGRAM diagramming and vector drawing software.
Picture: UML Class Diagram Tutorial
Related Solution:
Activity on Node Network Diagramming Tool - Activity Network and Project Evaluation and Review Technique, or PERT, charts are a way of documenting and analyzing the tasks in a project.
This sample shows the Activity on node network diagramming method. It was created in ConceptDraw DIAGRAM diagramming and vector drawing software using the Seven Management and Planning Tools solution from the Management area of ConceptDraw Solution Park.
Picture: Activity on Node Network Diagramming Tool
Related Solution:
Event-Driven Process chain Diagrams for improvement throughout an organisation. Best software for Process Flow Diagram. The Event-driven Process Chain (EPC) Diagrams allows managers to plan processes and resources.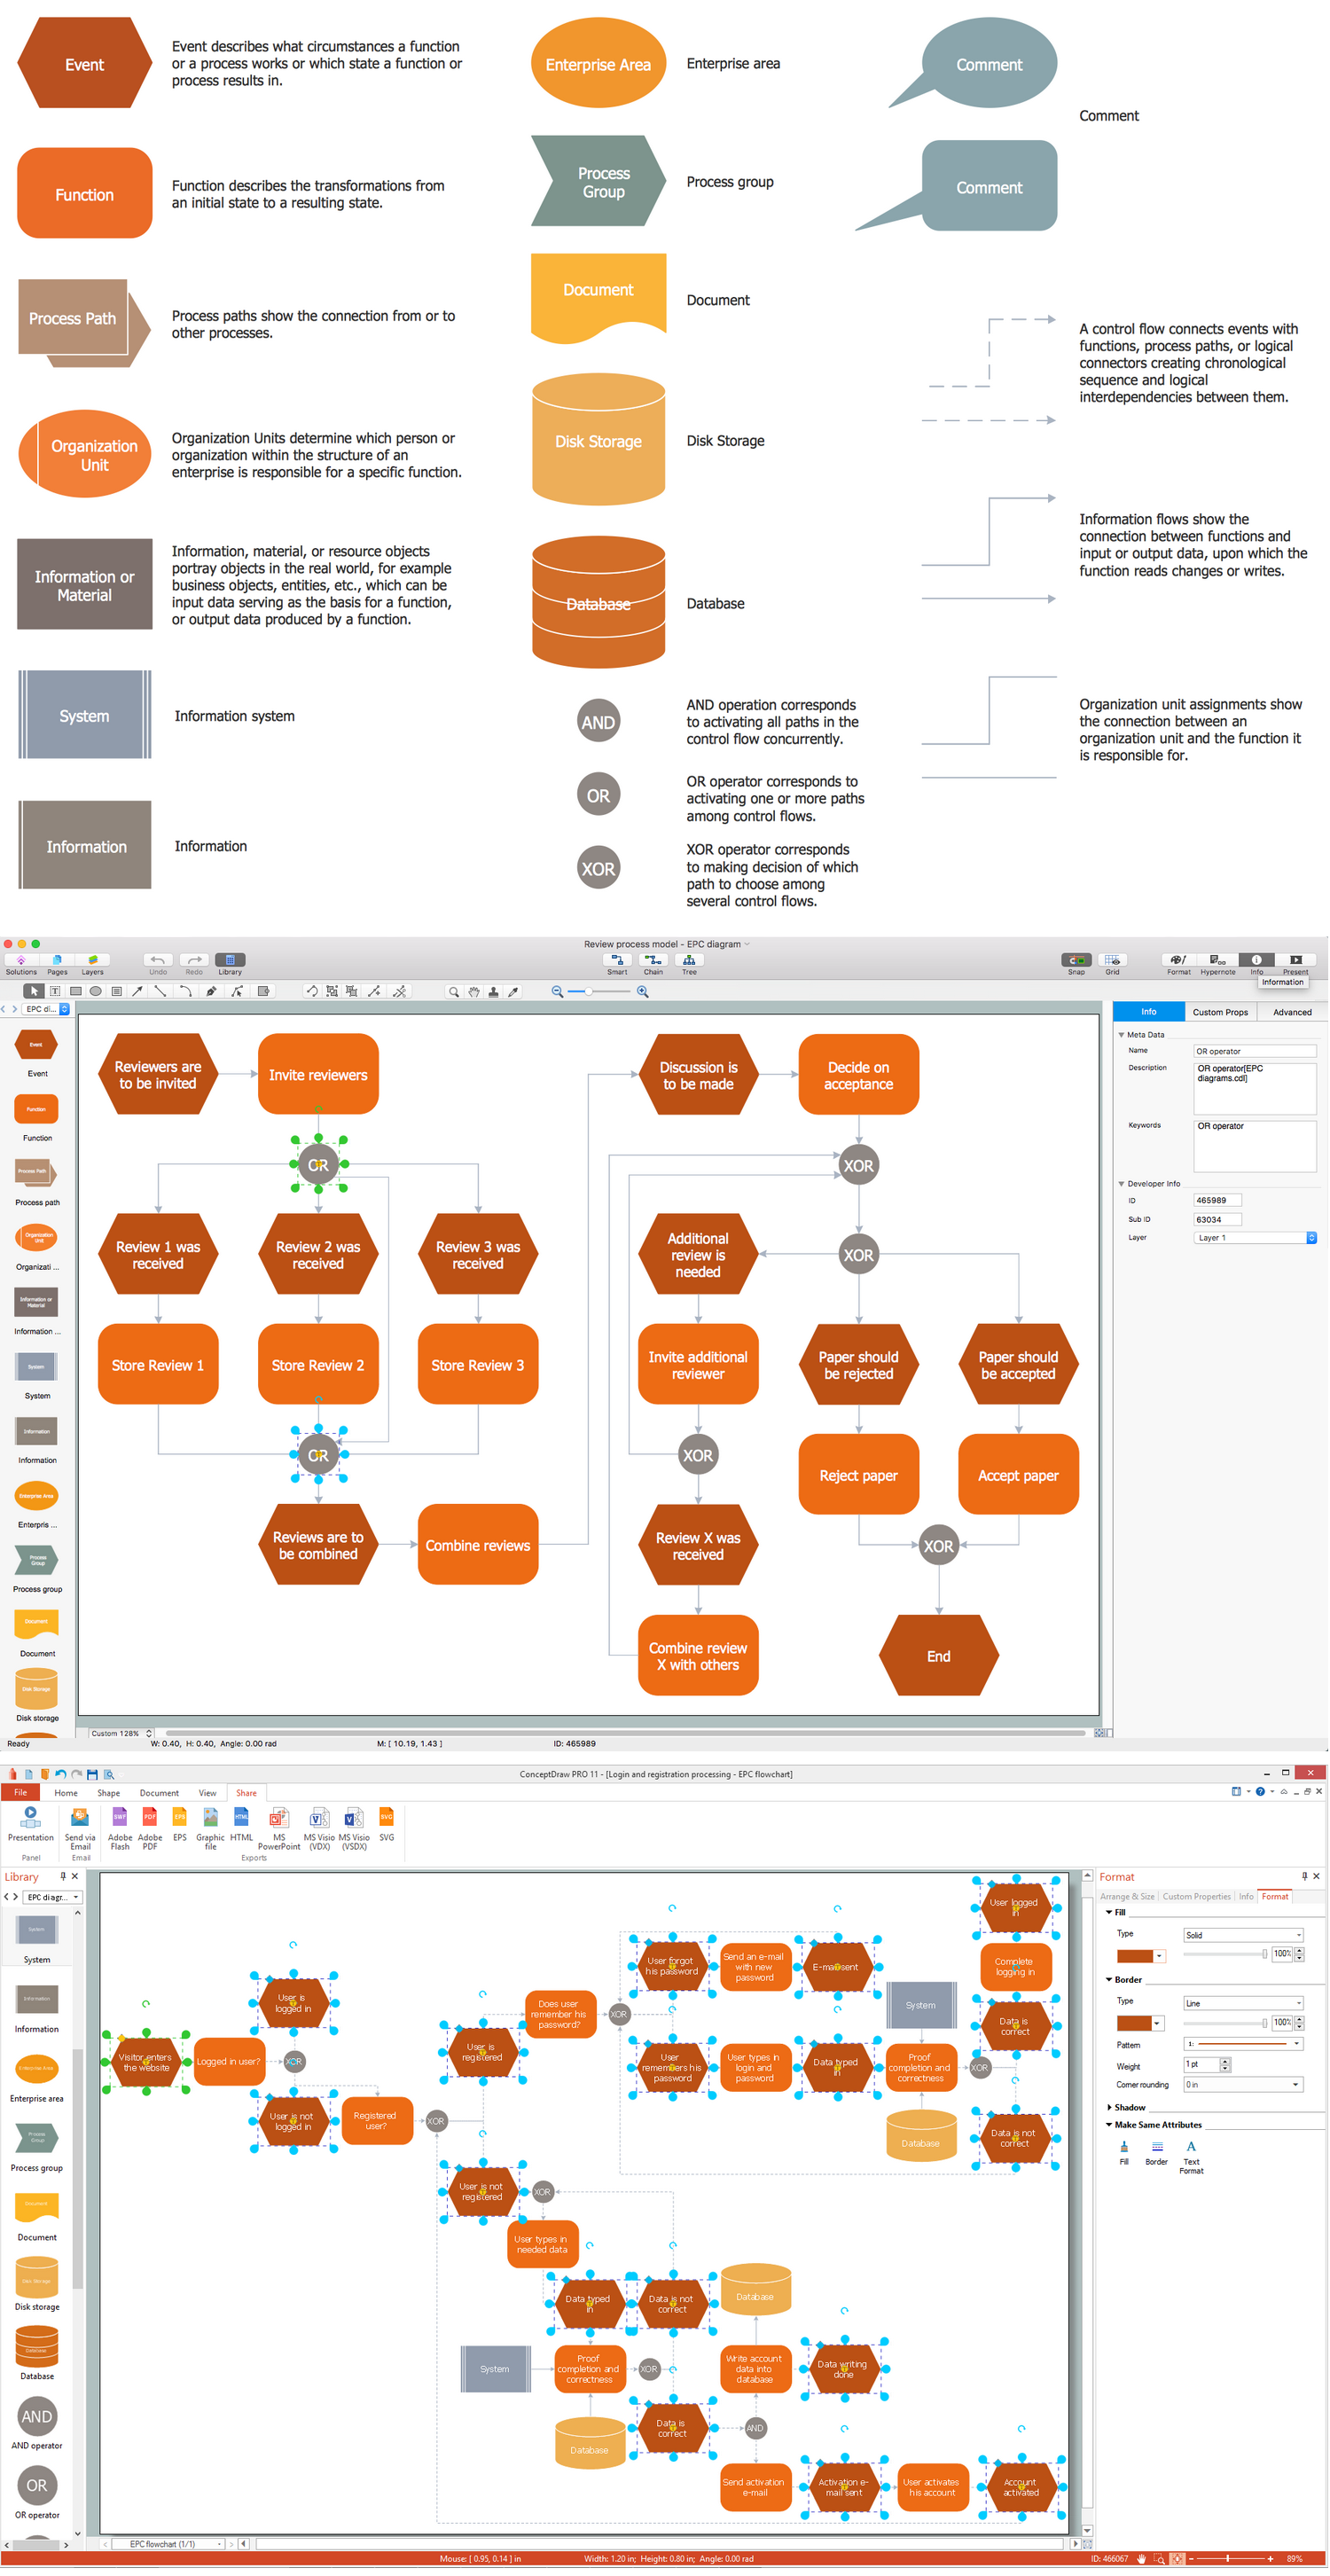
Picture: Business process Flow Chart — Event-Driven Process chain (EPC) diagrams
Related Solution:
There are many ways to define the flow of information within a system. Structured-systems analysis method often uses data flow diagrams to show data flow, data storages and data processing visualization. These diagrams are easy to develop and quite useful.
Here is a dataflow diagram presenting an example of the manufacturing process flow. The oval process shapes represent a process that controls data within the current system. The process may produce data or make some action based on data. Data flows are represented by lines. They show the movement of information through the system. The direction of the data flow is depicted by the arrow. The external entities are shown by rectangles. They represent the external entities interacting with the system. The data store objects (unclosed rectangles) are used to show data bases participating in a process flow.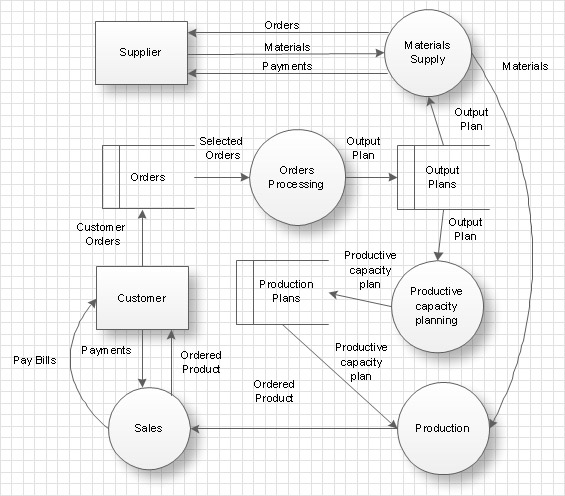
Picture: Data Flow Diagram
Related Solution:
ConceptDraw
DIAGRAM 18