Project Timeline
Project timeline is a type of chart which allows visually represent the chronology of works for the project, placing the key points of the project (milestones) on a timescale.
You need to make professional looking project timeline? Create it with ConceptDraw DIAGRAM ConceptDraw DIAGRAMextended with Timeline Diagrams Solution from the Management Area is the best timeline diagrams software.
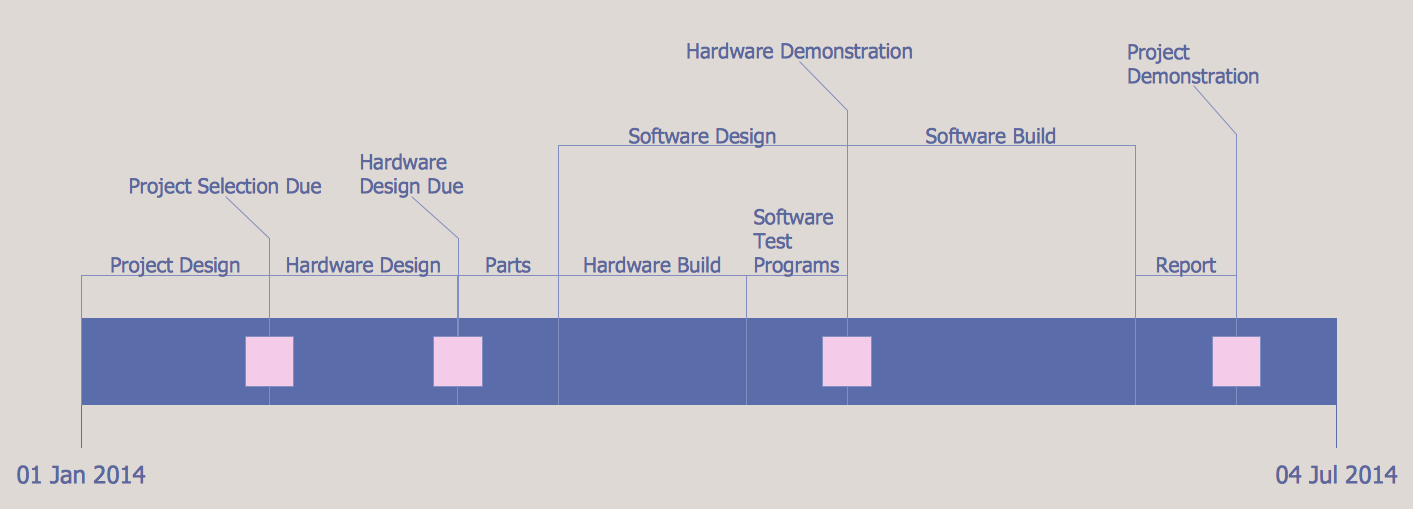
Example 1. Project Timeline
How many useful tools offers the Timeline Diagrams Solution for project timeline creating! These are extensive drawing tools, the Timelines and Milestones library with set of predesigned vector shapes, and also collection of templates and samples.

Example 2. Timeline Diagrams Solution in ConceptDraw STORE
Timeline template is an excellent start for drawing project timeline diagrams, it is convenient for use and help save your time. You can open it from ConceptDraw STORE.

Example 3. Timeline Diagram - Project Schedule
The samples you see on this page were created in ConceptDraw DIAGRAM software with help of Timeline Diagrams Solution. An experienced user spent 10 minutes creating each of these project timeline diagrams.
Use the Timeline Diagrams Solution to create your own project timeline diagram of any complexity quick, easy and effective.
All source documents are vector graphic documents. They are available for reviewing, modifying, or converting to a variety of formats (PDF file, MS PowerPoint, MS Visio, and many other graphic formats) from the ConceptDraw STORE. The Timeline Diagrams Solution is available for all ConceptDraw DIAGRAM or later users.
TEN RELATED HOW TO's:
Draw your own business process flowcharts using ConceptDraw DIAGRAM diagramming and business graphics software.
The Flowcharts Solution for ConceptDraw DIAGRAM is a comprehensive set of examples and samples in several different color themes for professionals that need to graphically represent a process.
Picture: Flow Chart Diagram Examples
Related Solution:
Use the ready-to-use predesigned objects, templates and samples from the Basic Diagramming Solution for ConceptDraw DIAGRAM you can create your own professional looking Planograms quick, easy and effective.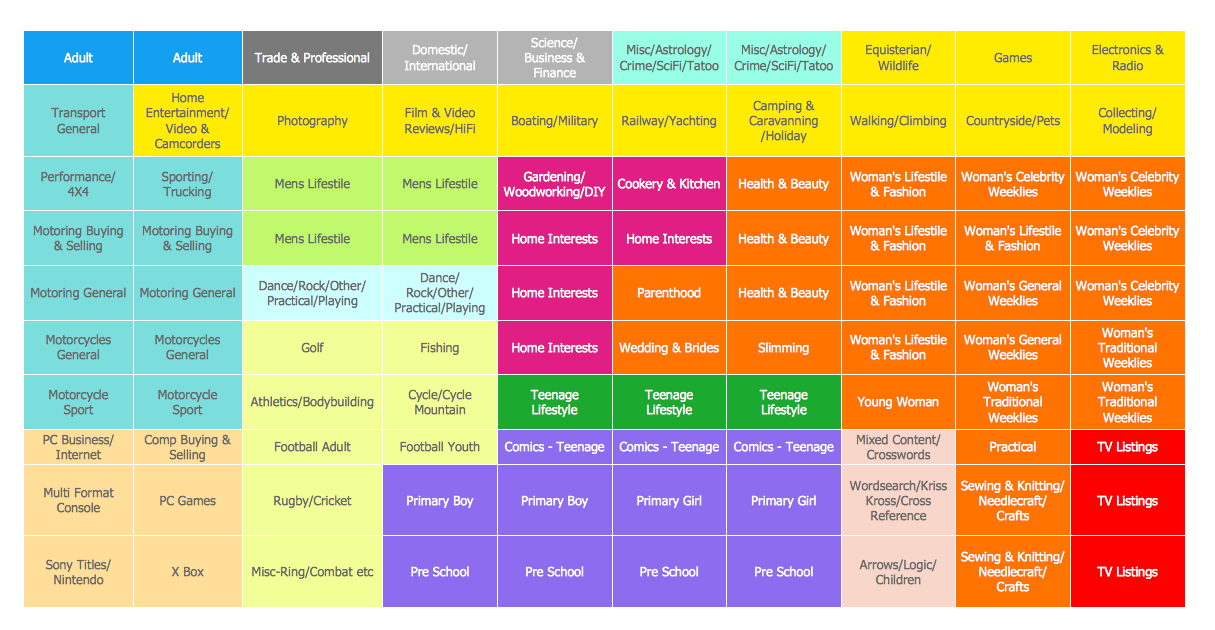
Picture: Planogram
Related Solution:
Closed-circuit television (CCTV) uses cameras and monitors to carry out video surveillance. Unlike broadcast television this system has only local signal. It is a feature of almost every video camera, yet CCTV is mainly a system for visual control of certain areas such as banks, airports, supermarkets, and other places for security reasons.
Developing and installing CCTV system is a time-consuming process. It also requires certain knowledge and skills. ConceptDraw is a solution of setting video cameras rationally. You can achieve two aims at once: CCTV Design Tool saves your time and your money and helps you make professional video surveillance system.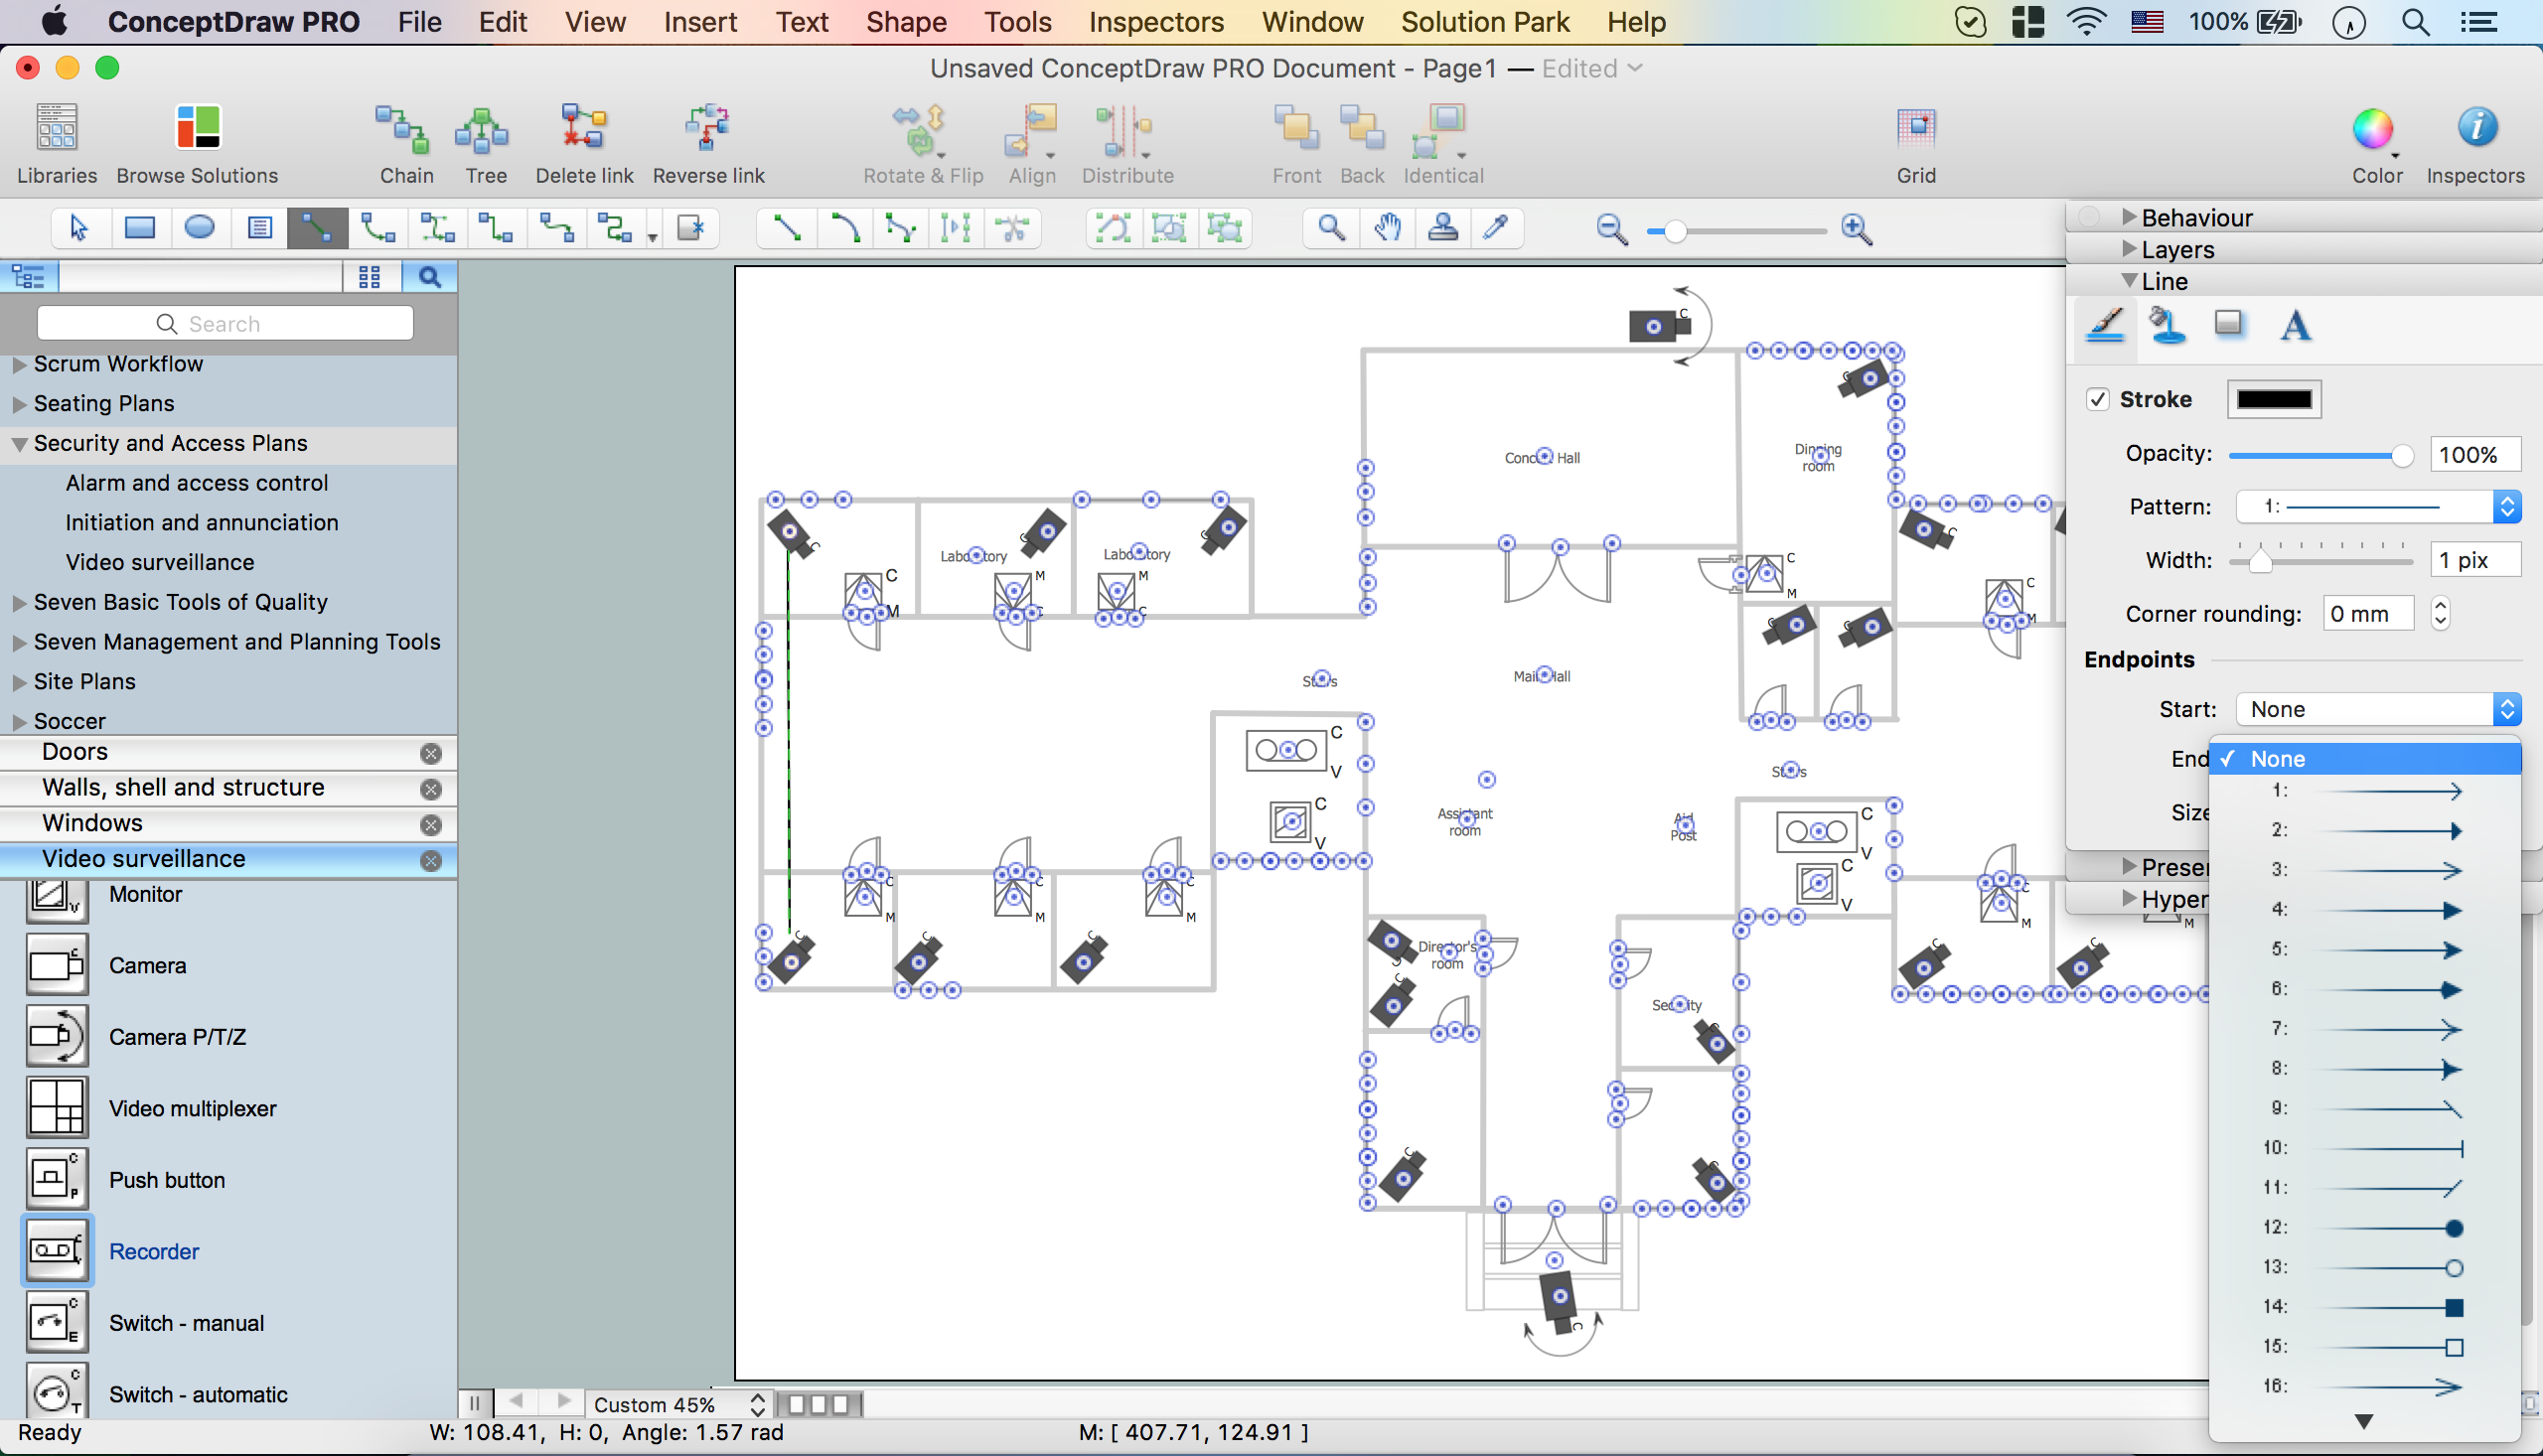
Picture: How To Create CCTV Network Diagram
Related Solutions:
You need to draw Authority Matrix Diagram quick and easy? Design it with ConceptDraw DIAGRAM!
ConceptDraw DIAGRAM extended with Seven Management and Planning Tools solution from the Management Area is the best Authority Matrix Diagram Software.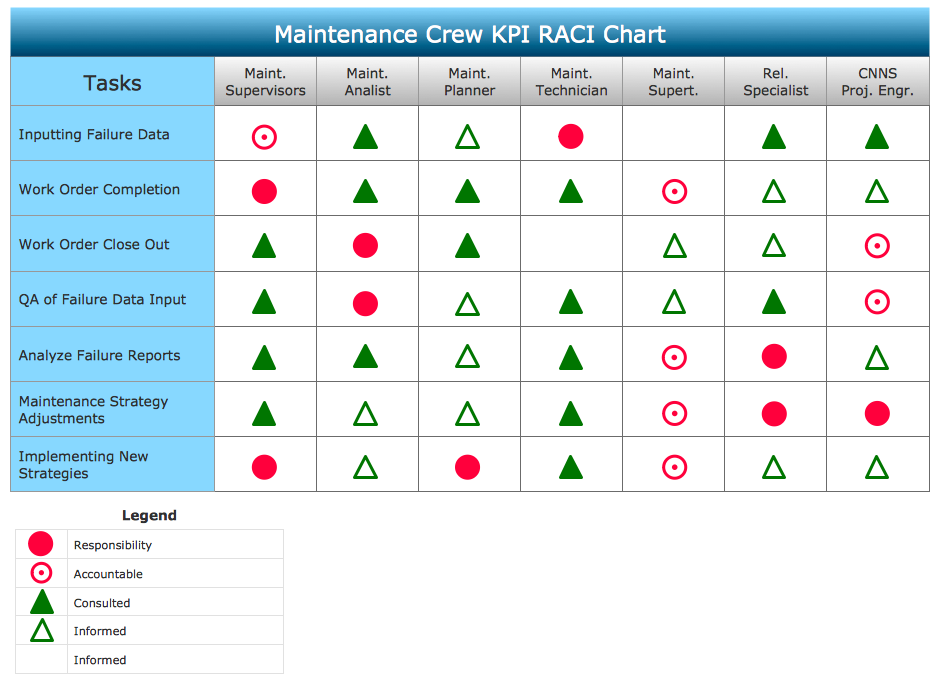
Picture: Authority Matrix Diagram Software
Related Solution:
A pie chart or a circle graph is a circular chart divided into sectors, illustrating numerical proportion. In a pie chart, the arc length of each sector and consequently its central angle and area, is proportional to the quantity it represents.
Pie chart examples and templates created using ConceptDraw DIAGRAM software helps you get closer with pie charts and find pie chart examples suite your needs.
Picture: Pie Chart Examples and Templates
Related Solution:
ConceptDraw provides some interactive xy chart and scatter graph symbols that offers advanced features yet is simple to use.
Picture: Scatter Graph Charting Software
Related Solution:
ConceptDraw DIAGRAM software extended with Workflow Diagrams solution ideally suits for effective business process optimization, for determination the opportunities for improvements and enhancements the processes, cost reduction and cost savings.
Picture: Business Process Optimization
Related Solution:

