Pyramid Diagram
Purchase Funnel Diagram
The purchase funnel is also known to be called as a “purchasing funnel”. It is simply one of the commonly used consumer focused marketing models, with the help of which it is convenient to illustrate the theoretical customer journeys towards the purchases of the services or products.
E. St. Elmo Lewis in 1898 developed a model which was known to be mapped a theoretical customer journey from the very moment when a product or a brand attracted the consumer’s attention all the way up to the point of the action or purchase itself. St. Elmo Lewis’ idea can be referred to the so-called “AIDA-model”, which is an acronym standing for “Awareness”, “Interest”, as well as “Desire” and “Action”.
There are a few stages of the mentioned process, which can be summarized and mentioned in the following order: Awareness, Interest, Desire and Action. The Awareness target the aim of the customer to be aware of the existence of a certain product or a particular service. The Interest is used for expressing an interest in a certain product group. The Desire is meant to be aspiring to a particular product or brand. And Action is the one taking the steps towards the final stage of purchasing the chosen product.
The Purchase Funnel can be also known as the “marketing funnel,” the “sales funnel”, the "conversion funnel" or the “customer funnel”. The well-known association of the funnel model created with taking the AIDA concept into consideration, was proposed for the first time in the so-called “Bond Salesmanship” article written in 1924 by William W. Townsend.
The mentioned early model was modified by different marketing consultants as well as academics in order to cater to the modern customer. Nowadays it can be referred to the purchase funnel or so-called “buying funnel” in marketing. There are very many different “business-to-consumer purchase models”, which are widely used existing in marketing today. In general, it is accepted that the modern business-to-business purchase funnel has more stages, considering the so-called “repurchase intent” as well as taking into account all the new technologies and the changes in the consumer purchasing behaviour.
The buying funnel has been validated as a model in a variety of domains, such as keyword advertising, lead generation, searching, etc. It was also modified for being able to include all the previously unconsidered metrics and steps, such as the internet impressions and the outbound sales.
The concept of the purchase funnel is widely and commonly used for guiding the promotional campaigns in marketing for targeting different stages of the customers’ journeys. It is also world-widely used as a basis for the so called “customer relationship management programmes”, or “CRM programmes”, leading the management campaigns.
A so called “conversion funnel” is also widely used, almost as much as a purchase one, being a technical term, commonly used in e-commerce operations for describing the track the consumers takes through different Internet search systems or advertisings. With help of such funnel it is simpler to navigate the e-commerce websites and so converting to a sale.
The funnel diagrams are also known as “funnel charts”, being the types of chart, often used for representing the stages in a sales process. With help of such funnel diagram it is possible to show the amount of all the potential revenue for each of the stages of the process of purchasing. The mentioned type of diagram can also be very useful for identifying the potential problems in some organization’s sales process.
A funnel diagram is known to be similar to a so called “stacked percent bar chart”, displaying the values in a way of the progressively decreasing proportions amounting up to 100% in total. The size of the area can be determined by the series value in a way of a percentage of the total value. Any funnel is expected to consist of the higher part- the base, sometimes also called the “head”. At the same time the lower part is referred to the term of a “neck”.
The funnel diagram is the one showing a process starting at 100% and ending with a lower percentage. It happens where it is noticeable in what exactly stages the fall out happens as well as at what rate. If the diagram is also combined with the research data, it becomes obvious how many items have been lost at each of the steps of the order or sales process. In this case the funnel diagram illustrates where exactly the biggest bottlenecks are on the scale of the process.
Unlike a real funnel, everything that is known to be so called "poured in" at the top does not flow all the way through to the bottom. Thus, the name is known to only be referred to the shape of the chart, confirming its illustrative purpose. An example of the order funnel diagram can be the one with the initiated orders on the very top of it going all the way down to the bottom where the orders are delivered for satisfying the customers, showing how many there are still left in the process and so the percentage of the returned and cancelled.
Example 1. Pyramid Diagram Solution in ConceptDraw STORE
To be able to create the mentioned diagram you can always use a very convenient and professional tool — the ConceptDraw DIAGRAM software. The mentioned application is the one offering a huge range of the the-made graphic elements, such as the design symbols for adding them to your drawings. Another product of CS Odessa, which can be also used for making the purchase funnel diagrams, is a ConceptDraw STORE — the application which includes the so called “solutions”, such as a Pyramid Diagrams solution in particular, for making different diagrams, including the purchase funnel ones.

Example 2. Pyramid Diagram. Purchase funnel diagram
Having the mentioned applications downloaded to your computer means having enough tools for making the great looking drawings, such as diagrams. Once you start using ConceptDraw DIAGRAM you will realise how much simpler it is in use to compare to the other applications as you will always have an opportunity to get the pre-made examples, such as those from the Pyramid Diagrams Solution, to use them as your drafts to make your own smart and professionally looking purchase funnel diagrams be editing the existing.
TEN RELATED HOW TO's:
It doesn’t matter what kind of business you have, a bar or a gym, there are common concepts for any of them. One of those concepts is accounting, and to facilitate the work with the figures, you can use accounting flowchart symbols and create a clear and representative scheme. You can create flowchart for auditing, tax accounting and even for planning your own budget.
A graphical tool for displaying successive processes is flowchart. This method is mostly suited to represent an accounting process. The sequence of steps in the accounting process usually consists of standard accounting procedures, that can be depicted by using a minimal number of symbols, applied for the basic flowcharting. The advanced opportunity to create professional Accounting Flow charts is provided by ConceptDraw Accounting Flowcharts solution. It includes contains a library of accounting flowchart symbols used when drawing the accounting process flow.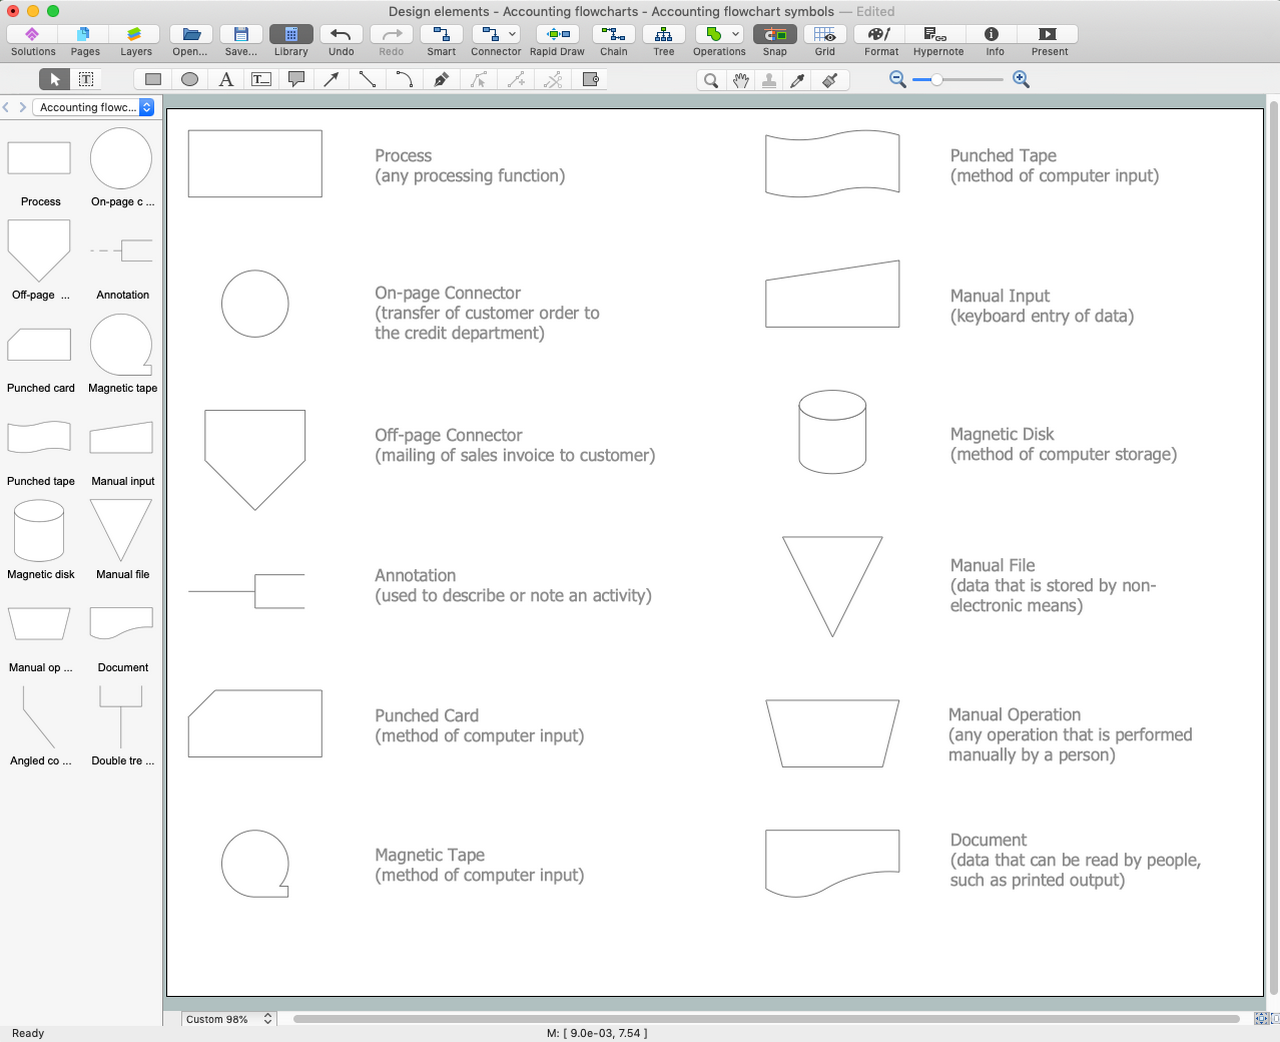
Picture: Accounting Flowchart Symbols
Related Solution:
Funnel diagram can be also known as a funnel chart being similar to a stacked percent bar chart. This drawing is a type of chart that can be often used in order to represent the stages in some sales process. It can be also used for showing the amount of potential revenue for each of the described stages.
In order to make a funnel diagram, the Funnel Diagrams solution can be used while working in the ConceptDraw DIAGRAM diagramming and drawing software. Having the pre-made design elements as well as the examples of funnel diagrams, the Funnel Diagrams solution allows any ConceptDraw DIAGRAM user to make their own unique as well as professionally-looking drawings.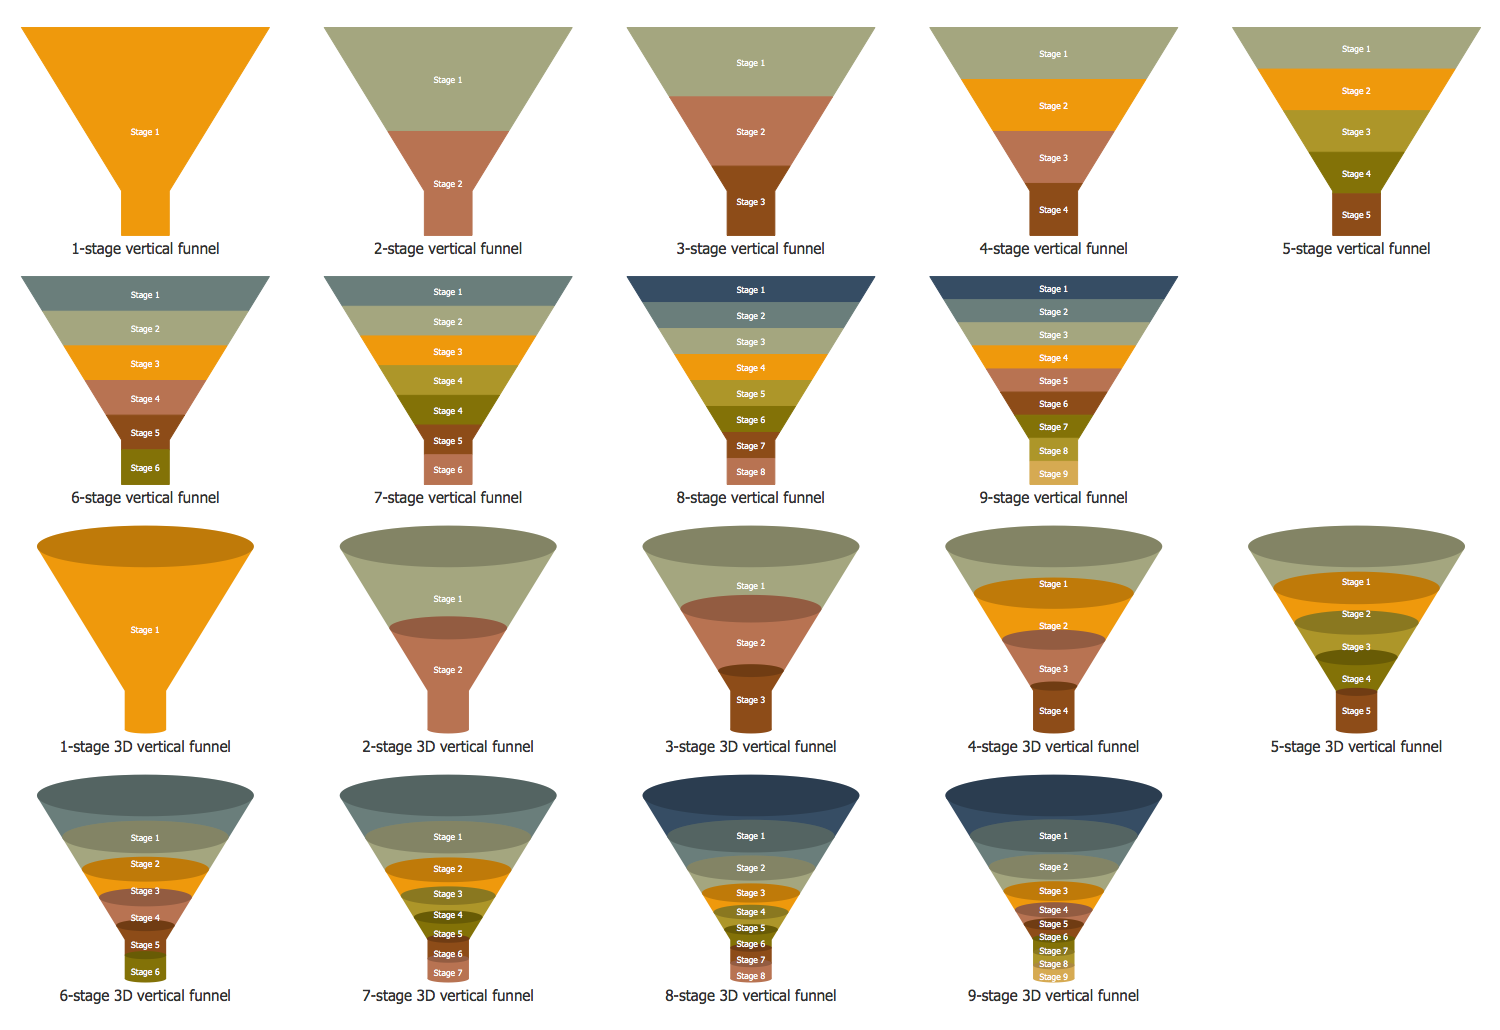
Picture: Funnel Diagram
When we think of an hierarchy, we intuitively imagine a pyramid. Thus, a lot of management tools use pyramid charts as examples or illustrations of various documents or models. You can create any type of triangle diagram using ConceptDraw DIAGRAM.
A triangle (pyramid) diagram is often used in marketing to show the data hierarchy. This pyramid diagram represents the Top Brand Model. It illustrate the model of rebranding strategy. It can be used by marketing agency dealing with rebranding strategies development. It’s critical for marketing diagrams to be both clear and eye catching. ConceptDraw Pyramid diagrams solution meet all these requirements and can be successfully applied for creating and presenting various marketing pyramidal diagrams.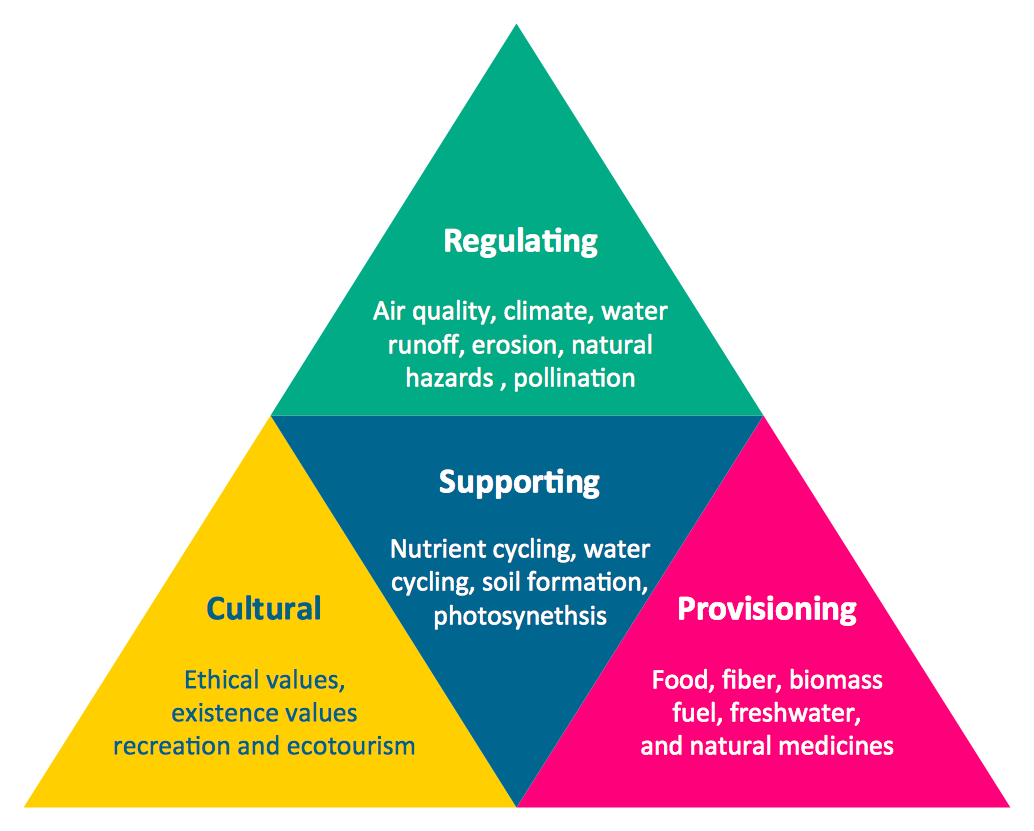
Picture: Pyramid Chart Examples
Related Solutions:
When trying to figure out the nature of the problems occurring within a project, there are many ways to develop such understanding. One of the most common ways to document processes for further improvement is to draw a process flowchart, which depicts the activities of the process arranged in sequential order — this is business process management. ConceptDraw DIAGRAM is business process mapping software with impressive range of productivity features for business process management and classic project management. This business process management software is helpful for many purposes from different payment processes, or manufacturing processes to chemical processes. Business process mapping flowcharts helps clarify the actual workflow of different people engaged in the same process. This samples were made with ConceptDraw DIAGRAM — business process mapping software for flowcharting and used as classic visio alternative because its briefly named "visio for mac" and for windows, this sort of software named the business process management tools.
This flowchart diagram shows a process flow of project management. The diagram that is presented here depicts the project life cycle that is basic for the most of project management methods. Breaking a project into phases allows to track it in the proper manner. Through separation on phases, the total workflow of a project is divided into some foreseeable components, thus making it easier to follow the project status. A project life cycle commonly includes: initiation, definition, design, development and implementation phases. Distinguished method to show parallel and interdependent processes, as well as project life cycle relationships. A flowchart diagram is often used as visual guide to project. For instance, it used by marketing project management software for visualizing stages of marketing activities or as project management workflow tools. Created with ConceptDraw DIAGRAM — business process mapping software which is flowcharting visio alternative or shortly its visio for mac, this sort of software platform often named the business process management tools.
Picture: Process Flowchart: A Step-by-Step Comprehensive Guide
Related Solution:
Structured-systems analysis and design method uses data flow diagrams to represent the process of data flowing through a system. Talking about this might be useless without a proper example of DFD for online store (Data Flow Diagram). This DFD example shows all the distinctness that a diagram can bring into a scattered data structure.
Data flow diagrams are used to show how data is processed within some business processes. Making DFD is a common practice for business process modeling and analysis. This diagram represents the online store business flow. It describes inputs and outputs within online selling process and depicts the interactions between its participants. This DF diagram can be used by system analysts to create an overview of a business, to study and discover its inherent strengths and weak points.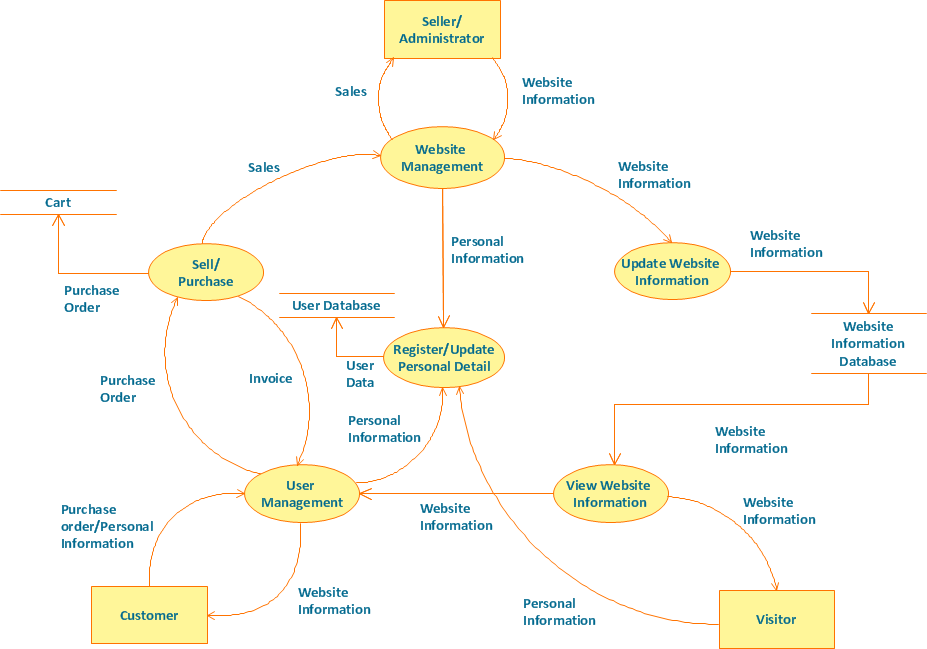
Picture: Example of DFD for Online Store (Data Flow Diagram)
Related Solution:
Create your own flow charts of purchasing business processes using the ConceptDraw DIAGRAM software
Picture:
Purchasing Flowchart - Purchase Order
Flowchart Examples
Related Solution:
The purchase or purchasing funnel is a consumer focused marketing model which illustrates the theoretical customer journey towards the purchase of a product or service.Picture: Pyramid Diagram
Related Solution:
ConceptDraw Sales Dashboard gives you a clear insight about potential opportunities and key sales operations. Analysing sales KPI is a proven way to see how your business can improve.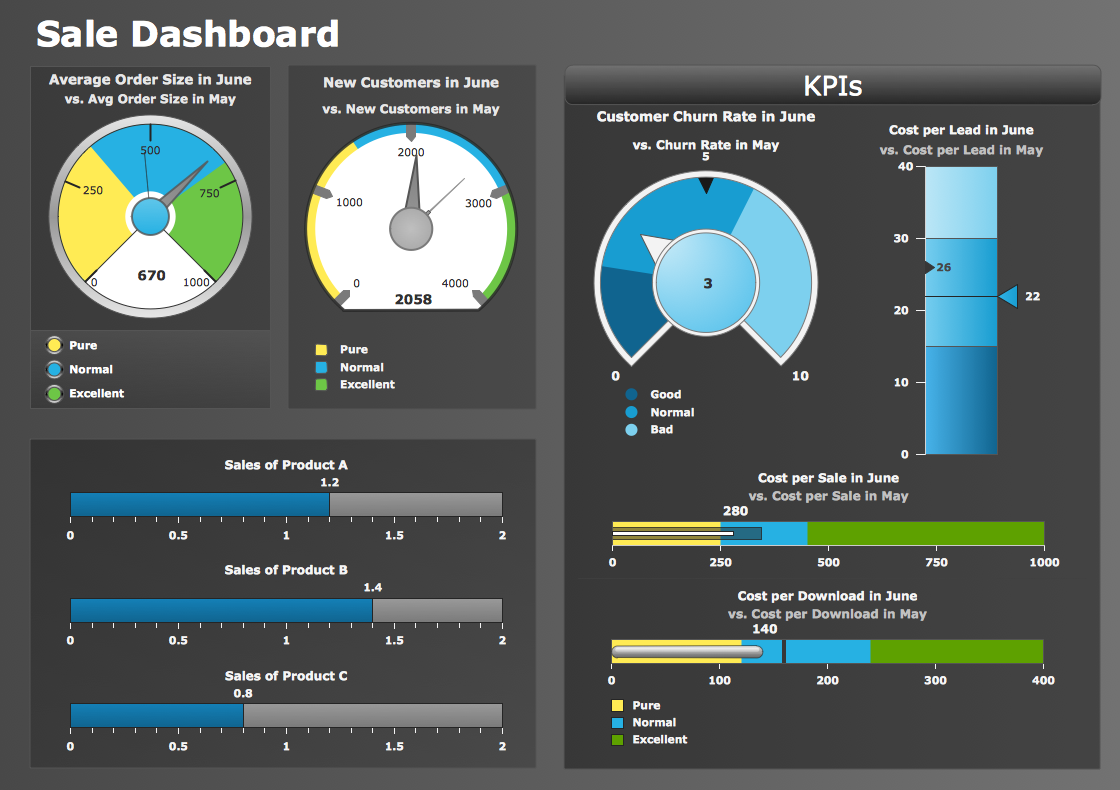
Picture: Sales Dashboard - insight about potential opportunities and key sales operations
While creating flowcharts and process flow diagrams, you should use special objects to define different statements, so anyone aware of flowcharts can get your scheme right. There is a short and an extended list of basic flowchart symbols and their meaning. Basic flowchart symbols include terminator objects, rectangles for describing steps of a process, diamonds representing appearing conditions and questions and parallelograms to show incoming data.
This diagram gives a general review of the standard symbols that are used when creating flowcharts and process flow diagrams. The practice of using a set of standard flowchart symbols was admitted in order to make flowcharts and other process flow diagrams created by any person properly understandable by other people. The flowchart symbols depict different kinds of actions and phases in a process. The sequence of the actions, and the relationships between them are shown by special lines and arrows. There are a large number of flowchart symbols. Which of them can be used in the particular diagram depends on its type. For instance, some symbols used in data flow diagrams usually are not used in the process flowcharts. Business process system use exactly these flowchart symbols.
Picture: Flowchart Symbols: Meaning and Examples
Related Solution:
Making a chart such as a funnel one may be a challenge for those who do not have as much experience in creating it. For this reason, as well as for time-saving sake, the Funnel Diagrams solution was introduced in order to simplify any ConceptDraw DIAGRAM user’s process of creating the funnel charts. This Funnel Diagrams solution includes the pre-made design elements in the stencil libraries and the templates of such charts.
Picture: Funnel Chart
