Purchasing Flowchart - Purchase OrderFlowchart Examples
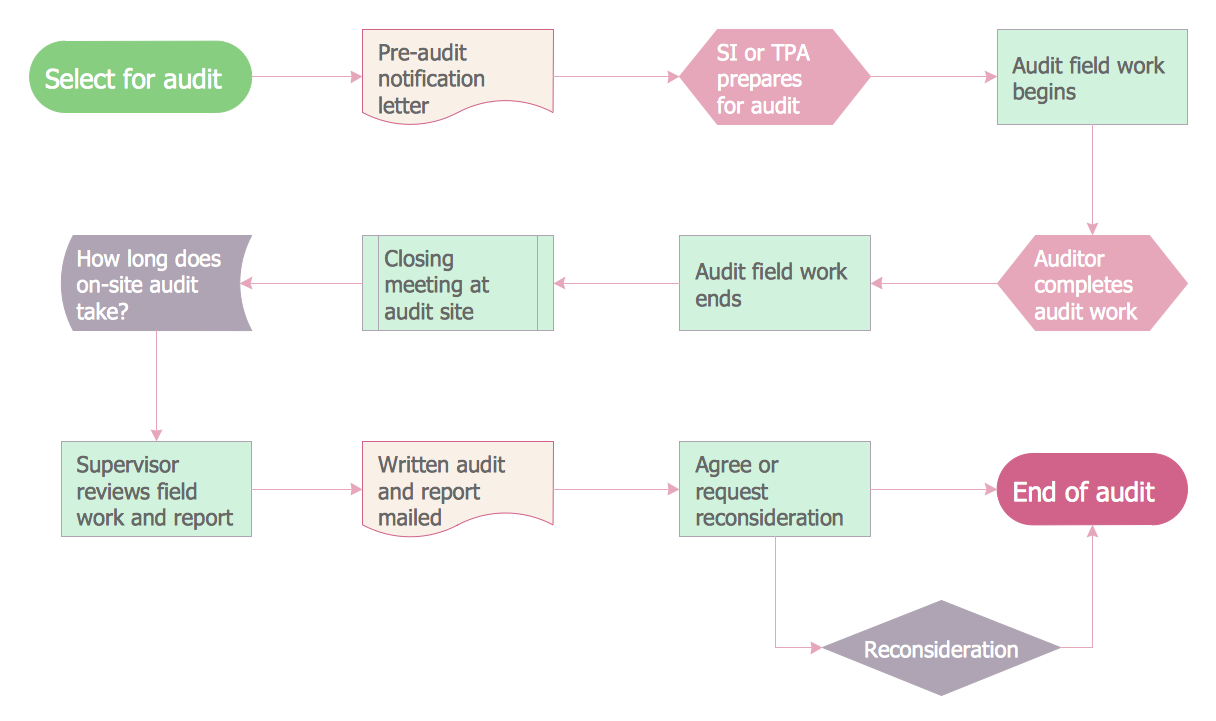
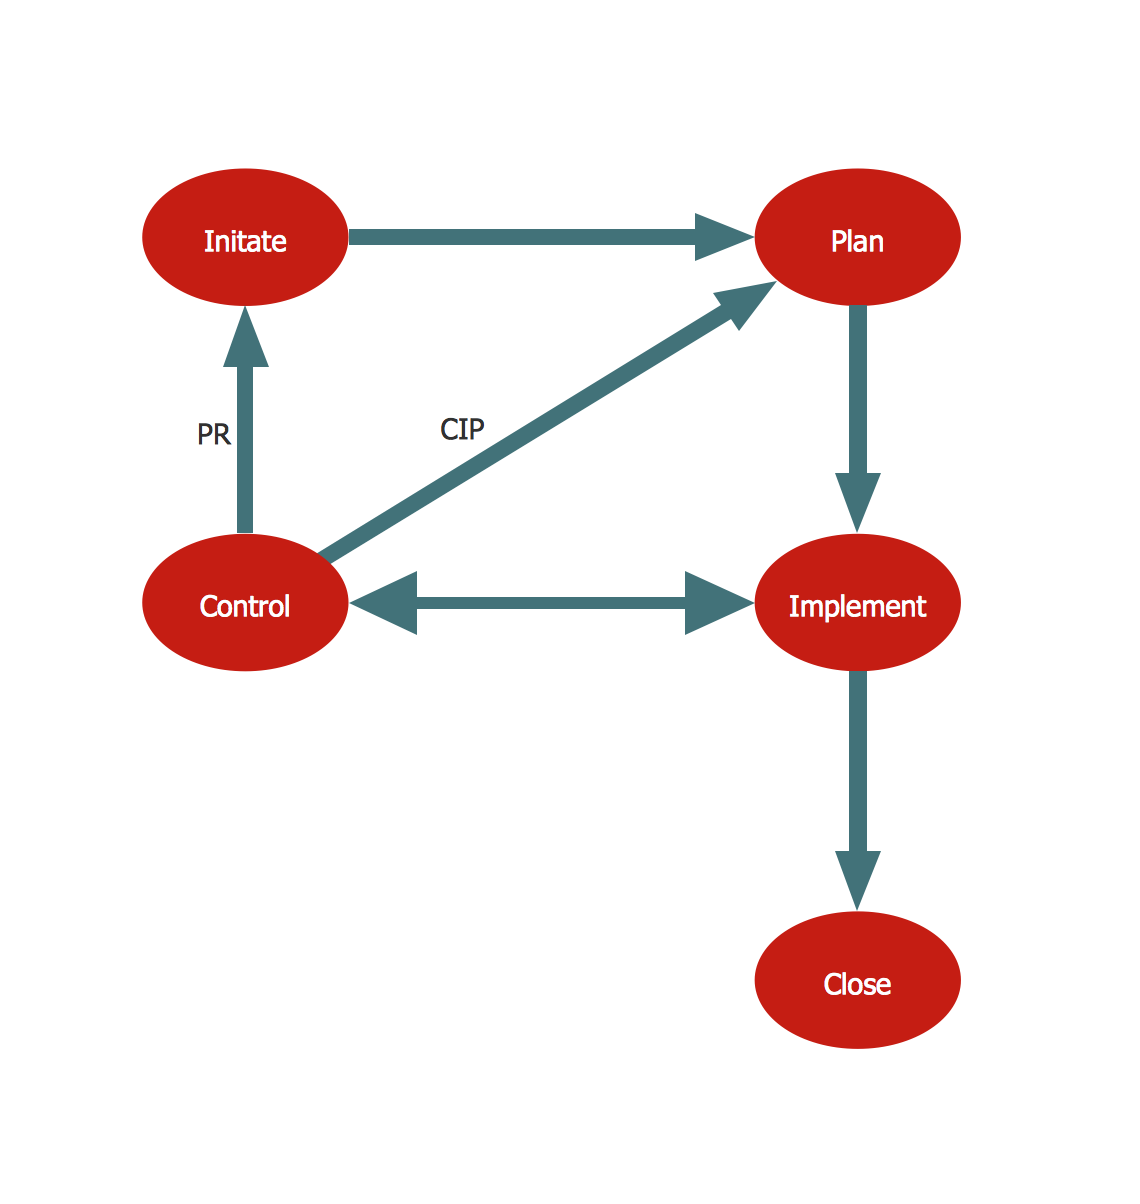
Create your own flow charts of purchasing business processes using the ConceptDraw DIAGRAM diagramming and vector drawing software extended with the Accounting Flowcharts solution from the Finance and Accounting area of ConceptDraw Solution Park.
Example 1. Purchasing Flowchart examples
The formal process of acquiring different goods and services for money is known as purchasing, which can vary from one organization to another having some common key elements. This process is known to be started with some requirements or a demand, which can be a service or an inventory, or simply a physical part. A requisition is generated with the details of the requirements sometimes providing a detailed requirements specification. The well-known “request for proposal” (also called “request for quotation”) is raised on the second stage of this process. After, the suppliers send their quotations in response to the “request for quotation”, mentioned above, and a review is undertaken where the best (in terms of price, quality and other main features) offer can be given the so-called “purchase order”.
The mentioned “purchase orders” can be very different. Thus, they can be commonly known, called “standard”, characterizing the “one time buy”, which means they are meant to happen once with no intention of buying this particular product later again. The “planned” order is simply an agreement on a specific item at an approximate date and the “blanket” is also an agreement, but based on the specific terms and conditions when no date, no quantity and no amount are specified. These “purchase orders” are usually accompanied by the “terms and conditions”, forming the contractual agreement of the transaction.
After signing these terms and conditions, the supplier can deliver the products (or service) and the customer has to record this delivery. Although, in some cases this stage goes through the so-called “goods inspection process”. An invoice has to be sent by the supplier to the client, cross-checking with the purchase order and documents, which specify which of the goods were received. After the payment is made, the goods get transferred to the supplier.
The consumer may purchase for the consumption by themselves, driving the economy through the purchase of its products, so the economy becomes dependent on them. Wholesalers, retailers and agents come under the category of “supplier” providing their channels of distribution to their consumers. The purchaser may be buying the raw materials in order to convert the purchased material into his own product or finished goods. The government institutions as well as the government agencies are very important in such processes as they purchase in bulk for using the raw materials and the finished goods for the public utilities.
The “purchase-to-pay” process is also known to be called as a “req to cheque”. It refers to the business processes which cover the activities of paying for, purchasing, requesting, accounting for and receiving different goods and services. The “purchase-to-pay” systems referred to before automate the full purchase-to-payment process, creating invoices for operations as well as connecting procurement through an intertwined business flow which automates the process from identification of a need. Within this process there are the processes of planning as well as budgeting take place all the way through to payment and procurement.
The key benefits are increased procurement and financial efficiency, visibility, cost savings as well as control. The automation of such processes allows reducing the processing time, so the incoming invoices are handled without any manual intervention, but the computer systems. These purchase-to-pay systems are developed to provide organizations the visibility and control over the entire lifecycle of a “transaction”. The transaction appears once an item is ordered and goes all the way through up to the way that the final invoice is processed, providing the full insight into the “cash flow” as well as the financial commitments. Nowadays, the “transaction” is treated as an important tool for proper implementation of both budgeting and the resource accounting.
The automated purchasing policies and procedures as well as invoice processing can bring the financial rigor and process efficiency to the business of buying. All spending, capital, credit card and reimbursable spending can be captured and controlled with the help of the automated purchase-to-pay systems within the purchase orders as well as non-purchase orders. The finance departments can also enforce the internal spending controls and have an instant access to any needed data, receiving in this way all of the needed information about who spends their money on what, getting to know who the vendors are.
To be able to succeed in your business of providing the goods and services in order for them to look attractive and so to get more clients and money, it is more than necessary to know the tools for capturing the needed data to use it to improve your own products. Every single sphere of business nowadays requires a coordinated as well as a collaborative response between the functional departments, especially in finance and procurement. The intelligent implementation of the appropriate integrative knowledge of sharing tools and systems is necessary to have in order to achieve your goals. Thus, another process known as “procure-to-pay”, is important to get through as it is simply the start of the procurement process from the moment when the purchasing department starts working until the moment the invoices are paid.

Example 2. Purchasing Flowchart. Purchase Order
Being busy working on improving the goods and services, which your company provides, it is also very important to develop the marketing strategy, which, nowadays, have to be improved as much as it is possible, using all of the available tools. One of the most useful things to have while developing your business is ConceptDraw DIAGRAM software. This unique application offers a various range of tools, which all can be used for improving the situation with your business, providing all of the needed symbols to create the charts, flowcharts and diagrams, including the purchasing flowcharts, which all can be very useful for filling your presentation as well as the websites with.
Having ConceptDraw DIAGRAM software and the “Accounting Flowcharts solution” from the “Finance and Accounting area” of ConceptDraw Solution Park on this site means having everything you need in order to create your own flow charts of purchasing business processes while working in the ConceptDraw DIAGRAM diagramming and vector drawing software.


